| Param | Original file | Final file |
|---|---|---|
| Filename | modeM0/AS1A05_163T01_9000003118_21093cztM0_level2.evt | modeM0/AS1A05_163T01_9000003118_21093cztM0_level2_quad_clean.evt |
| Size (bytes) | 1,715,849,280 | 182,531,520 |
| Size | 1.6 GB | 174.1 MB |
| Events in quadrant A | 8,522,642 | 1,200,042 |
| Events in quadrant B | 9,167,618 | 1,202,799 |
| Events in quadrant C | 8,360,106 | 1,155,706 |
| Events in quadrant D | 24,759,349 | 785,233 |
| Mode M9 | |||
|---|---|---|---|
| Quadrant | BADHDUFLAG | Total packets | Discarded packets |
| A | 0 | 25 | 0 |
| B | 0 | 25 | 0 |
| C | 0 | 25 | 0 |
| D | 0 | 25 | 0 |
| Mode M0 | |||
|---|---|---|---|
| Quadrant | BADHDUFLAG | Total packets | Discarded packets |
| A | 0 | 36151 | 3 |
| B | 0 | 37639 | 4 |
| C | 0 | 35541 | 3 |
| D | 0 | 85217 | 3 |
| Mode SS | |||
|---|---|---|---|
| Quadrant | BADHDUFLAG | Total packets | Discarded packets |
| A | 0 | 350 | 0 |
| B | 0 | 350 | 0 |
| C | 0 | 350 | 0 |
| D | 0 | 350 | 0 |
| Quadrant | Total seconds | Saturated seconds | Saturation percentage |
|---|---|---|---|
| A | 17138 | 204 | 1.190337% |
| B | 17137 | 281 | 1.639727% |
| C | 17137 | 217 | 1.266266% |
| D | 17139 | 5769 | 33.660074% |
Noise dominated data is calculated using 1-second bins in cleaned event files. If a bin has >2000 counts, and if more than 50% of those come from <1% of pixels, then it is considered to be noise-dominated and hence unusable.
| Quadrant | # 1 sec bins | Bins with >0 counts | Bins with >2000 counts | High rate bins dominated by noise | Noise dominated (total time) | Noise dominated (detector-on time) | Marked lightcurve |
|---|---|---|---|---|---|---|---|
| A | 19638 | 17141 | 64 | 64 | 0.33% | 0.37% | 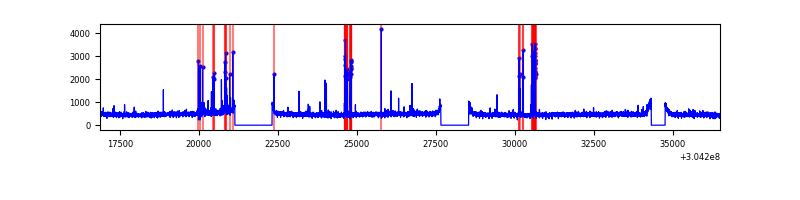 |
| B | 19638 | 17141 | 58 | 58 | 0.30% | 0.34% | 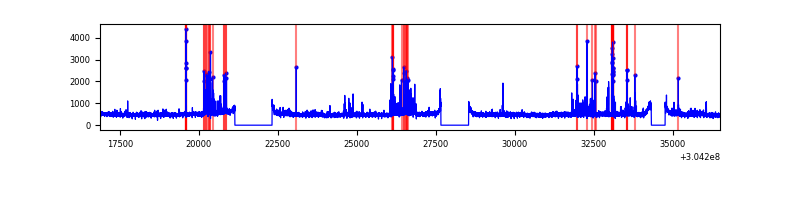 |
| C | 19638 | 17141 | 20 | 20 | 0.10% | 0.12% | 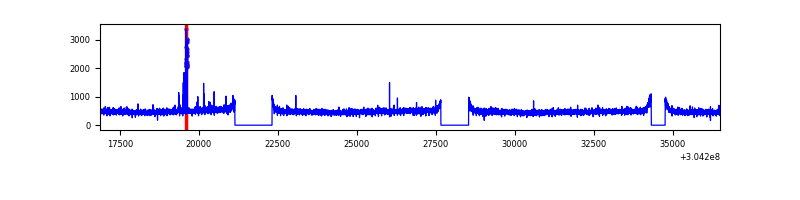 |
| D | 19639 | 17141 | 5355 | 5355 | 27.27% | 31.24% | 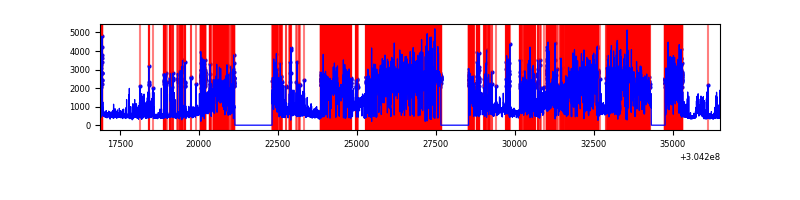 |
Top three noisy pixels from each quadrant. If the there are fewer than three noisy pixels in the level2.evt file, extra rows are filled as -1
| Pixel properties | Quadrant properties | ||||||
|---|---|---|---|---|---|---|---|
| Quadrant | DetID | PixID | Counts | Sigma | Mean | Median | Sigma |
| A | 5 | 16 | 337686 | 791.68 | 2116 | 2070 | 423.9 |
| A | 15 | 192 | 32228 | 71.14 | 2116 | 2070 | 423.9 |
| A | 13 | 254 | 23534 | 50.63 | 2116 | 2070 | 423.9 |
| B | 7 | 220 | 472319 | 1175.32 | 2116 | 2065 | 400.1 |
| B | 0 | 219 | 226371 | 560.61 | 2116 | 2065 | 400.1 |
| B | 3 | 64 | 95838 | 234.37 | 2116 | 2065 | 400.1 |
| C | 14 | 238 | 316044 | 661.73 | 2029 | 2046 | 474.5 |
| C | 7 | 221 | 113299 | 234.46 | 2029 | 2046 | 474.5 |
| C | 9 | 54 | 24007 | 46.28 | 2029 | 2046 | 474.5 |
| D | 1 | 239 | 13878312 | 33057.63 | 1730 | 1683 | 419.8 |
| D | 1 | 52 | 3088962 | 7354.68 | 1730 | 1683 | 419.8 |
| D | 13 | 153 | 545503 | 1295.52 | 1730 | 1683 | 419.8 |
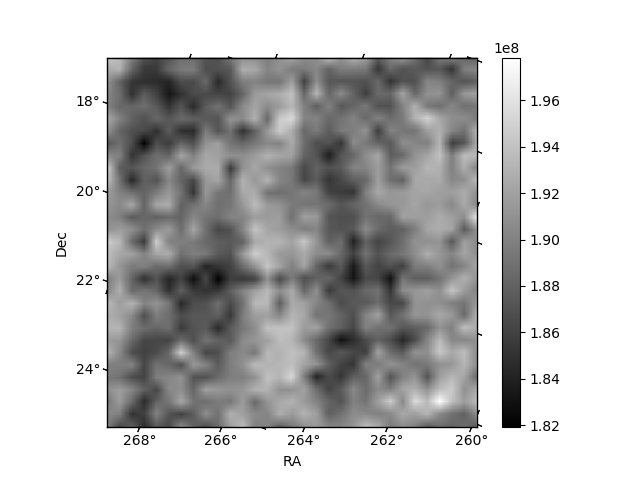
Histogram calculated using DETX and DETY for each event in the final _common_clean file
| Quadrant A | 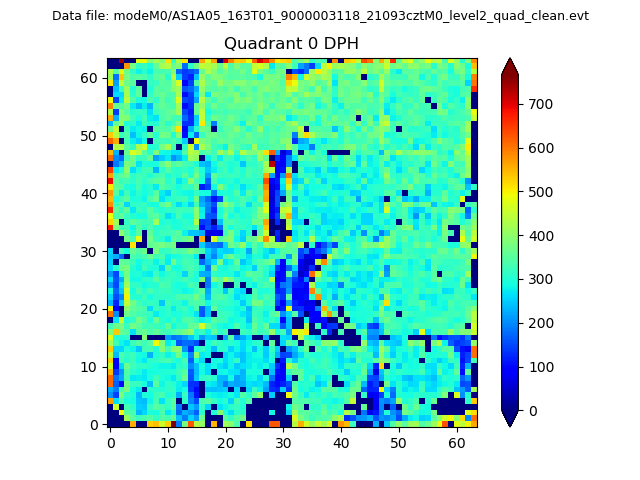 |
 |
Quadrant B |
|---|---|---|---|
| Quadrant D | 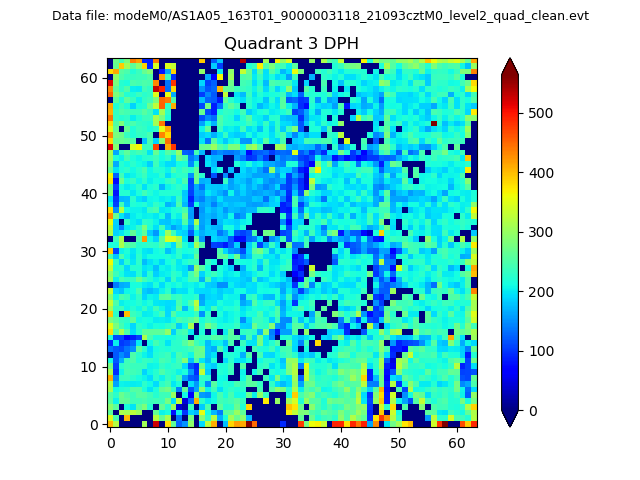 |
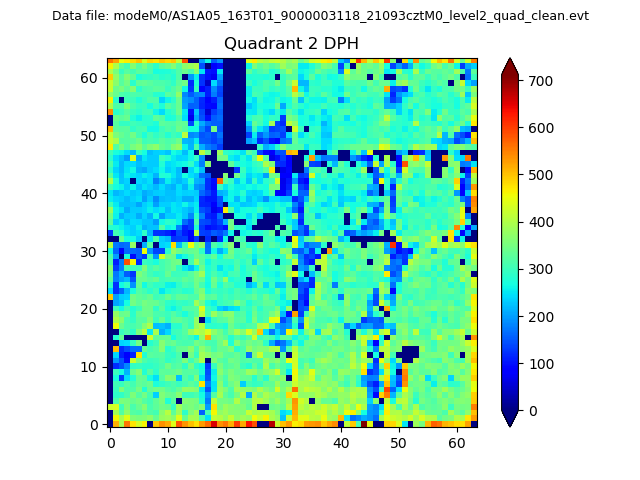 |
Quadrant C |
| Plot type | Count rate plots | Images |
|---|---|---|
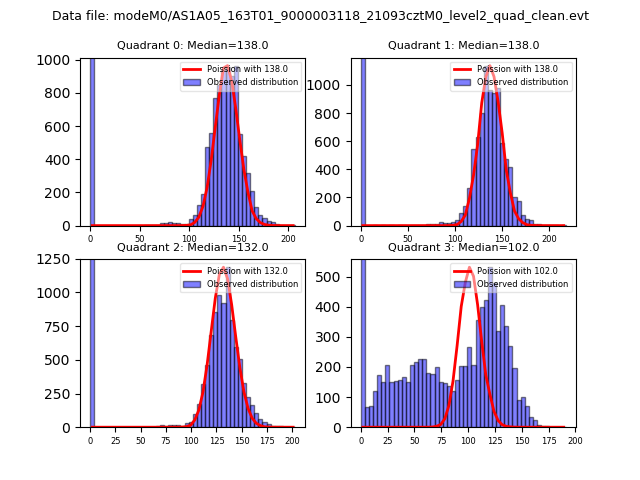
| Comparison with Poisson distribution Blue bars denote a histogram of data divided into 1 sec bins. Red curve is a Poisson curve with rate = median count rate of data. |
 |
 |
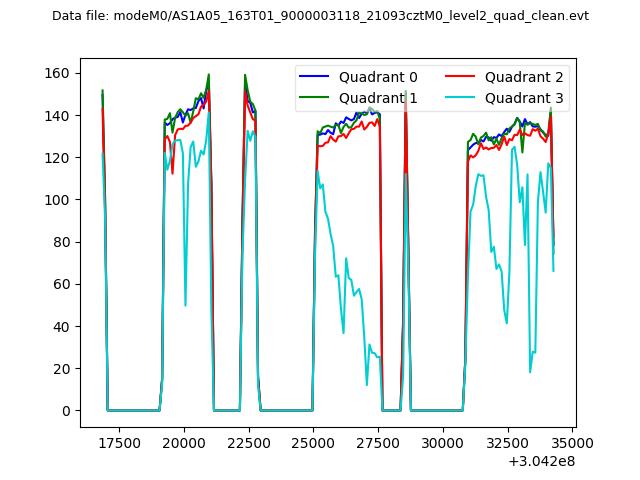
| Quadrant-wise count rates Data is divided into 100 sec bins |
 |
|
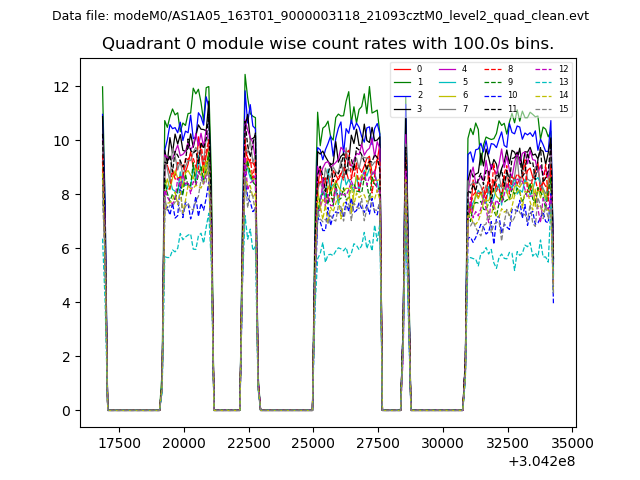
| Module-wise count rates for Quadrant A Data is divided into 100 sec bins |
 |
 |
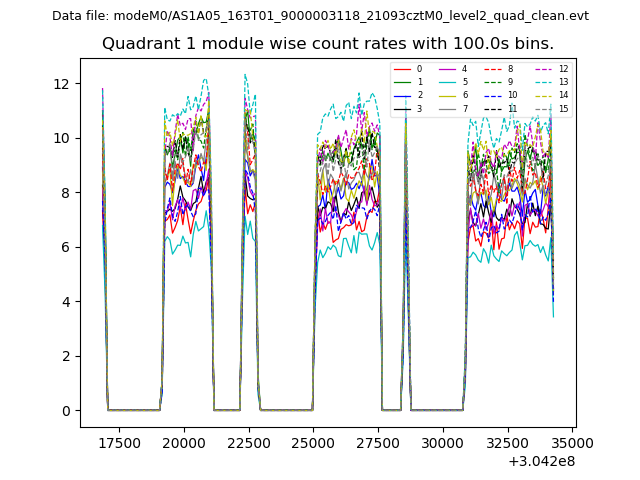
| Module-wise count rates for Quadrant B Data is divided into 100 sec bins |
 |
 |
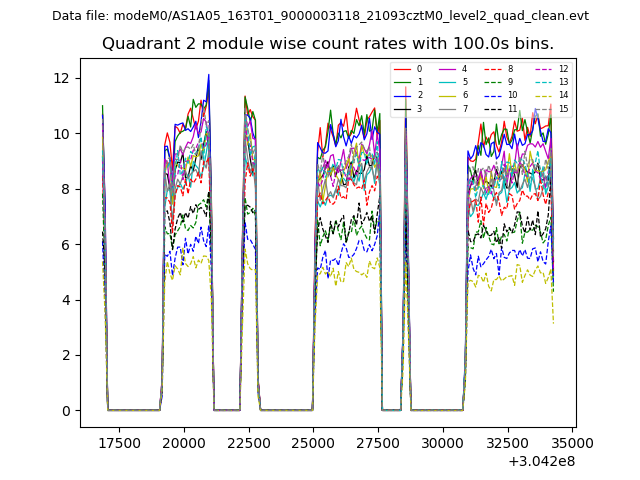
| Module-wise count rates for Quadrant C Data is divided into 100 sec bins |
 |
 |
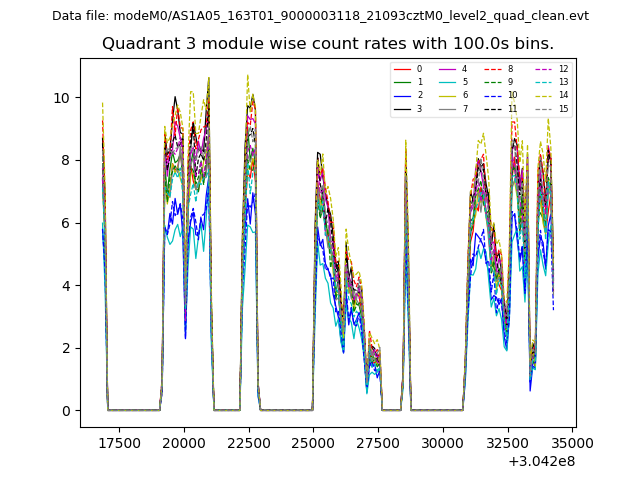
| Module-wise count rates for Quadrant D Data is divided into 100 sec bins |
 |
 |
| Parameter | Plot |
|---|---|
| CZT HV Monitor | 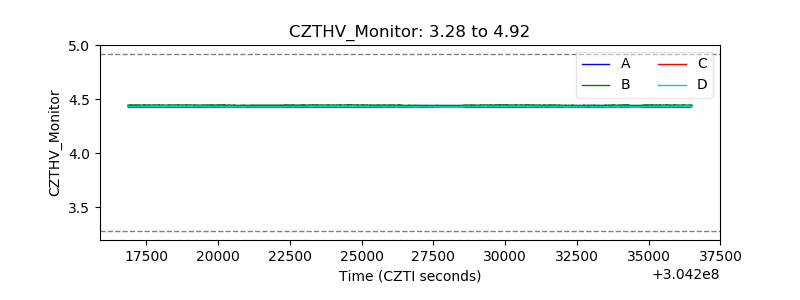 |
| D_VDD | 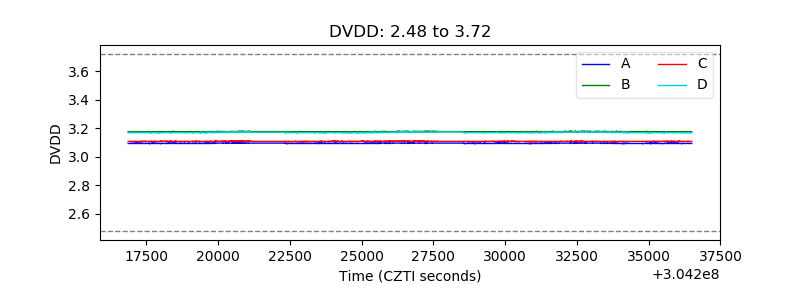 |
| Temperature 1 | 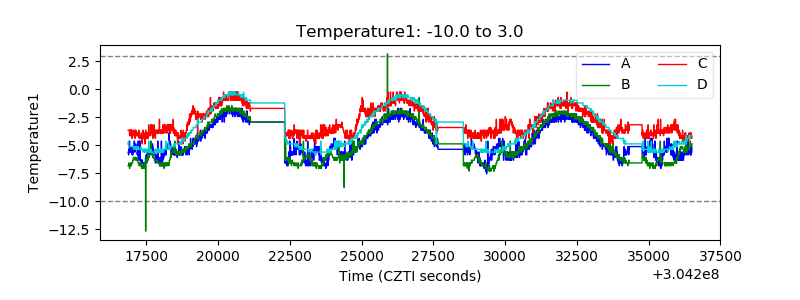 |
| Veto HV Monitor | 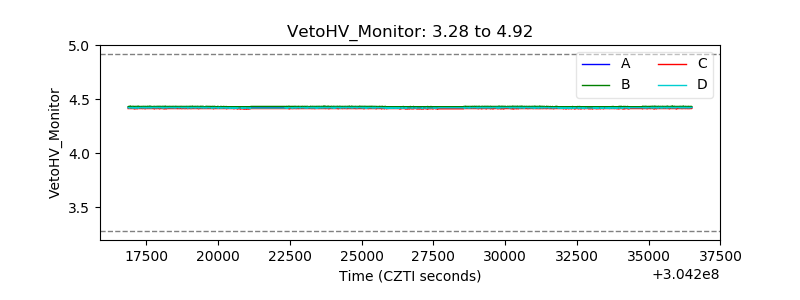 |
| Veto LLD | 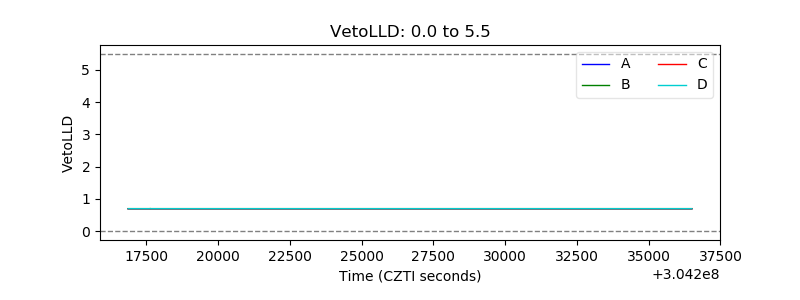 |
| Alpha Counter | 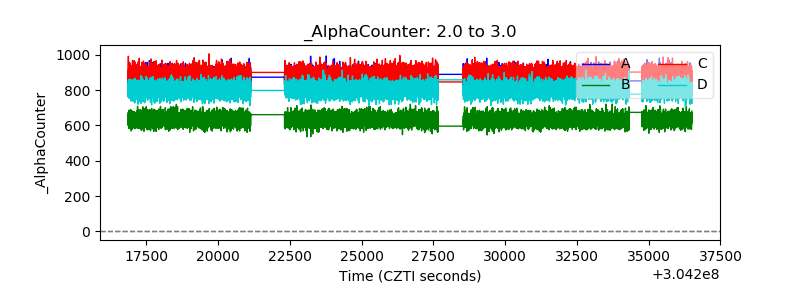 |
| _CPM_Rate | 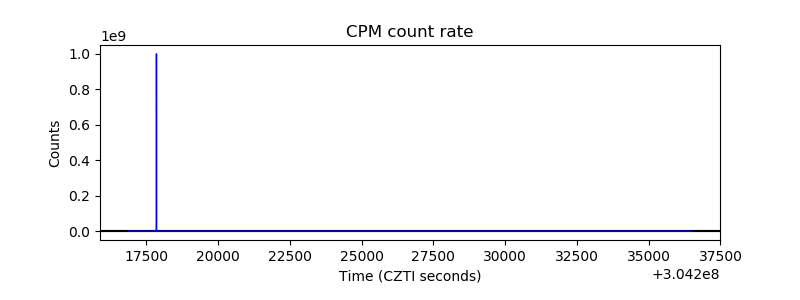 |
| CZT Counter | 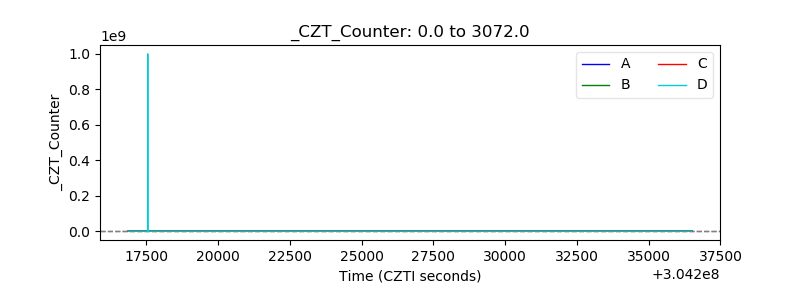 |
| +2.5 Volts monitor |  |
| +5 Volts monitor |  |
| _ROLL_ROT | 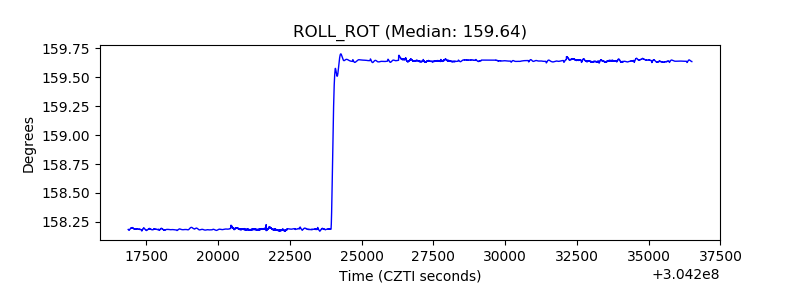 |
| _Roll_DEC |  |
| _Roll_RA | 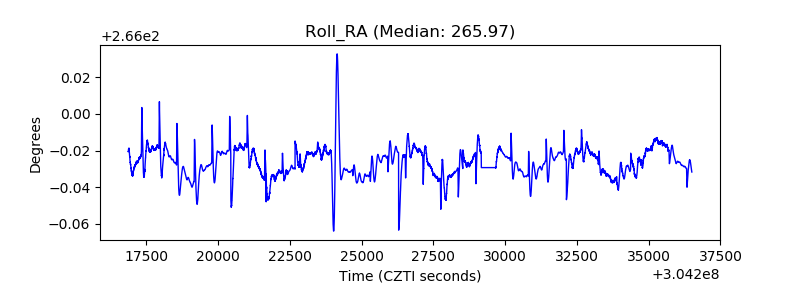 |
| Veto Counter | 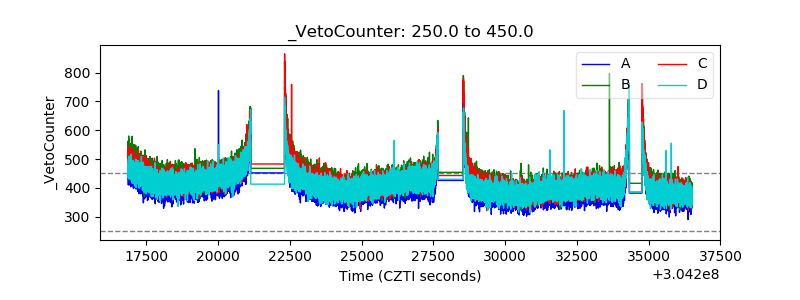 |