| Param | Original file | Final file |
|---|---|---|
| Filename | modeM0/AS1A05_163T01_9000003118_21095cztM0_level2.evt | modeM0/AS1A05_163T01_9000003118_21095cztM0_level2_quad_clean.evt |
| Size (bytes) | 559,327,680 | 84,936,960 |
| Size | 533.4 MB | 81.0 MB |
| Events in quadrant A | 3,674,465 | 522,598 |
| Events in quadrant B | 3,985,370 | 527,146 |
| Events in quadrant C | 3,704,788 | 504,280 |
| Events in quadrant D | 5,049,726 | 480,074 |
| Mode M9 | |||
|---|---|---|---|
| Quadrant | BADHDUFLAG | Total packets | Discarded packets |
| A | 0 | 5 | 0 |
| B | 0 | 5 | 0 |
| C | 0 | 5 | 0 |
| D | 0 | 5 | 0 |
| Mode M0 | |||
|---|---|---|---|
| Quadrant | BADHDUFLAG | Total packets | Discarded packets |
| A | 0 | 15933 | 2 |
| B | 0 | 16623 | 2 |
| C | 0 | 15943 | 2 |
| D | 0 | 20003 | 2 |
| Mode SS | |||
|---|---|---|---|
| Quadrant | BADHDUFLAG | Total packets | Discarded packets |
| A | 0 | 158 | 0 |
| B | 0 | 158 | 0 |
| C | 0 | 158 | 0 |
| D | 0 | 158 | 0 |
| Quadrant | Total seconds | Saturated seconds | Saturation percentage |
|---|---|---|---|
| A | 7734 | 260 | 3.361779% |
| B | 7734 | 306 | 3.956555% |
| C | 7734 | 281 | 3.633307% |
| D | 7735 | 413 | 5.339367% |
Noise dominated data is calculated using 1-second bins in cleaned event files. If a bin has >2000 counts, and if more than 50% of those come from <1% of pixels, then it is considered to be noise-dominated and hence unusable.
| Quadrant | # 1 sec bins | Bins with >0 counts | Bins with >2000 counts | High rate bins dominated by noise | Noise dominated (total time) | Noise dominated (detector-on time) | Marked lightcurve |
|---|---|---|---|---|---|---|---|
| A | 8209 | 7736 | 0 | 0 | 0.00% | 0.00% | 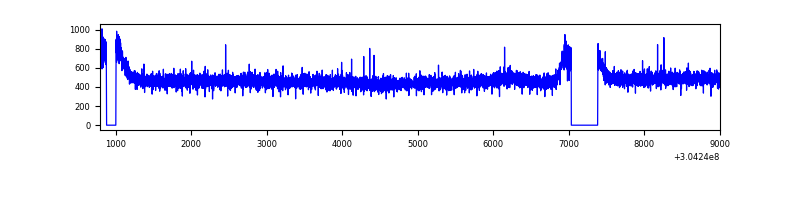 |
| B | 8209 | 7736 | 4 | 4 | 0.05% | 0.05% | 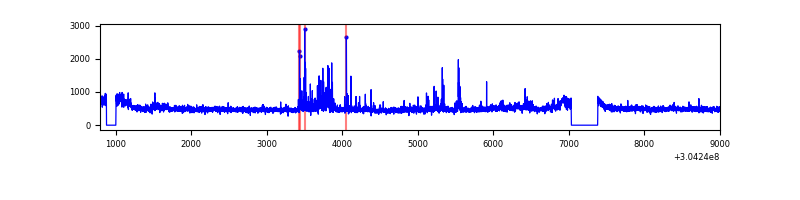 |
| C | 8209 | 7736 | 0 | 0 | 0.00% | 0.00% | 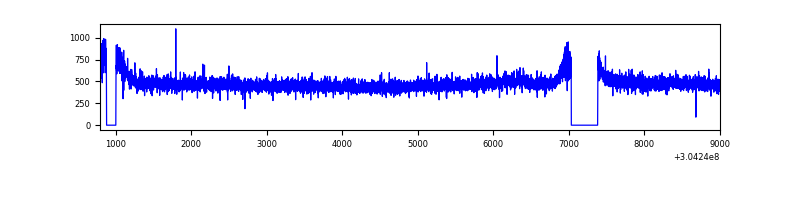 |
| D | 8210 | 7736 | 193 | 193 | 2.35% | 2.49% | 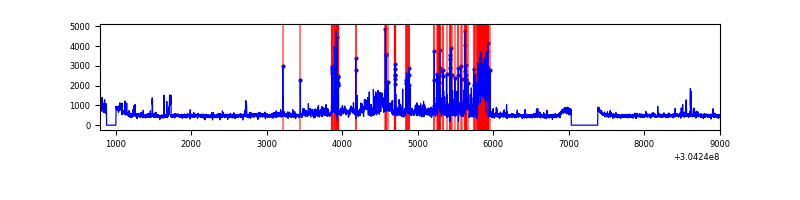 |
Top three noisy pixels from each quadrant. If the there are fewer than three noisy pixels in the level2.evt file, extra rows are filled as -1
| Pixel properties | Quadrant properties | ||||||
|---|---|---|---|---|---|---|---|
| Quadrant | DetID | PixID | Counts | Sigma | Mean | Median | Sigma |
| A | 13 | 254 | 10053 | 47.32 | 948 | 926 | 192.9 |
| A | 15 | 192 | 9012 | 41.92 | 948 | 926 | 192.9 |
| A | 3 | 137 | 8401 | 38.75 | 948 | 926 | 192.9 |
| B | 7 | 220 | 117208 | 636.28 | 946 | 921 | 182.8 |
| B | 0 | 219 | 101758 | 551.75 | 946 | 921 | 182.8 |
| B | 12 | 111 | 22706 | 119.2 | 946 | 921 | 182.8 |
| C | 14 | 238 | 142157 | 656.94 | 913 | 916 | 215.0 |
| C | 13 | 61 | 6353 | 25.29 | 913 | 916 | 215.0 |
| C | 8 | 128 | 2773 | 8.64 | 913 | 916 | 215.0 |
| D | 1 | 239 | 591739 | 2622.26 | 917 | 889 | 225.3 |
| D | 1 | 52 | 391928 | 1735.48 | 917 | 889 | 225.3 |
| D | 1 | 20 | 391379 | 1733.04 | 917 | 889 | 225.3 |
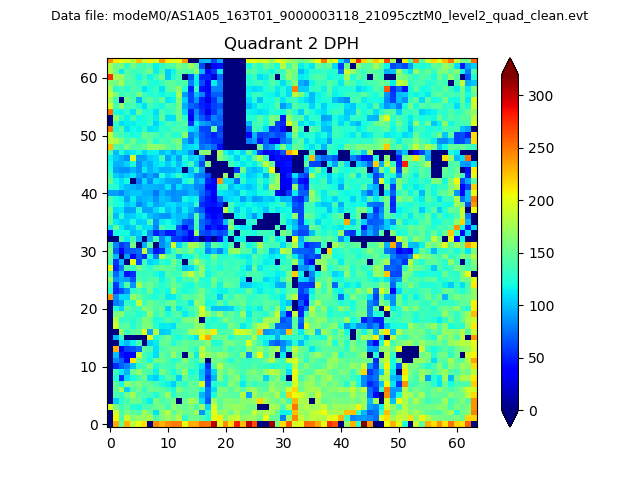
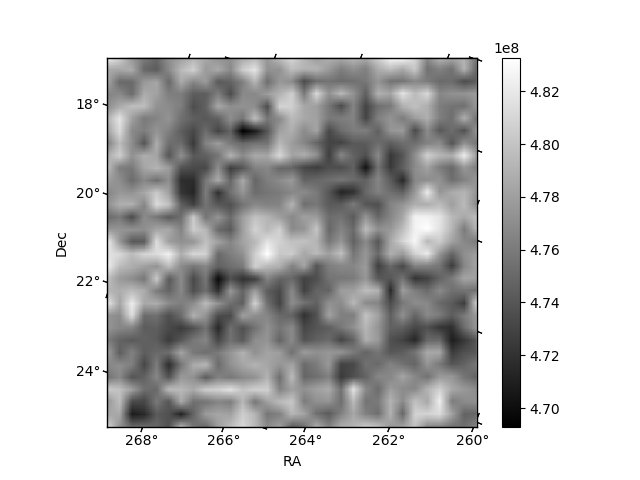
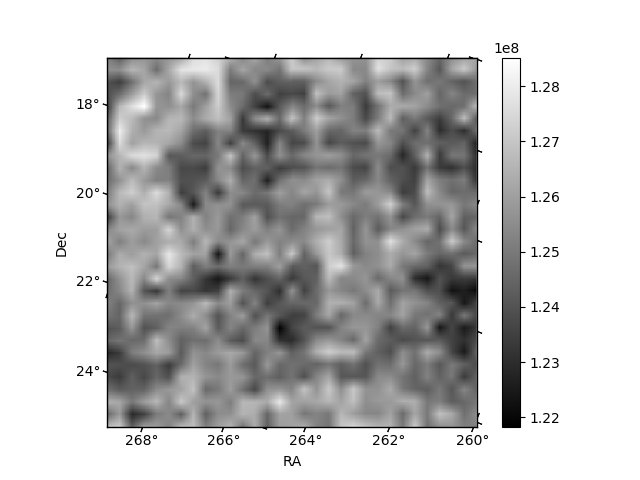
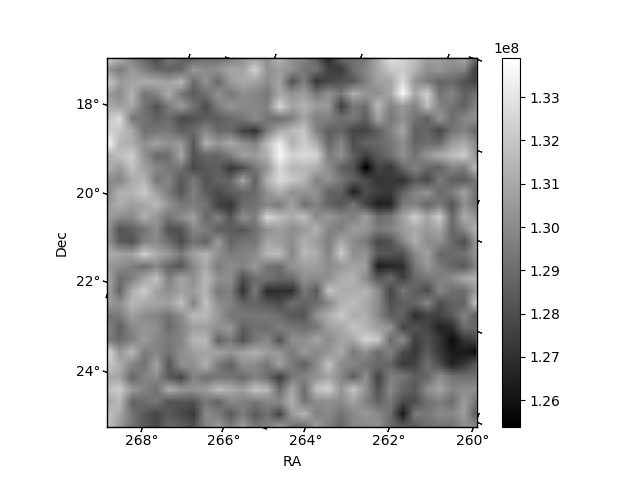
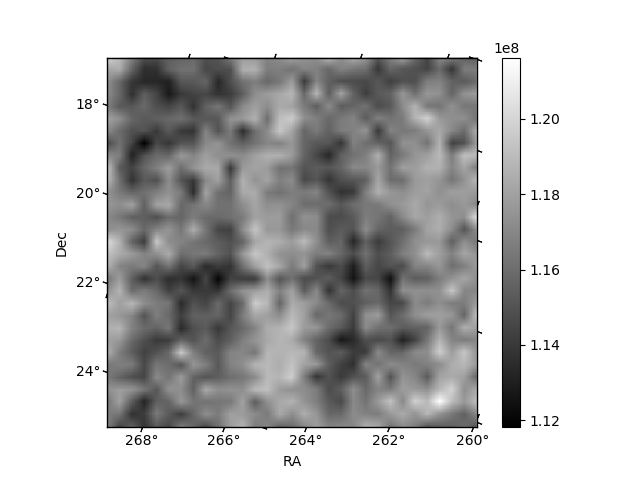
Histogram calculated using DETX and DETY for each event in the final _common_clean file
| Quadrant A | 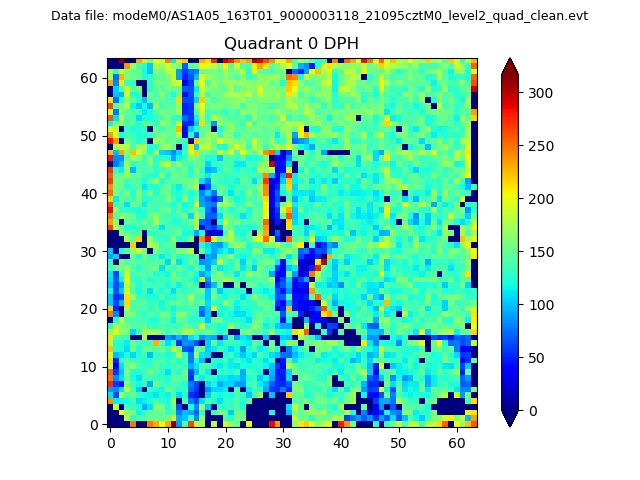 |
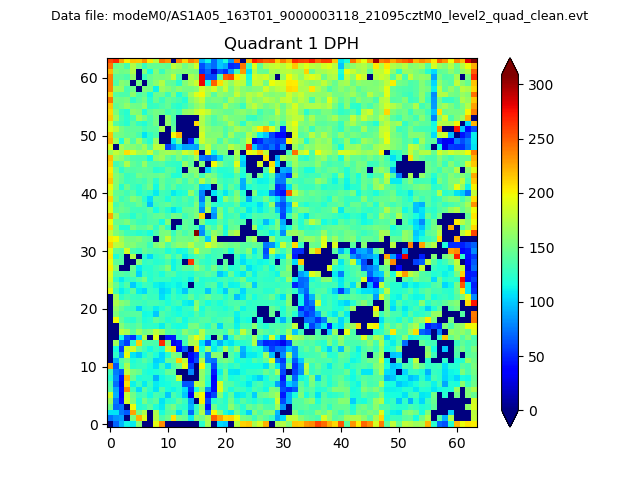 |
Quadrant B |
|---|---|---|---|
| Quadrant D | 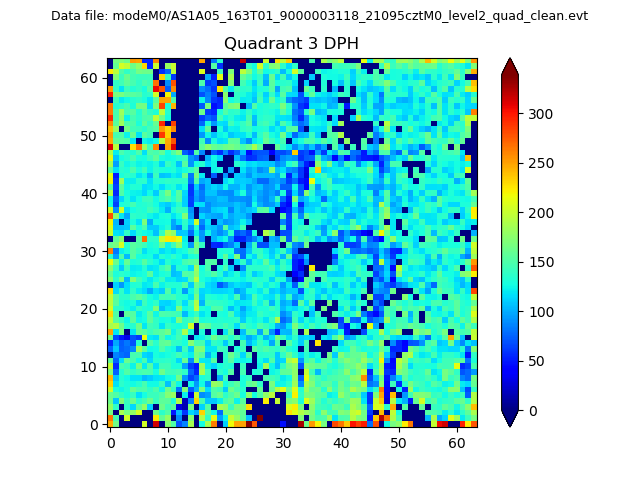 |
 |
Quadrant C |
| Plot type | Count rate plots | Images |
|---|---|---|
| Comparison with Poisson distribution Blue bars denote a histogram of data divided into 1 sec bins. Red curve is a Poisson curve with rate = median count rate of data. |
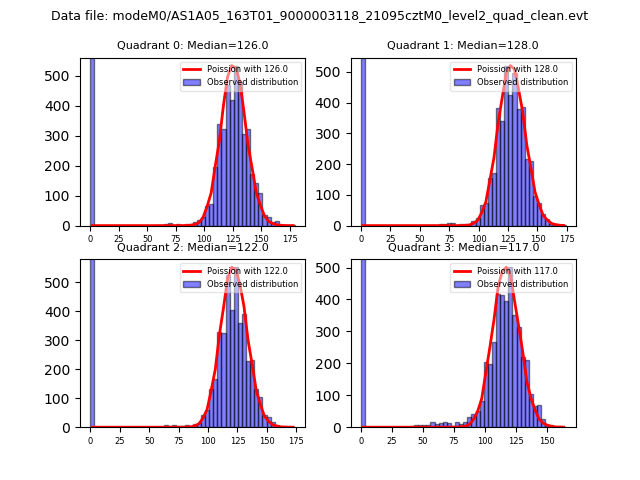 |
 |
| Quadrant-wise count rates Data is divided into 100 sec bins |
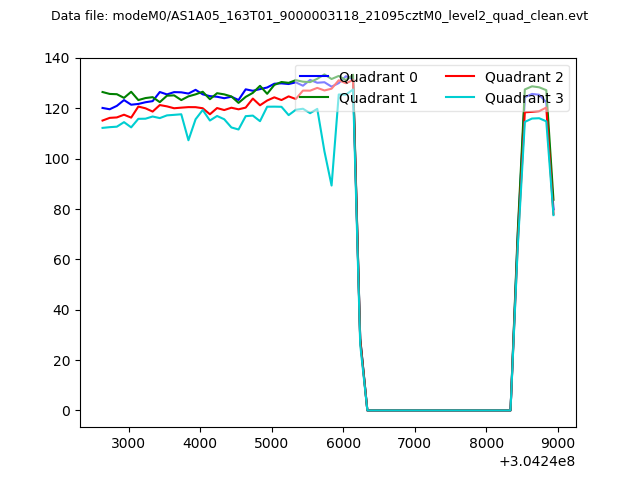 |
|
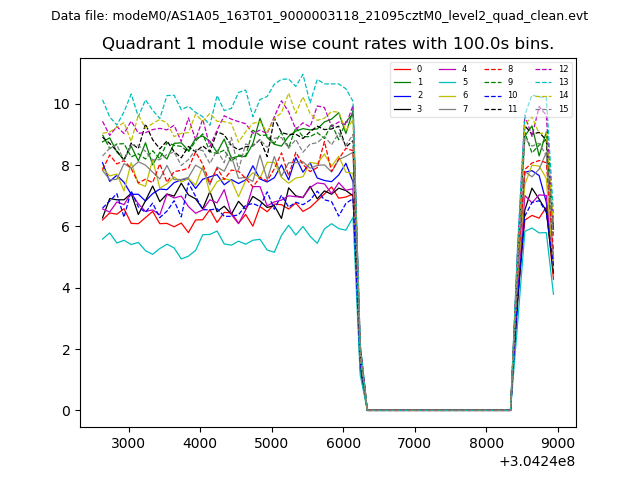
| Module-wise count rates for Quadrant A Data is divided into 100 sec bins |
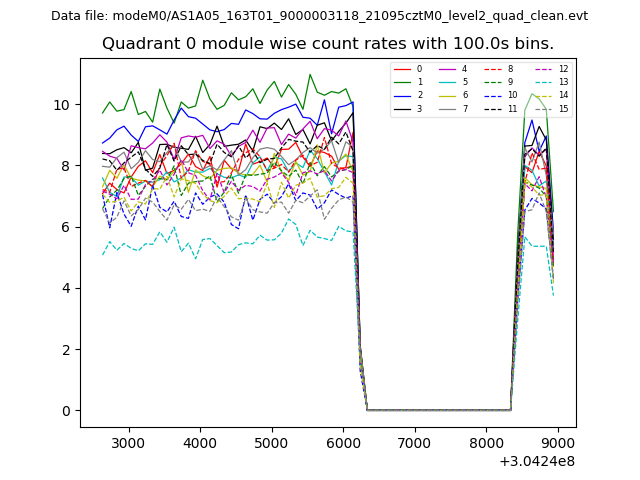 |
 |
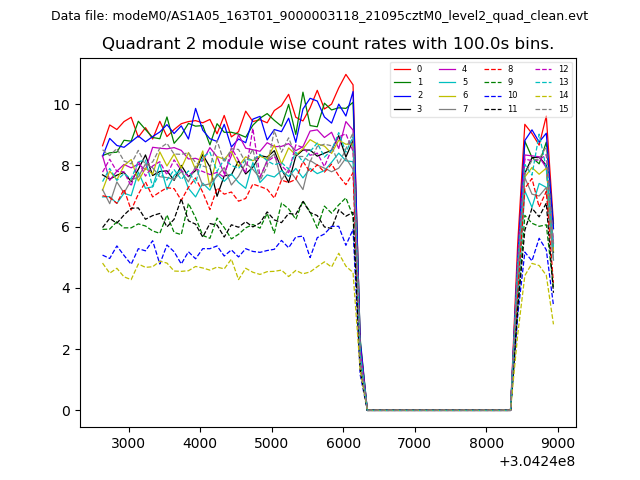
| Module-wise count rates for Quadrant B Data is divided into 100 sec bins |
 |
 |
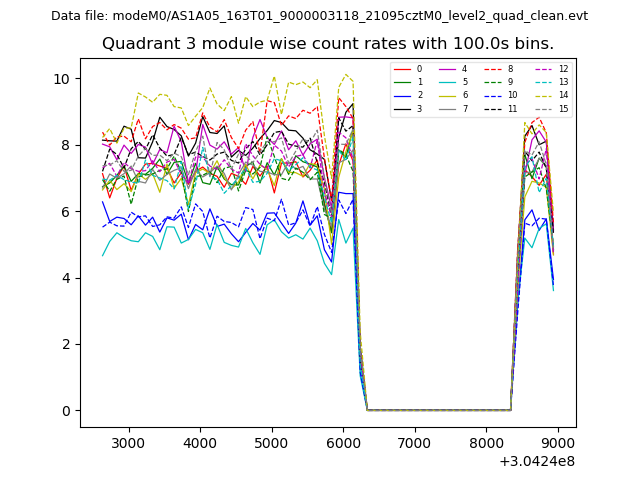
| Module-wise count rates for Quadrant C Data is divided into 100 sec bins |
 |
 |
| Module-wise count rates for Quadrant D Data is divided into 100 sec bins |
 |
 |
| Parameter | Plot |
|---|---|
| CZT HV Monitor | 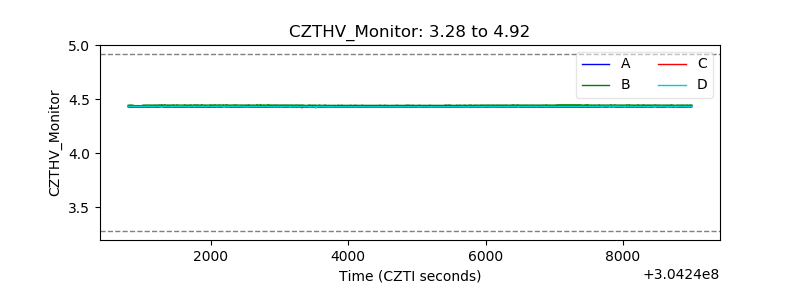 |
| D_VDD | 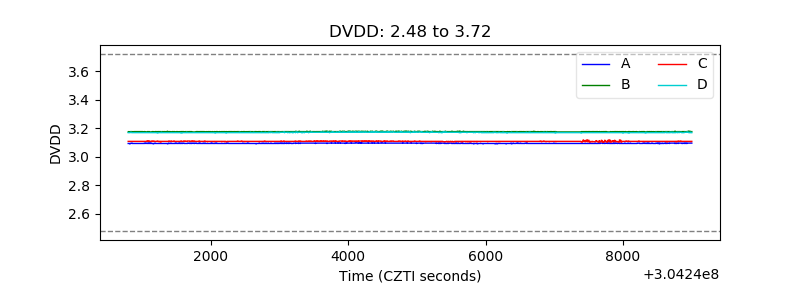 |
| Temperature 1 | 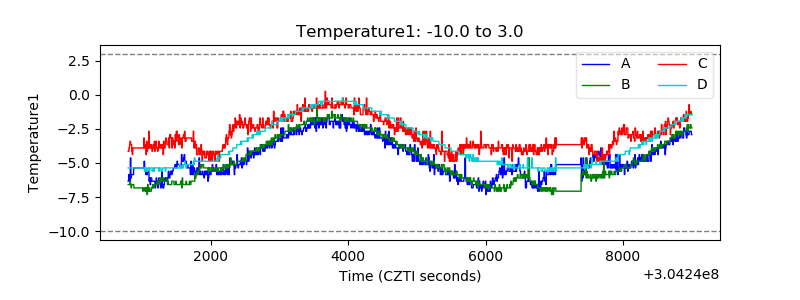 |
| Veto HV Monitor | 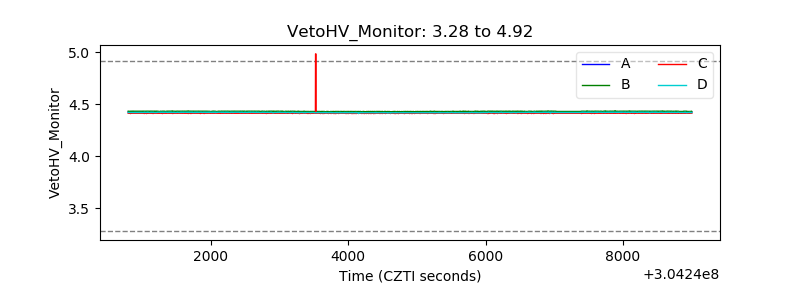 |
| Veto LLD | 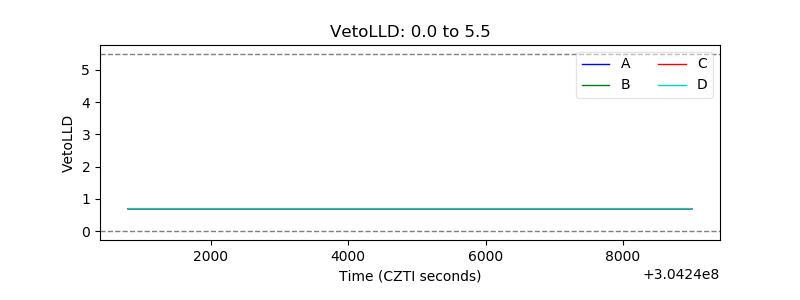 |
| Alpha Counter | 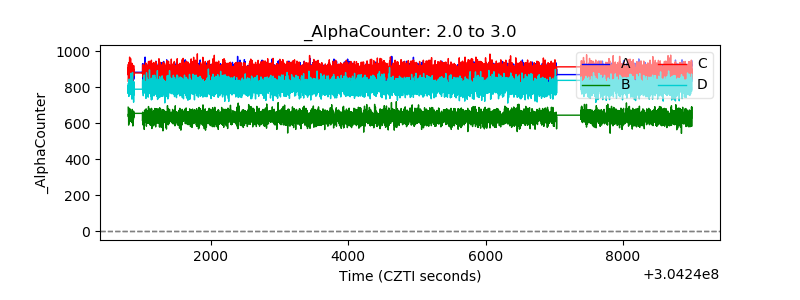 |
| _CPM_Rate | 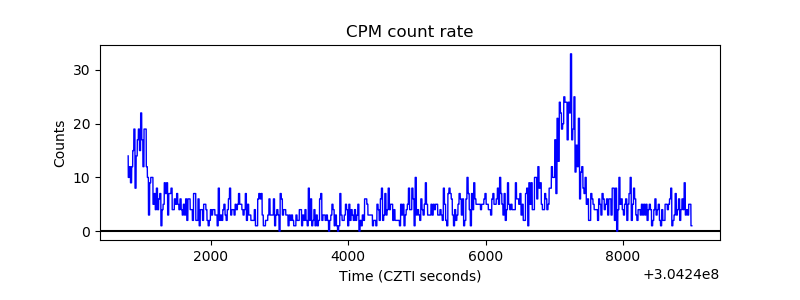 |
| CZT Counter | 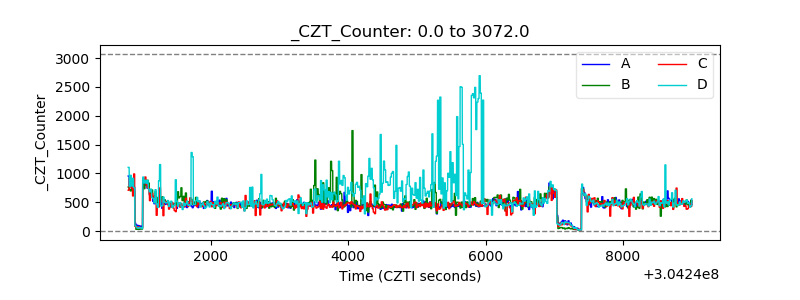 |
| +2.5 Volts monitor | 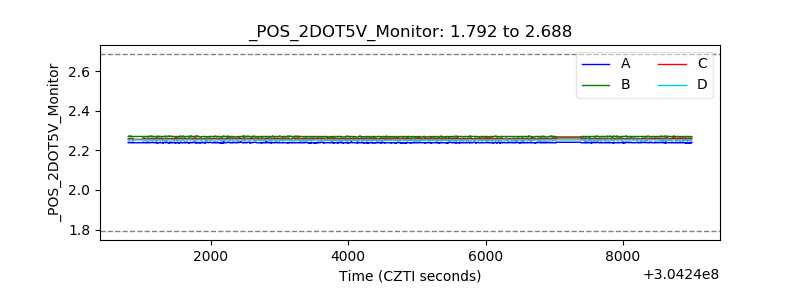 |
| +5 Volts monitor |  |
| _ROLL_ROT | 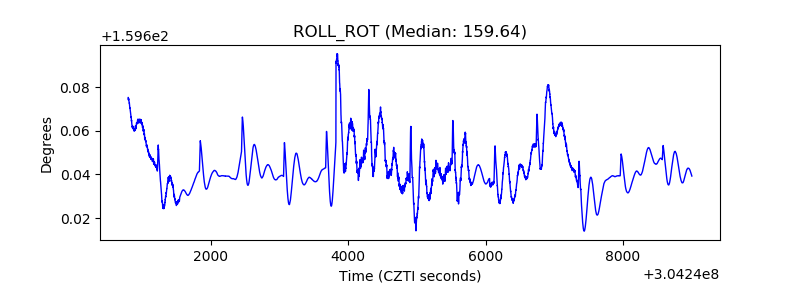 |
| _Roll_DEC | 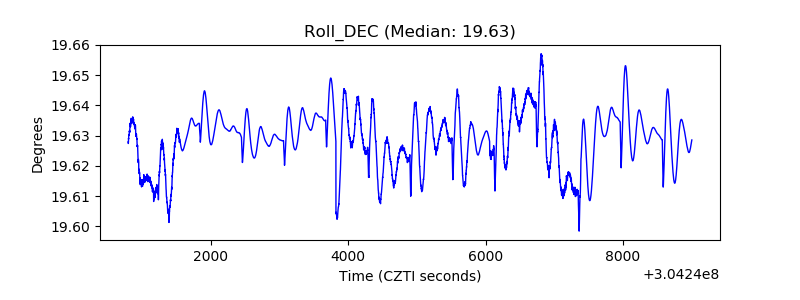 |
| _Roll_RA | 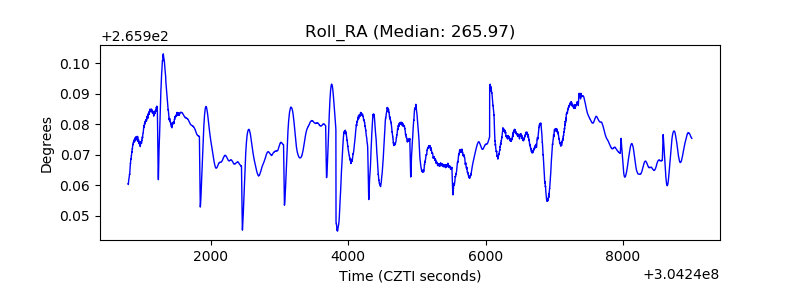 |
| Veto Counter | 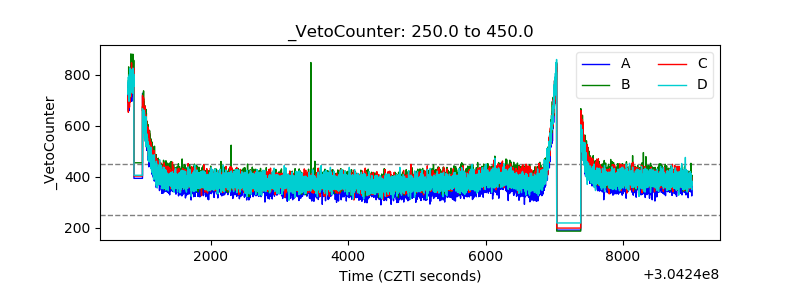 |