| Param | Original file | Final file |
|---|---|---|
| Filename | modeM0/AS1A05_163T01_9000003118_21097cztM0_level2.evt | modeM0/AS1A05_163T01_9000003118_21097cztM0_level2_quad_clean.evt |
| Size (bytes) | 576,486,720 | 98,504,640 |
| Size | 549.8 MB | 93.9 MB |
| Events in quadrant A | 3,770,225 | 625,109 |
| Events in quadrant B | 4,089,238 | 627,733 |
| Events in quadrant C | 3,735,890 | 602,057 |
| Events in quadrant D | 5,328,930 | 580,237 |
| Mode M9 | |||
|---|---|---|---|
| Quadrant | BADHDUFLAG | Total packets | Discarded packets |
| A | 0 | 9 | 0 |
| B | 0 | 9 | 0 |
| C | 0 | 9 | 0 |
| D | 0 | 9 | 0 |
| Mode M0 | |||
|---|---|---|---|
| Quadrant | BADHDUFLAG | Total packets | Discarded packets |
| A | 0 | 16156 | 2 |
| B | 0 | 17058 | 2 |
| C | 0 | 16117 | 3 |
| D | 0 | 20883 | 2 |
| Mode SS | |||
|---|---|---|---|
| Quadrant | BADHDUFLAG | Total packets | Discarded packets |
| A | 0 | 162 | 0 |
| B | 0 | 162 | 0 |
| C | 0 | 162 | 0 |
| D | 0 | 162 | 0 |
| Quadrant | Total seconds | Saturated seconds | Saturation percentage |
|---|---|---|---|
| A | 7882 | 193 | 2.448617% |
| B | 7882 | 242 | 3.070287% |
| C | 7881 | 218 | 2.766146% |
| D | 7881 | 270 | 3.425961% |
Noise dominated data is calculated using 1-second bins in cleaned event files. If a bin has >2000 counts, and if more than 50% of those come from <1% of pixels, then it is considered to be noise-dominated and hence unusable.
| Quadrant | # 1 sec bins | Bins with >0 counts | Bins with >2000 counts | High rate bins dominated by noise | Noise dominated (total time) | Noise dominated (detector-on time) | Marked lightcurve |
|---|---|---|---|---|---|---|---|
| A | 8752 | 7884 | 2 | 2 | 0.02% | 0.03% | 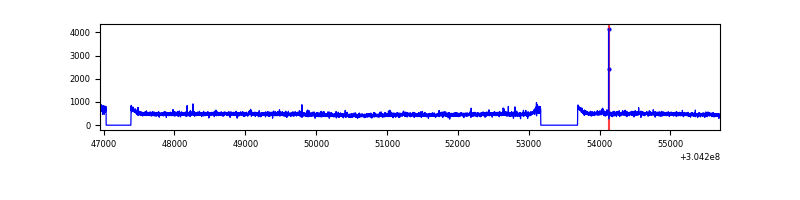 |
| B | 8752 | 7884 | 26 | 26 | 0.30% | 0.33% | 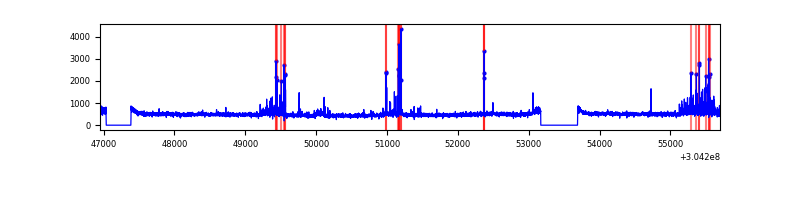 |
| C | 8751 | 7883 | 0 | 0 | 0.00% | 0.00% | 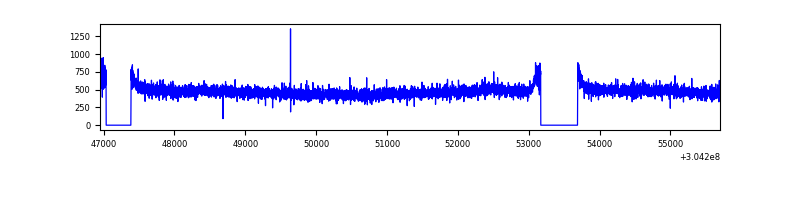 |
| D | 8751 | 7882 | 119 | 119 | 1.36% | 1.51% | 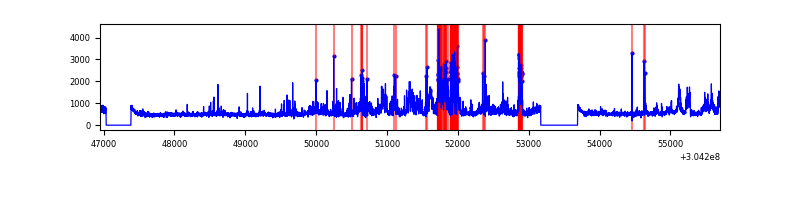 |
Top three noisy pixels from each quadrant. If the there are fewer than three noisy pixels in the level2.evt file, extra rows are filled as -1
| Pixel properties | Quadrant properties | ||||||
|---|---|---|---|---|---|---|---|
| Quadrant | DetID | PixID | Counts | Sigma | Mean | Median | Sigma |
| A | 15 | 192 | 50711 | 256.11 | 959 | 939 | 194.3 |
| A | 10 | 229 | 22914 | 113.08 | 959 | 939 | 194.3 |
| A | 13 | 254 | 9964 | 46.44 | 959 | 939 | 194.3 |
| B | 7 | 220 | 257096 | 1393.54 | 952 | 927 | 183.8 |
| B | 0 | 230 | 41526 | 220.85 | 952 | 927 | 183.8 |
| B | 12 | 111 | 22536 | 117.55 | 952 | 927 | 183.8 |
| C | 14 | 238 | 143631 | 653.64 | 920 | 923 | 218.3 |
| C | 13 | 61 | 6335 | 24.79 | 920 | 923 | 218.3 |
| C | 7 | 221 | 4504 | 16.4 | 920 | 923 | 218.3 |
| D | 1 | 239 | 1115748 | 4897.07 | 931 | 903 | 227.7 |
| D | 13 | 174 | 220456 | 964.41 | 931 | 903 | 227.7 |
| D | 1 | 20 | 184892 | 808.19 | 931 | 903 | 227.7 |
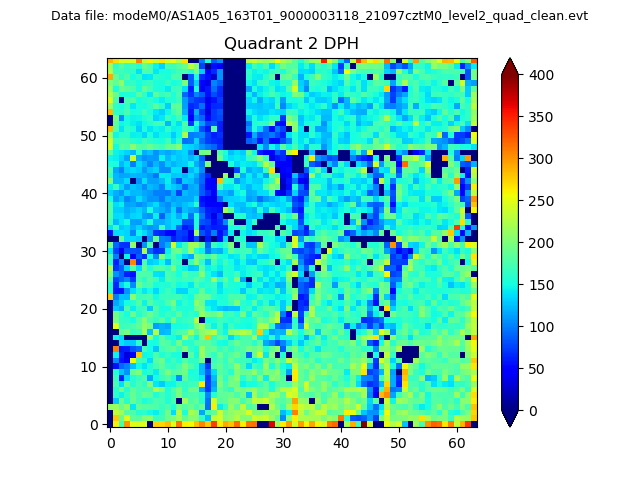
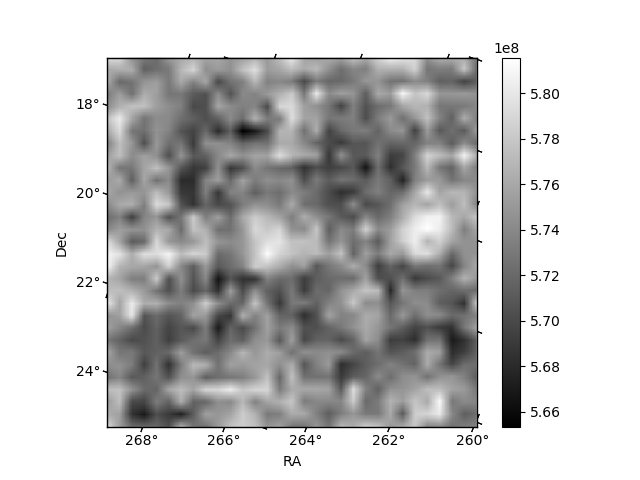
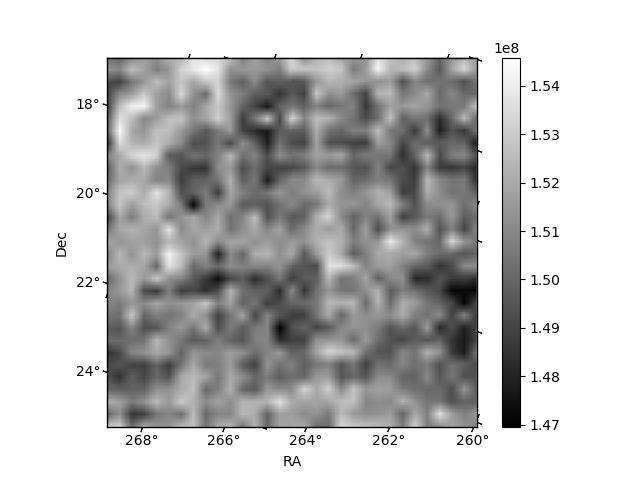
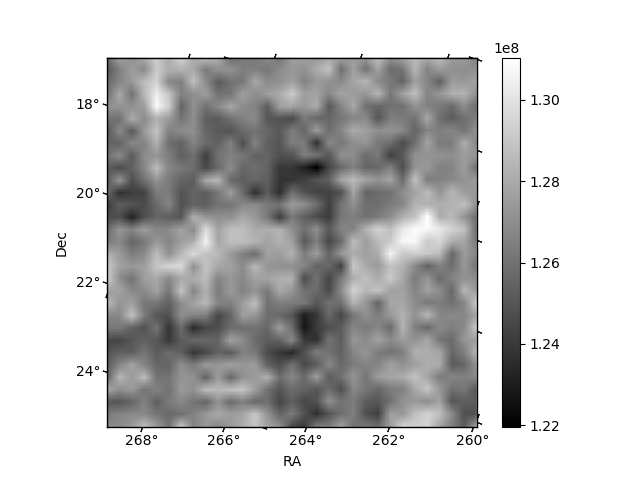
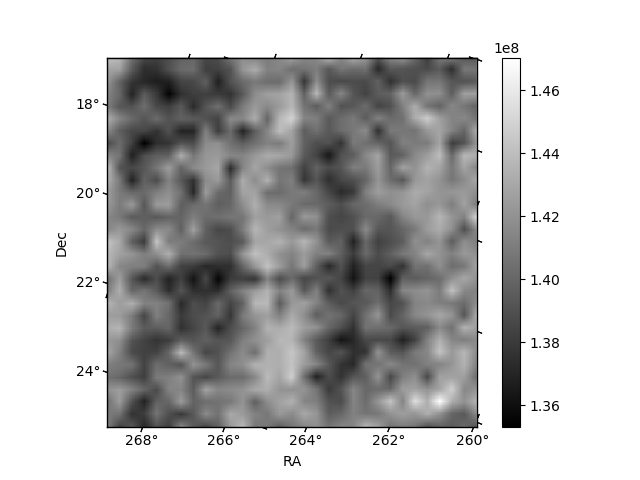
Histogram calculated using DETX and DETY for each event in the final _common_clean file
| Quadrant A | 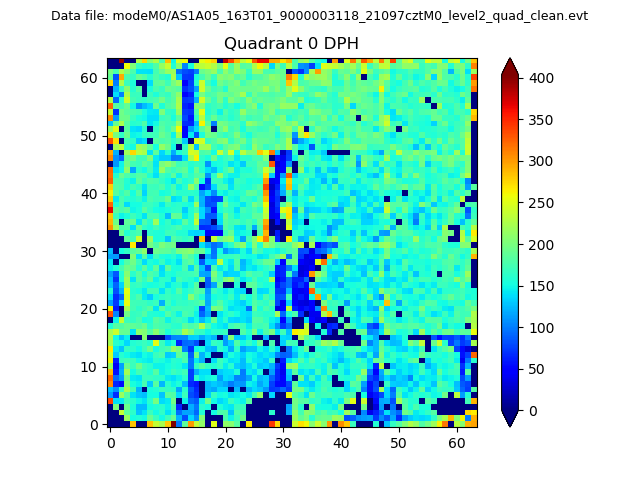 |
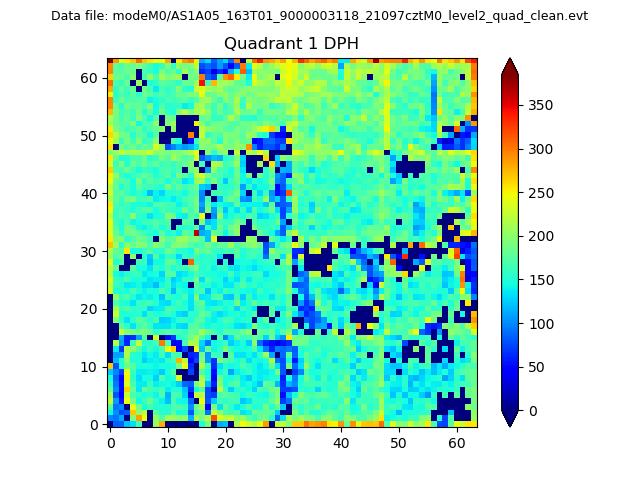 |
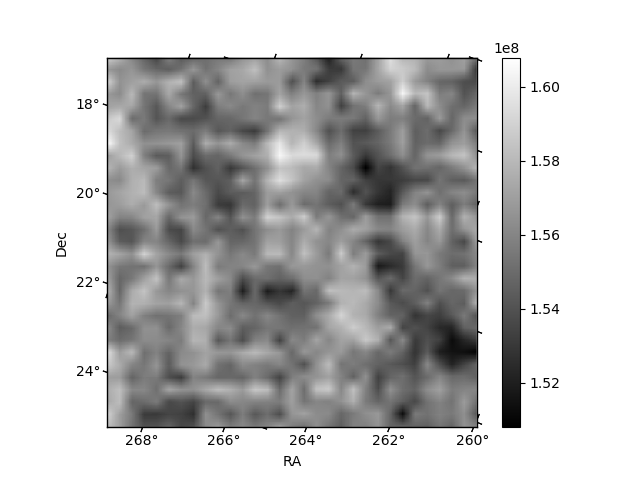
Quadrant B |
|---|---|---|---|
| Quadrant D | 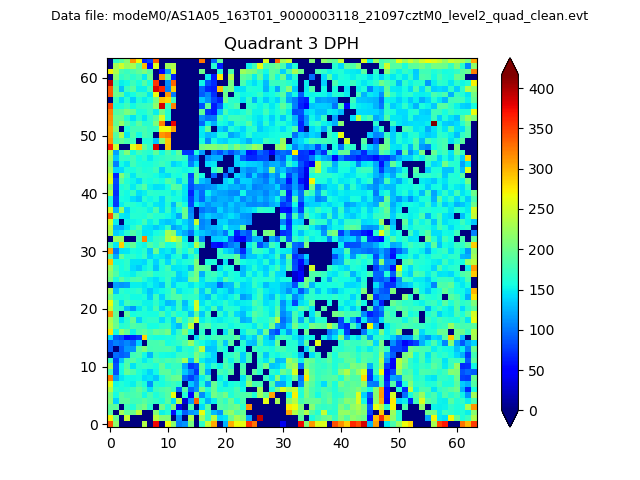 |
 |
Quadrant C |
| Plot type | Count rate plots | Images |
|---|---|---|
| Comparison with Poisson distribution Blue bars denote a histogram of data divided into 1 sec bins. Red curve is a Poisson curve with rate = median count rate of data. |
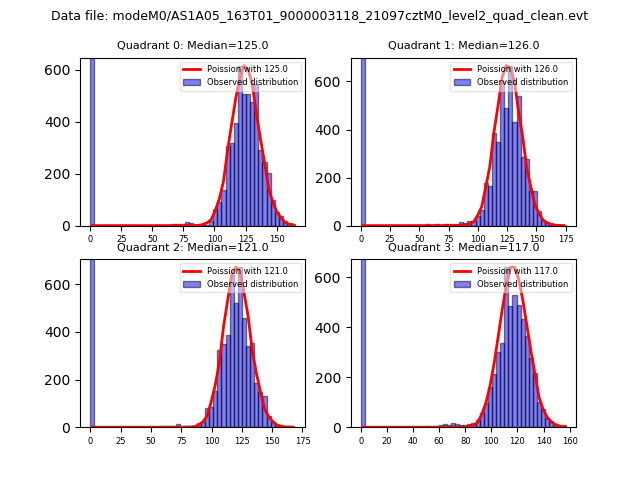 |
 |
| Quadrant-wise count rates Data is divided into 100 sec bins |
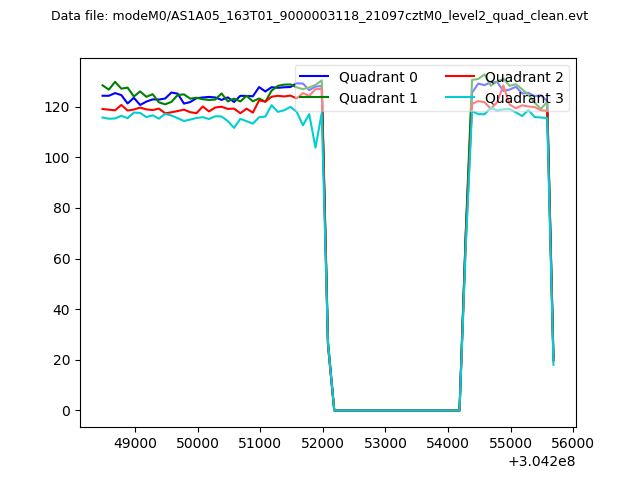 |
|
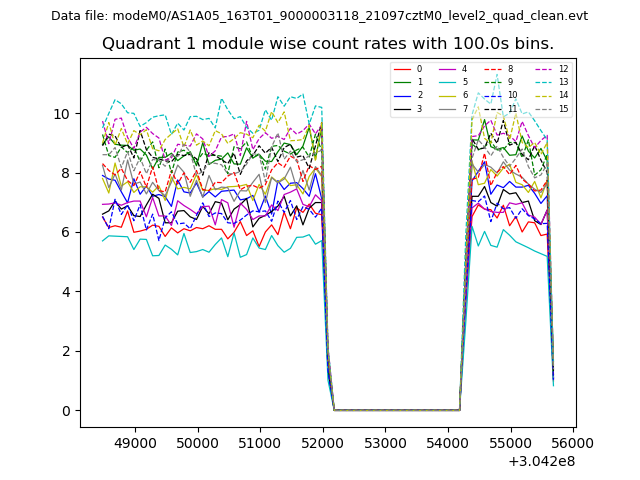
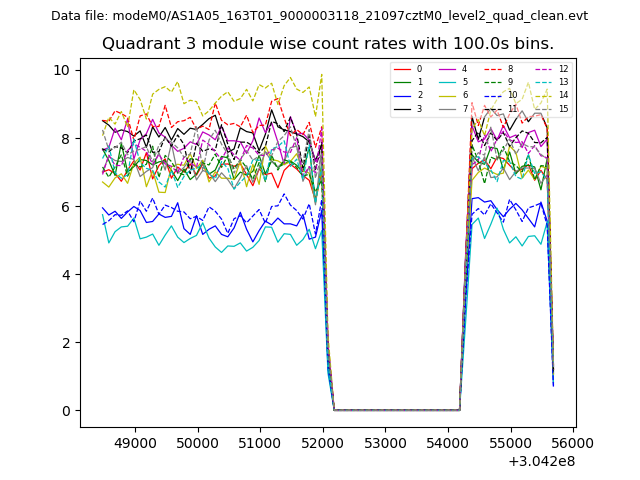
| Module-wise count rates for Quadrant A Data is divided into 100 sec bins |
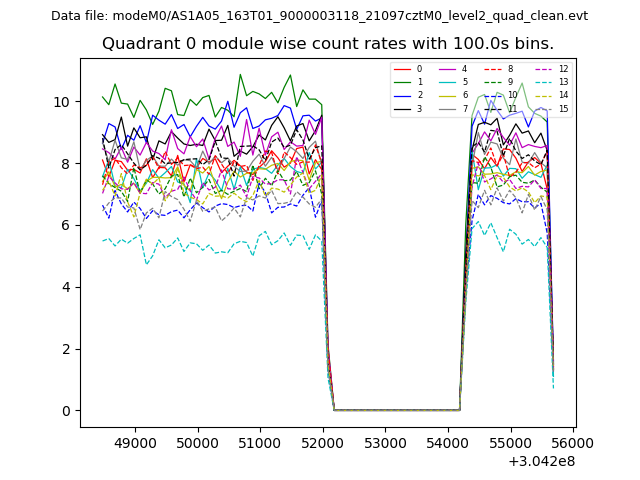 |
 |
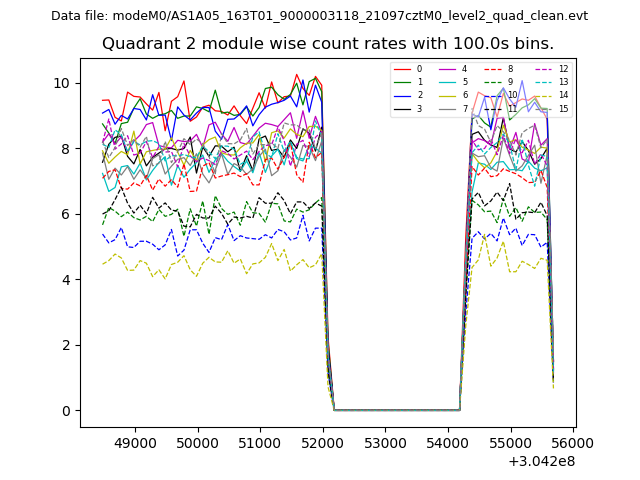
| Module-wise count rates for Quadrant B Data is divided into 100 sec bins |
 |
 |
| Module-wise count rates for Quadrant C Data is divided into 100 sec bins |
 |
 |
| Module-wise count rates for Quadrant D Data is divided into 100 sec bins |
 |
 |
| Parameter | Plot |
|---|---|
| CZT HV Monitor | 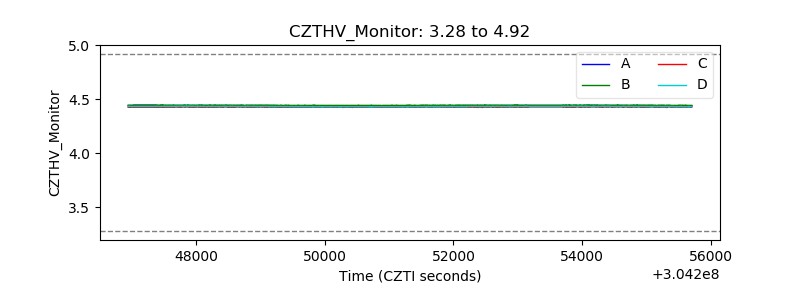 |
| D_VDD |  |
| Temperature 1 | 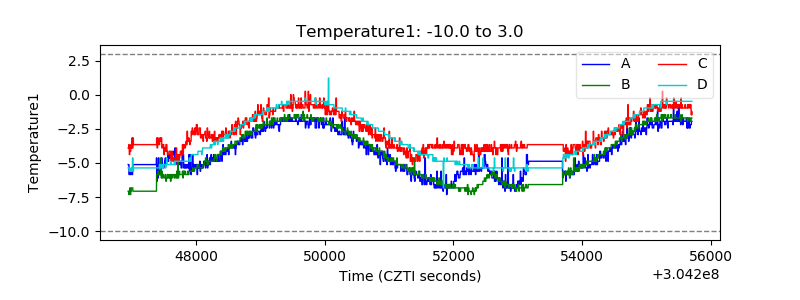 |
| Veto HV Monitor | 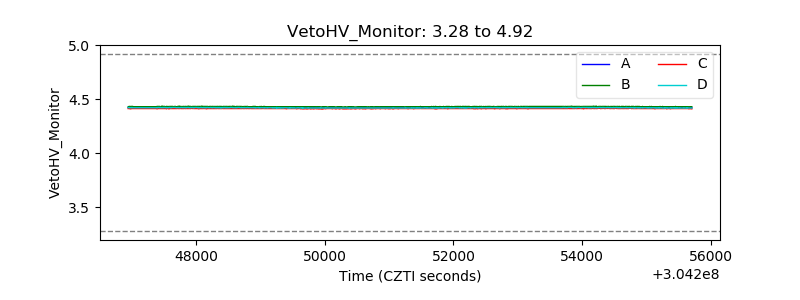 |
| Veto LLD | 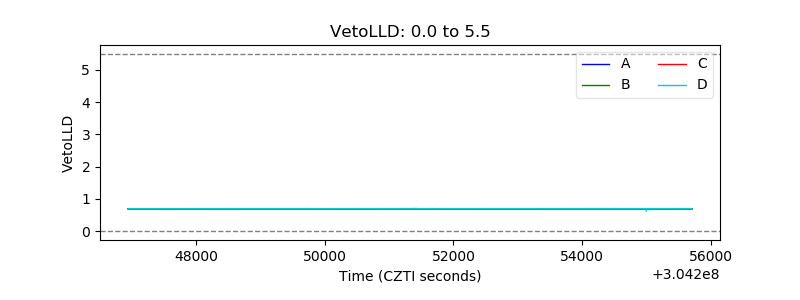 |
| Alpha Counter | 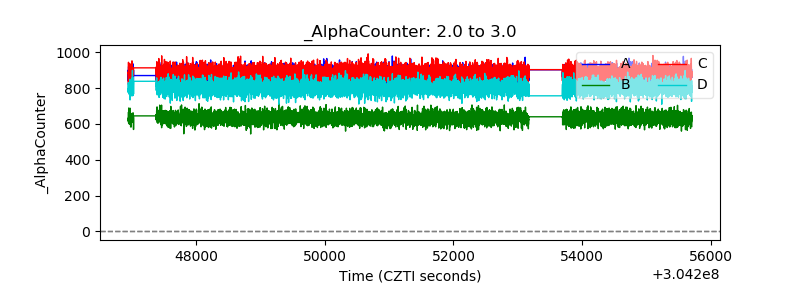 |
| _CPM_Rate | 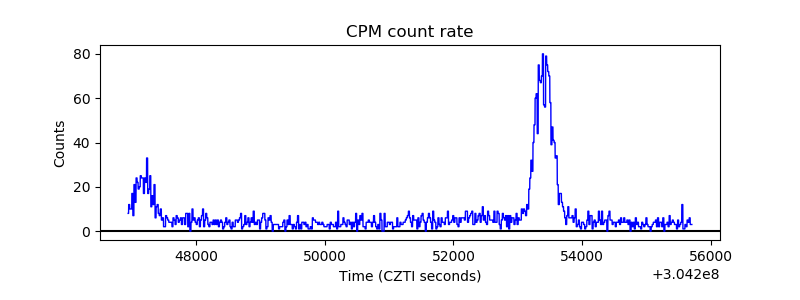 |
| CZT Counter | 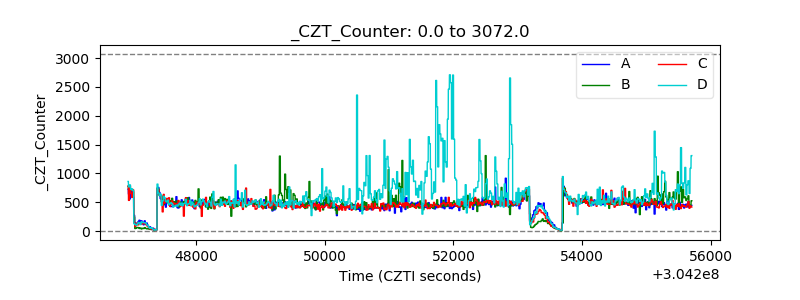 |
| +2.5 Volts monitor |  |
| +5 Volts monitor |  |
| _ROLL_ROT | 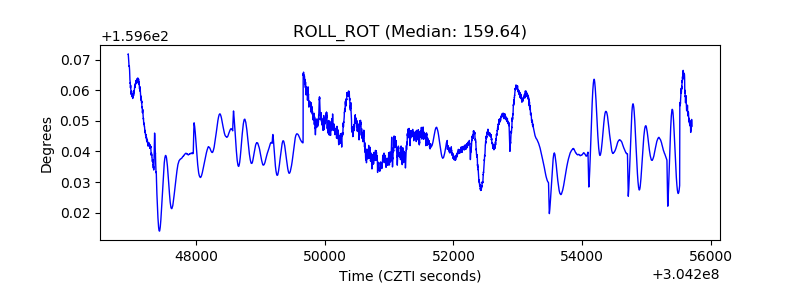 |
| _Roll_DEC | 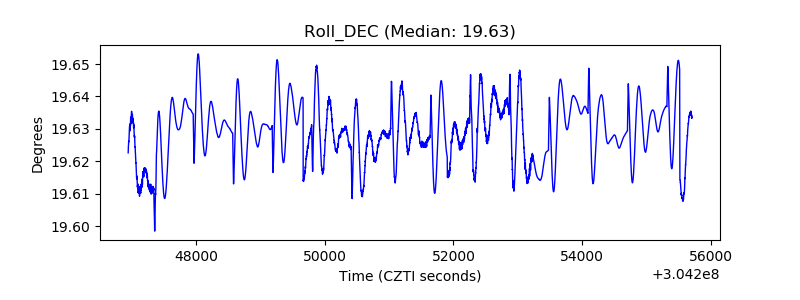 |
| _Roll_RA | 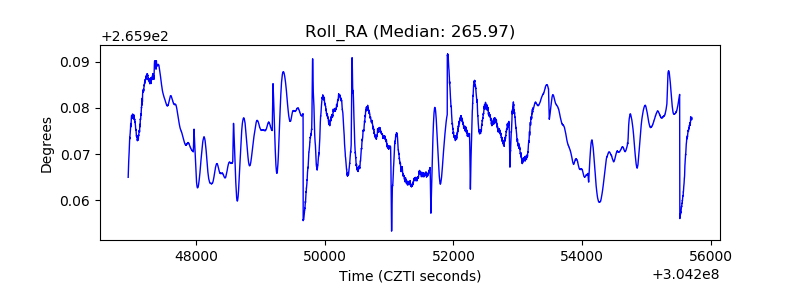 |
| Veto Counter | 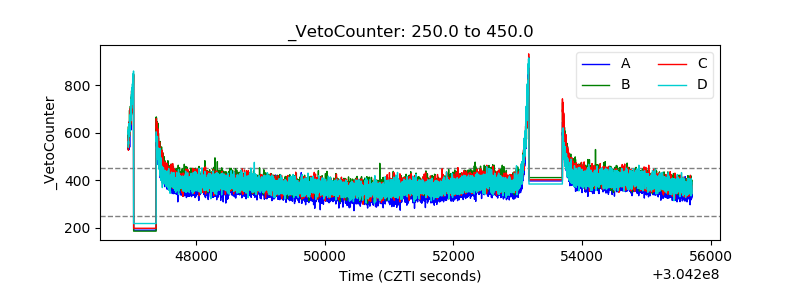 |