| Param | Original file | Final file |
|---|---|---|
| Filename | modeM0/AS1A05_163T01_9000003118_21098cztM0_level2.evt | modeM0/AS1A05_163T01_9000003118_21098cztM0_level2_quad_clean.evt |
| Size (bytes) | 903,663,360 | 143,792,640 |
| Size | 861.8 MB | 137.1 MB |
| Events in quadrant A | 5,097,350 | 962,488 |
| Events in quadrant B | 6,128,851 | 959,339 |
| Events in quadrant C | 5,163,129 | 929,013 |
| Events in quadrant D | 10,254,806 | 762,841 |
| Mode M9 | |||
|---|---|---|---|
| Quadrant | BADHDUFLAG | Total packets | Discarded packets |
| A | 0 | 14 | 0 |
| B | 0 | 14 | 0 |
| C | 0 | 14 | 0 |
| D | 0 | 14 | 0 |
| Mode M0 | |||
|---|---|---|---|
| Quadrant | BADHDUFLAG | Total packets | Discarded packets |
| A | 0 | 22250 | 2 |
| B | 0 | 25058 | 2 |
| C | 0 | 22275 | 2 |
| D | 0 | 37510 | 2 |
| Mode SS | |||
|---|---|---|---|
| Quadrant | BADHDUFLAG | Total packets | Discarded packets |
| A | 0 | 222 | 0 |
| B | 0 | 222 | 0 |
| C | 0 | 222 | 0 |
| D | 0 | 222 | 0 |
| Quadrant | Total seconds | Saturated seconds | Saturation percentage |
|---|---|---|---|
| A | 10681 | 156 | 1.460537% |
| B | 10682 | 254 | 2.377832% |
| C | 10682 | 184 | 1.722524% |
| D | 10682 | 1682 | 15.746115% |
Noise dominated data is calculated using 1-second bins in cleaned event files. If a bin has >2000 counts, and if more than 50% of those come from <1% of pixels, then it is considered to be noise-dominated and hence unusable.
| Quadrant | # 1 sec bins | Bins with >0 counts | Bins with >2000 counts | High rate bins dominated by noise | Noise dominated (total time) | Noise dominated (detector-on time) | Marked lightcurve |
|---|---|---|---|---|---|---|---|
| A | 12221 | 10683 | 17 | 17 | 0.14% | 0.16% |  |
| B | 12222 | 10683 | 75 | 75 | 0.61% | 0.70% | 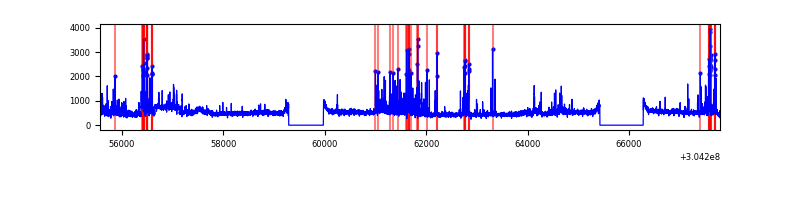 |
| C | 12222 | 10684 | 7 | 7 | 0.06% | 0.07% | 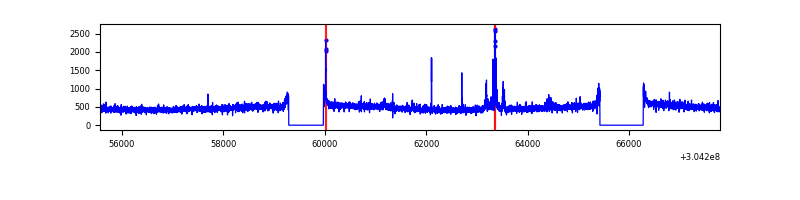 |
| D | 12222 | 10684 | 1465 | 1465 | 11.99% | 13.71% |  |
Top three noisy pixels from each quadrant. If the there are fewer than three noisy pixels in the level2.evt file, extra rows are filled as -1
| Pixel properties | Quadrant properties | ||||||
|---|---|---|---|---|---|---|---|
| Quadrant | DetID | PixID | Counts | Sigma | Mean | Median | Sigma |
| A | 5 | 16 | 93483 | 354.3 | 1291 | 1262 | 260.3 |
| A | 13 | 254 | 15261 | 53.78 | 1291 | 1262 | 260.3 |
| A | 15 | 192 | 14113 | 49.37 | 1291 | 1262 | 260.3 |
| B | 0 | 182 | 367896 | 1487.06 | 1283 | 1249 | 246.6 |
| B | 7 | 220 | 330823 | 1336.7 | 1283 | 1249 | 246.6 |
| B | 3 | 64 | 200638 | 808.69 | 1283 | 1249 | 246.6 |
| C | 14 | 238 | 193801 | 656.13 | 1240 | 1249 | 293.5 |
| C | 7 | 221 | 93844 | 315.52 | 1240 | 1249 | 293.5 |
| C | 9 | 54 | 40918 | 135.17 | 1240 | 1249 | 293.5 |
| D | 1 | 52 | 3712865 | 13506.3 | 1136 | 1106 | 274.8 |
| D | 1 | 20 | 997583 | 3625.97 | 1136 | 1106 | 274.8 |
| D | 1 | 239 | 907712 | 3298.95 | 1136 | 1106 | 274.8 |
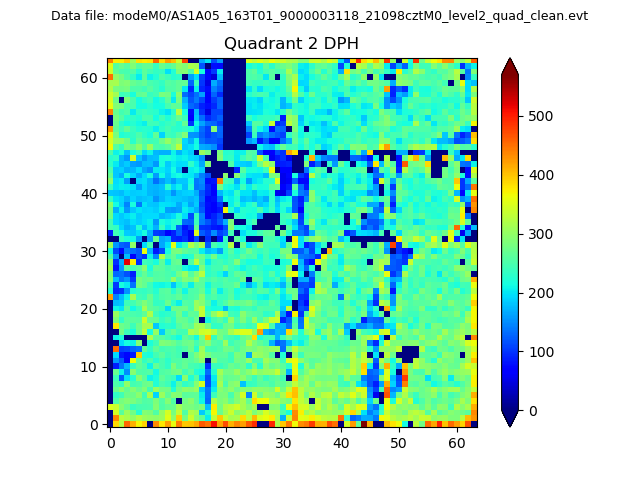
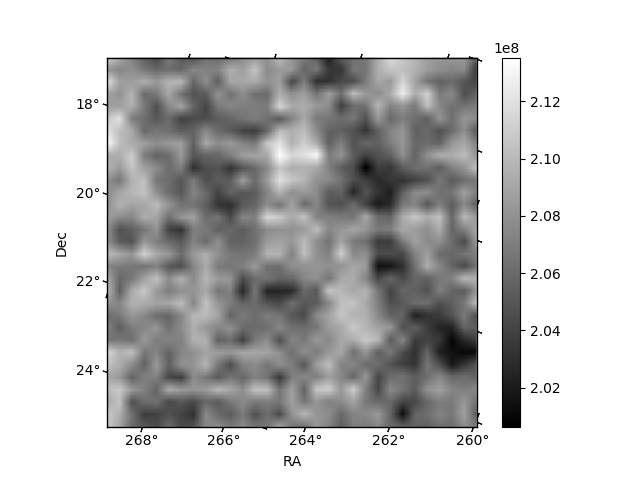
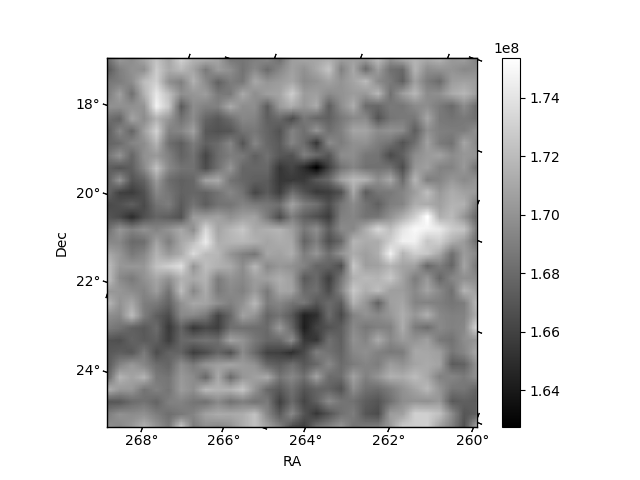
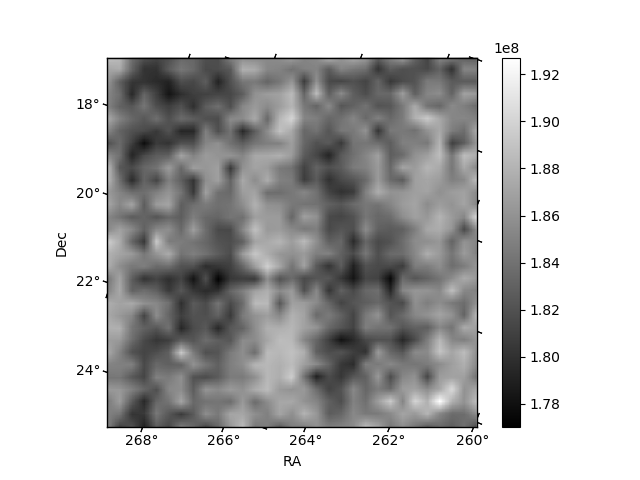
Histogram calculated using DETX and DETY for each event in the final _common_clean file
| Quadrant A | 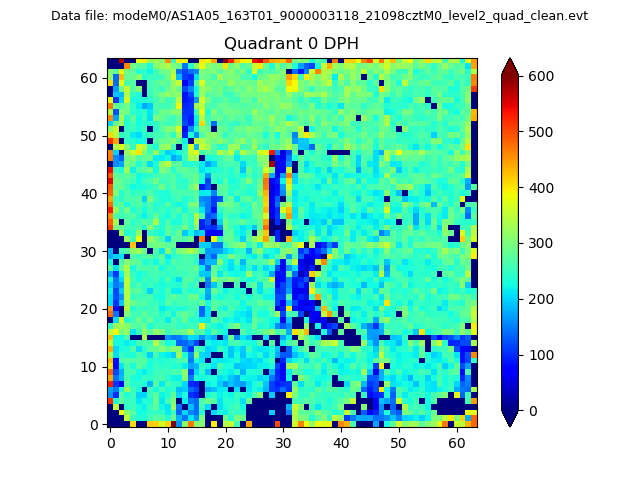 |
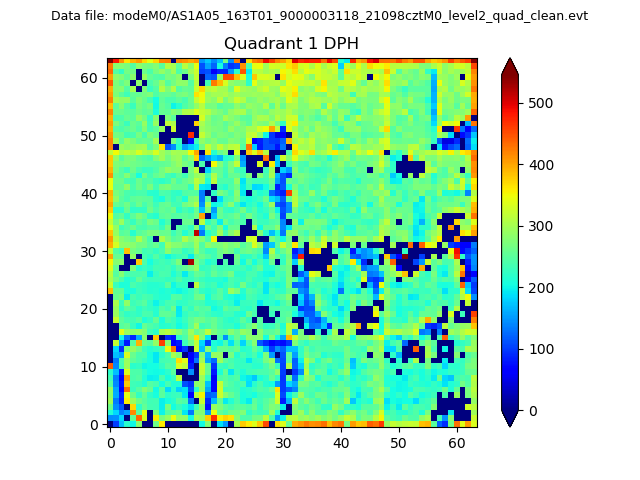 |
Quadrant B |
|---|---|---|---|
| Quadrant D | 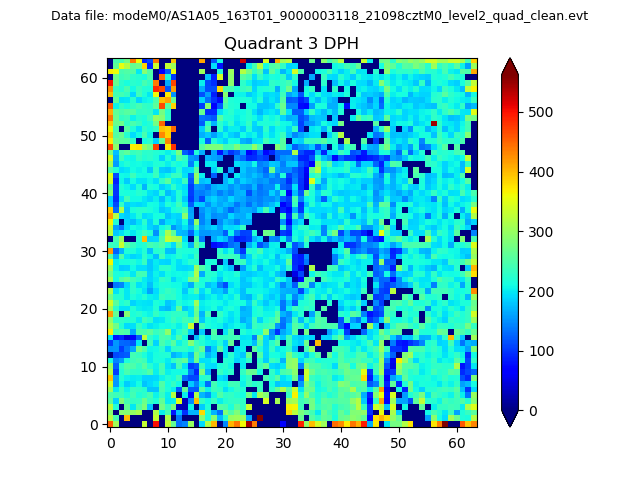 |
 |
Quadrant C |
| Plot type | Count rate plots | Images |
|---|---|---|
| Comparison with Poisson distribution Blue bars denote a histogram of data divided into 1 sec bins. Red curve is a Poisson curve with rate = median count rate of data. |
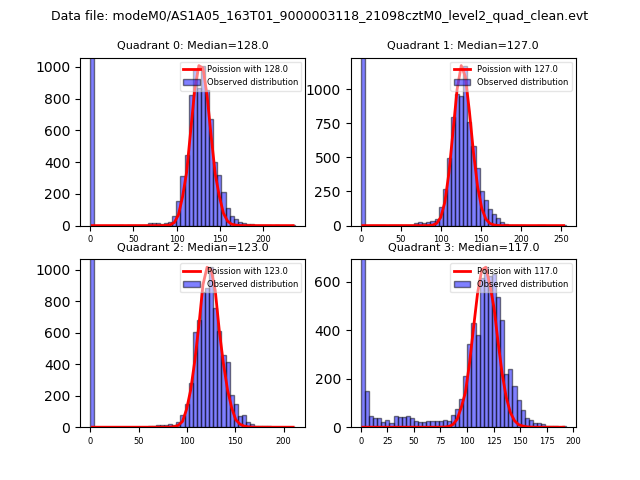 |
 |
| Quadrant-wise count rates Data is divided into 100 sec bins |
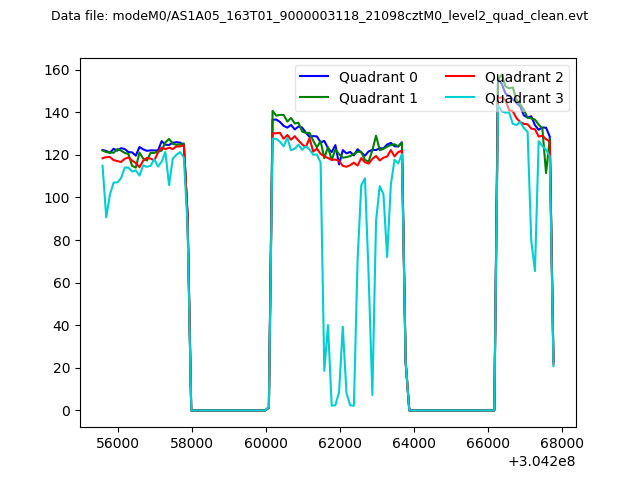 |
|
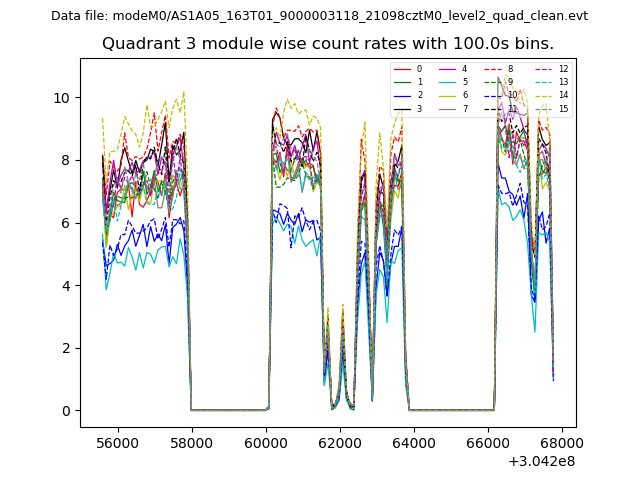
| Module-wise count rates for Quadrant A Data is divided into 100 sec bins |
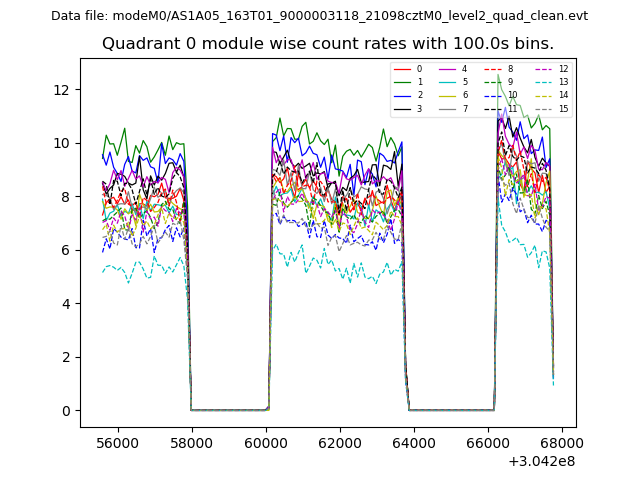 |
 |
| Module-wise count rates for Quadrant B Data is divided into 100 sec bins |
 |
 |
| Module-wise count rates for Quadrant C Data is divided into 100 sec bins |
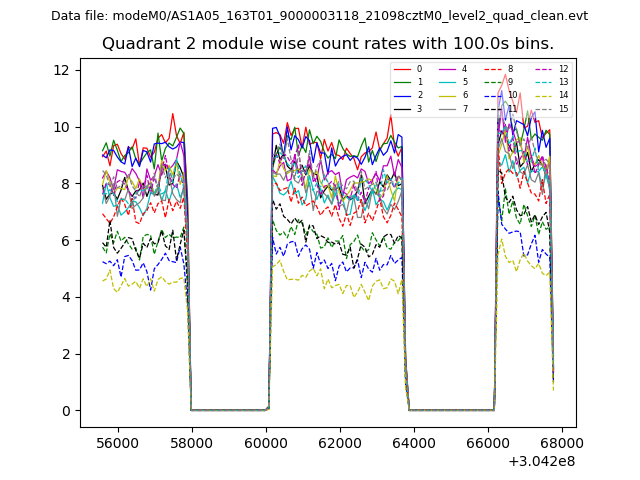 |
 |
| Module-wise count rates for Quadrant D Data is divided into 100 sec bins |
 |
 |
| Parameter | Plot |
|---|---|
| CZT HV Monitor | 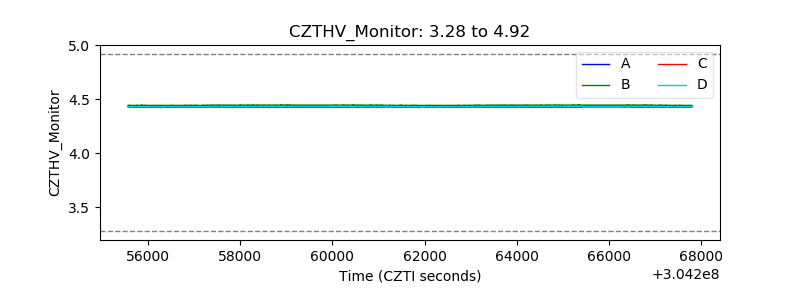 |
| D_VDD |  |
| Temperature 1 | 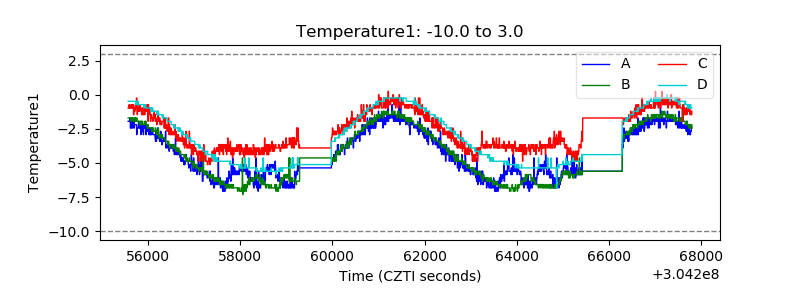 |
| Veto HV Monitor | 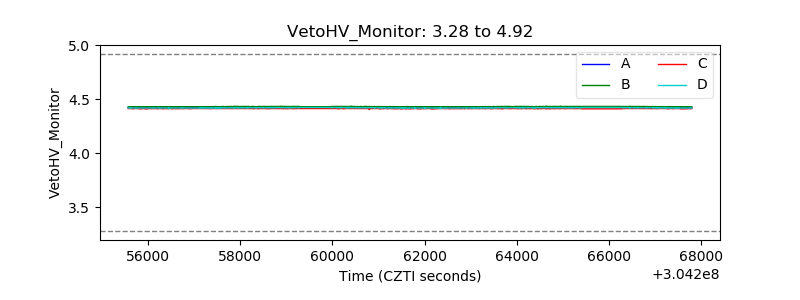 |
| Veto LLD | 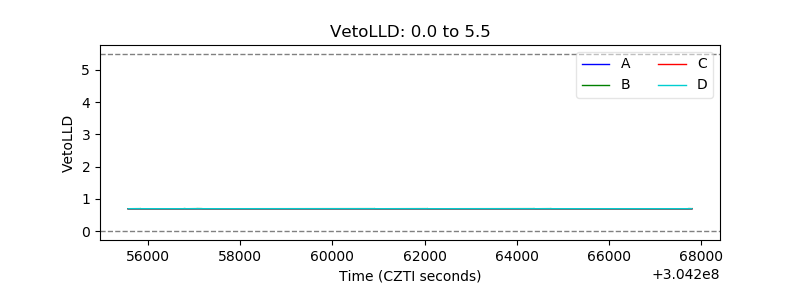 |
| Alpha Counter | 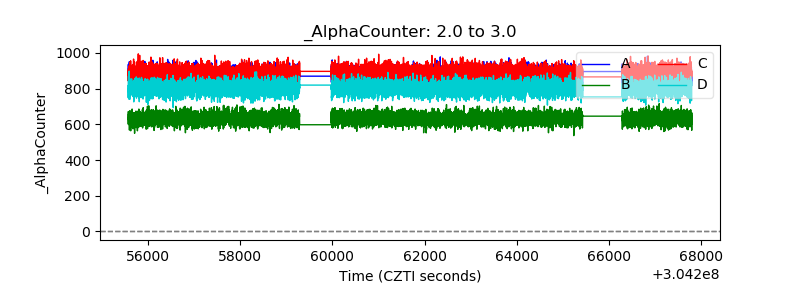 |
| _CPM_Rate | 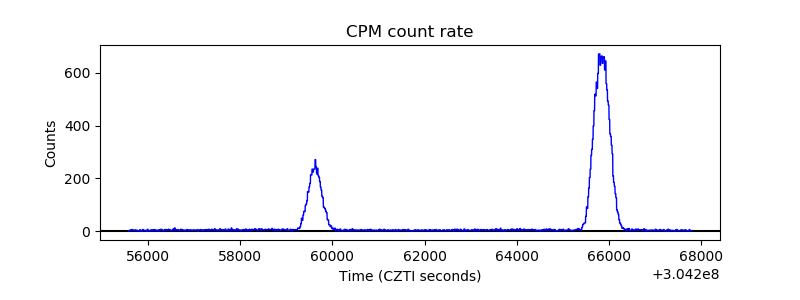 |
| CZT Counter | 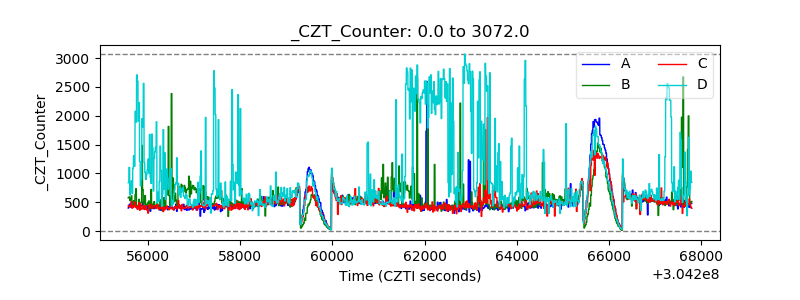 |
| +2.5 Volts monitor |  |
| +5 Volts monitor |  |
| _ROLL_ROT | 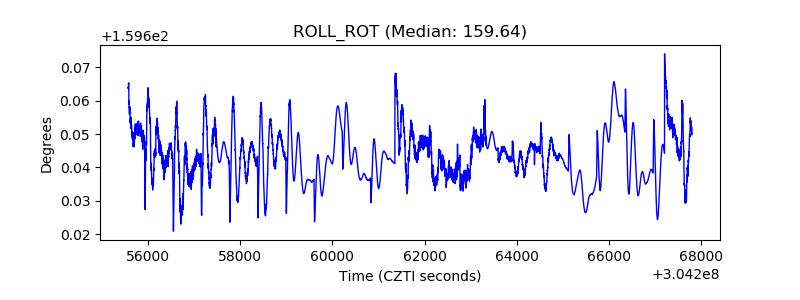 |
| _Roll_DEC | 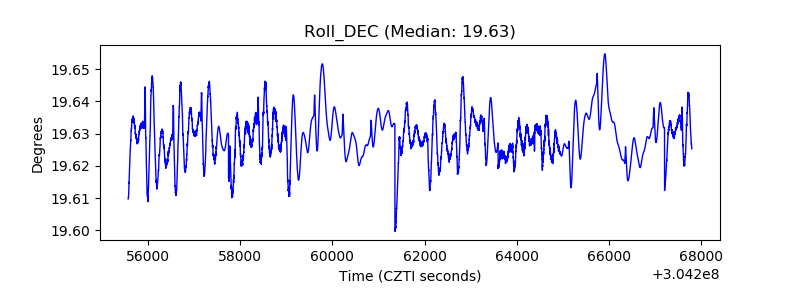 |
| _Roll_RA |  |
| Veto Counter | 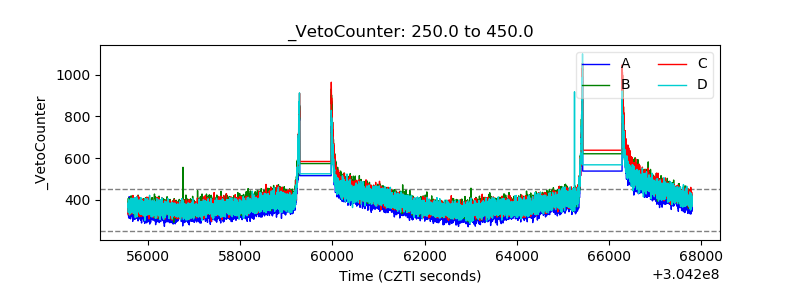 |