| Param | Original file | Final file |
|---|---|---|
| Filename | modeM0/AS1A05_163T01_9000003118_21099cztM0_level2.evt | modeM0/AS1A05_163T01_9000003118_21099cztM0_level2_quad_clean.evt |
| Size (bytes) | 516,113,280 | 95,754,240 |
| Size | 492.2 MB | 91.3 MB |
| Events in quadrant A | 3,176,990 | 631,132 |
| Events in quadrant B | 3,558,146 | 630,208 |
| Events in quadrant C | 3,325,265 | 607,465 |
| Events in quadrant D | 5,129,184 | 577,382 |
| Mode M9 | |||
|---|---|---|---|
| Quadrant | BADHDUFLAG | Total packets | Discarded packets |
| A | 0 | 11 | 0 |
| B | 0 | 11 | 0 |
| C | 0 | 11 | 0 |
| D | 0 | 11 | 0 |
| Mode M0 | |||
|---|---|---|---|
| Quadrant | BADHDUFLAG | Total packets | Discarded packets |
| A | 0 | 13708 | 1 |
| B | 0 | 14785 | 1 |
| C | 0 | 14086 | 1 |
| D | 0 | 19617 | 1 |
| Mode SS | |||
|---|---|---|---|
| Quadrant | BADHDUFLAG | Total packets | Discarded packets |
| A | 0 | 130 | 0 |
| B | 0 | 130 | 0 |
| C | 0 | 130 | 0 |
| D | 0 | 130 | 0 |
| Quadrant | Total seconds | Saturated seconds | Saturation percentage |
|---|---|---|---|
| A | 6510 | 45 | 0.691244% |
| B | 6511 | 107 | 1.643373% |
| C | 6511 | 75 | 1.151897% |
| D | 6511 | 273 | 4.192904% |
Noise dominated data is calculated using 1-second bins in cleaned event files. If a bin has >2000 counts, and if more than 50% of those come from <1% of pixels, then it is considered to be noise-dominated and hence unusable.
| Quadrant | # 1 sec bins | Bins with >0 counts | Bins with >2000 counts | High rate bins dominated by noise | Noise dominated (total time) | Noise dominated (detector-on time) | Marked lightcurve |
|---|---|---|---|---|---|---|---|
| A | 7555 | 6511 | 1 | 1 | 0.01% | 0.02% | 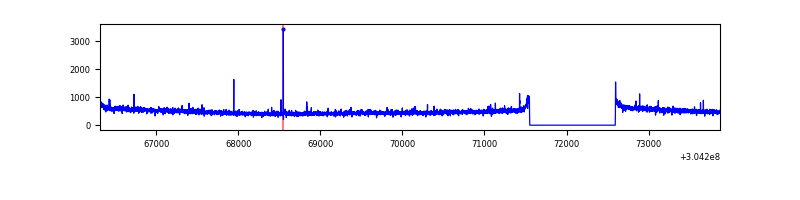 |
| B | 7556 | 6512 | 41 | 41 | 0.54% | 0.63% | 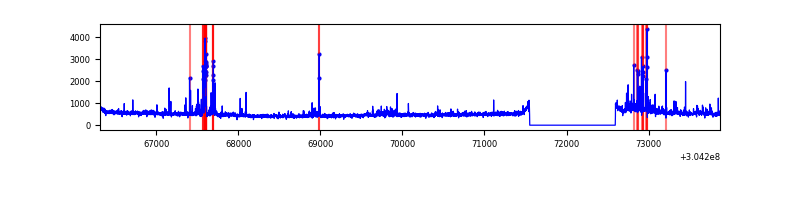 |
| C | 7556 | 6512 | 6 | 6 | 0.08% | 0.09% | 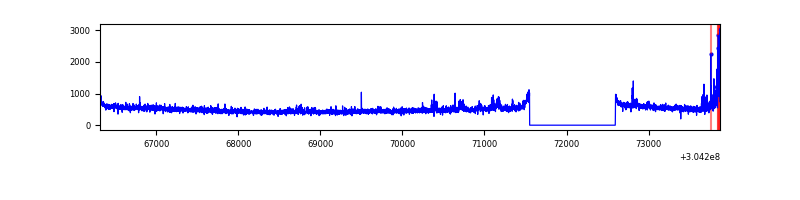 |
| D | 7556 | 6512 | 203 | 203 | 2.69% | 3.12% | 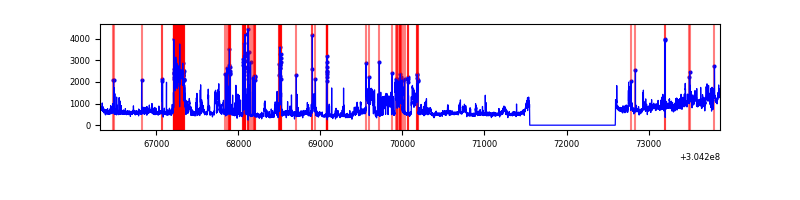 |
Top three noisy pixels from each quadrant. If the there are fewer than three noisy pixels in the level2.evt file, extra rows are filled as -1
| Pixel properties | Quadrant properties | ||||||
|---|---|---|---|---|---|---|---|
| Quadrant | DetID | PixID | Counts | Sigma | Mean | Median | Sigma |
| A | 15 | 192 | 18540 | 108.95 | 814 | 798 | 162.9 |
| A | 5 | 16 | 12560 | 72.23 | 814 | 798 | 162.9 |
| A | 13 | 254 | 9272 | 52.04 | 814 | 798 | 162.9 |
| B | 7 | 220 | 105487 | 679.87 | 805 | 783 | 154.0 |
| B | 3 | 64 | 102086 | 657.79 | 805 | 783 | 154.0 |
| B | 0 | 228 | 64917 | 416.44 | 805 | 783 | 154.0 |
| C | 7 | 221 | 142743 | 773.53 | 779 | 785 | 183.5 |
| C | 14 | 238 | 121062 | 655.39 | 779 | 785 | 183.5 |
| C | 9 | 54 | 18170 | 94.73 | 779 | 785 | 183.5 |
| D | 1 | 20 | 957997 | 5126.63 | 777 | 756 | 186.7 |
| D | 1 | 52 | 681530 | 3645.97 | 777 | 756 | 186.7 |
| D | 1 | 239 | 428345 | 2290.01 | 777 | 756 | 186.7 |
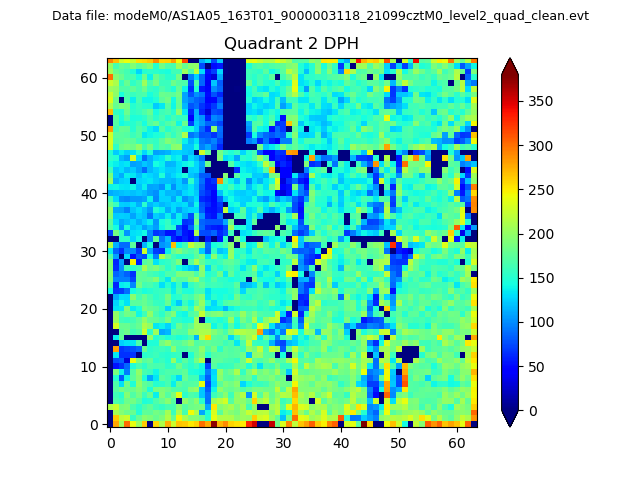
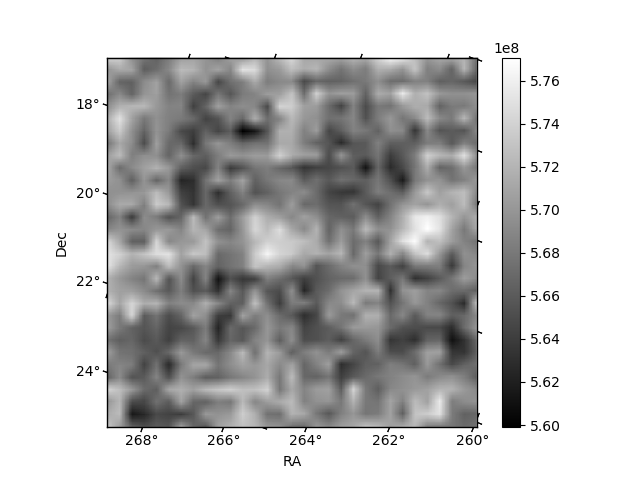
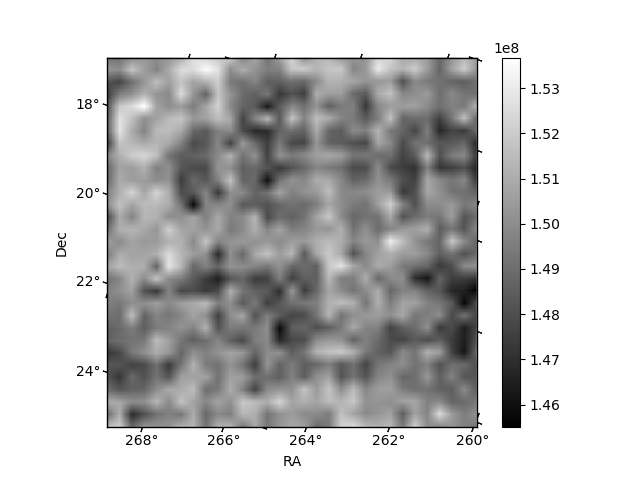
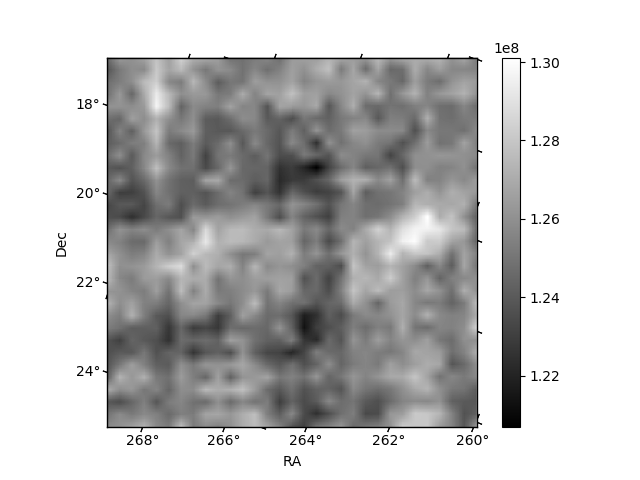
Histogram calculated using DETX and DETY for each event in the final _common_clean file
| Quadrant A | 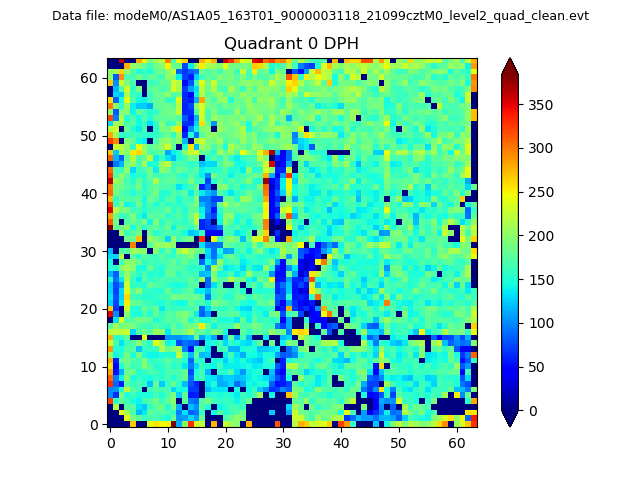 |
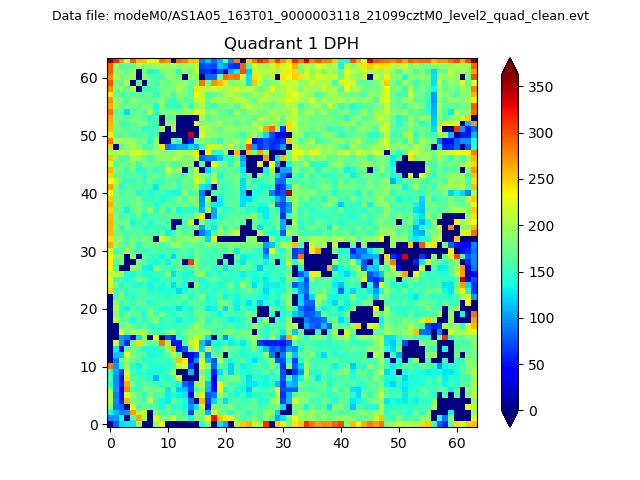 |
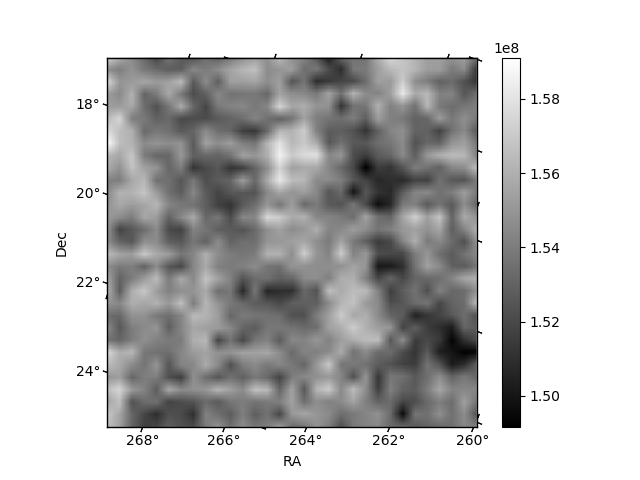
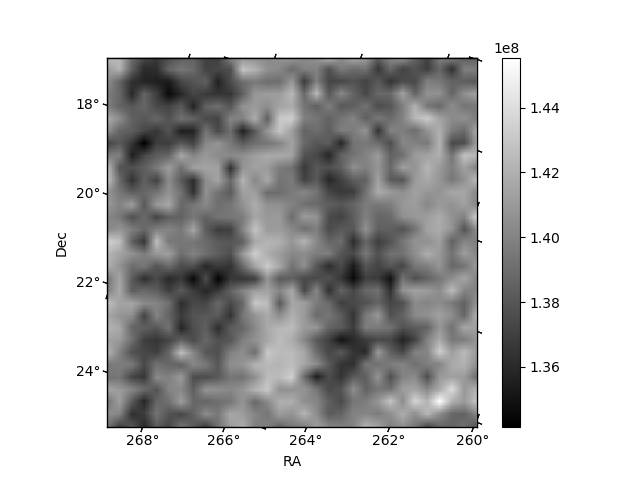
Quadrant B |
|---|---|---|---|
| Quadrant D | 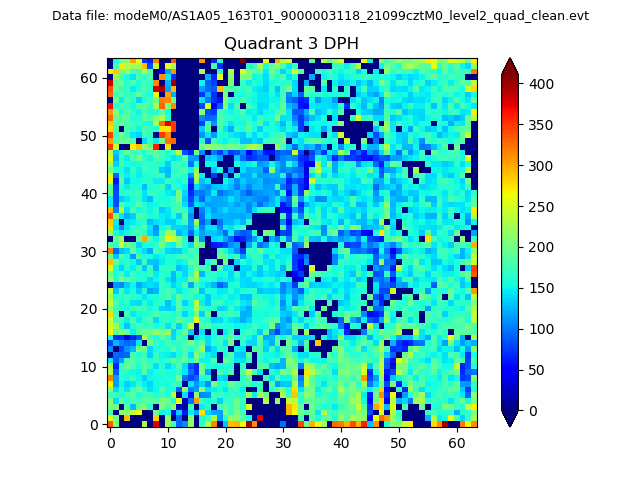 |
 |
Quadrant C |
| Plot type | Count rate plots | Images |
|---|---|---|
| Comparison with Poisson distribution Blue bars denote a histogram of data divided into 1 sec bins. Red curve is a Poisson curve with rate = median count rate of data. |
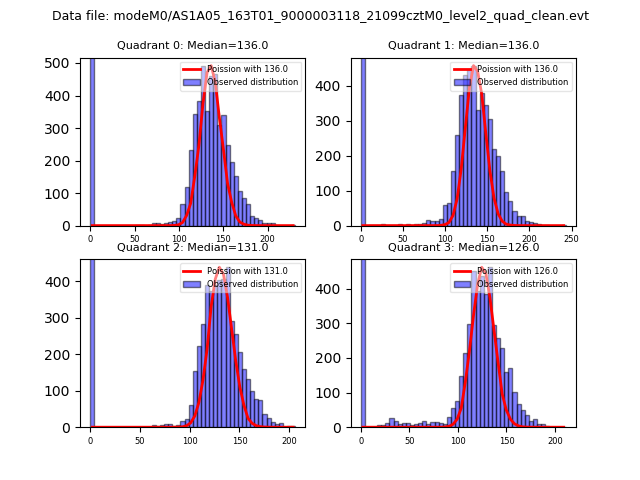 |
 |
| Quadrant-wise count rates Data is divided into 100 sec bins |
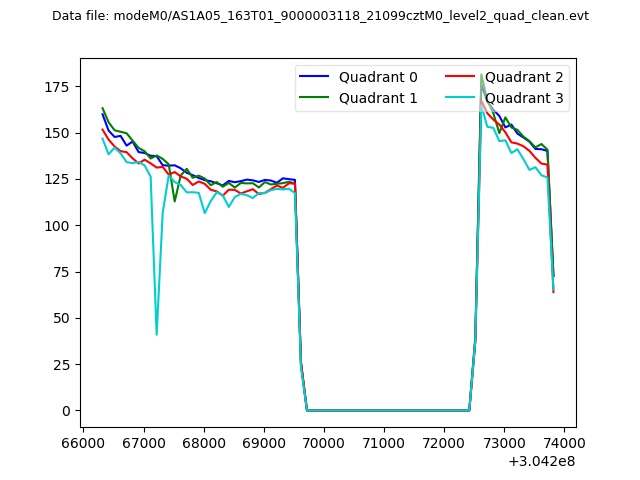 |
|
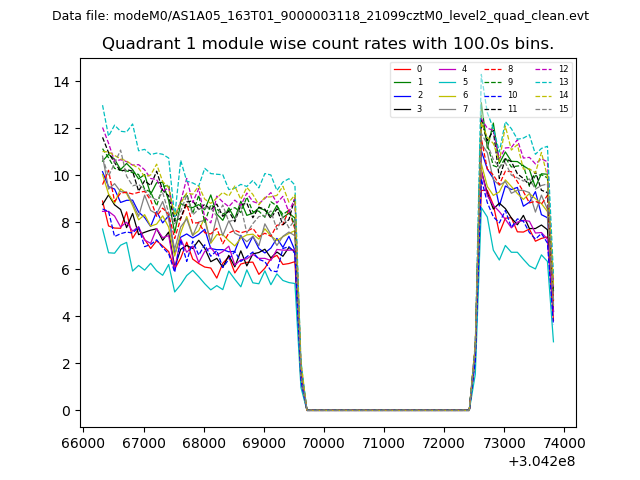
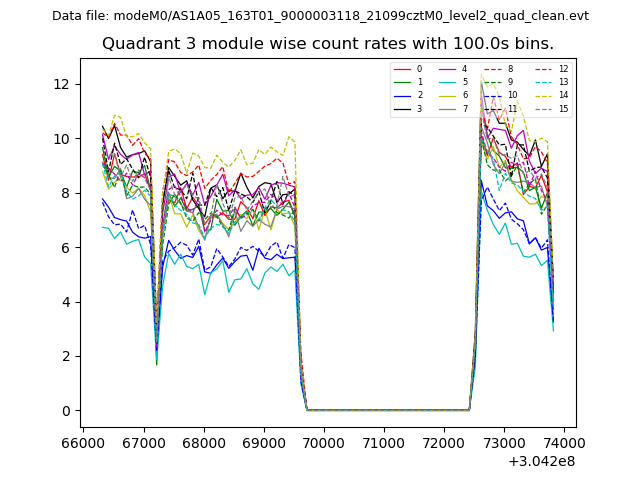
| Module-wise count rates for Quadrant A Data is divided into 100 sec bins |
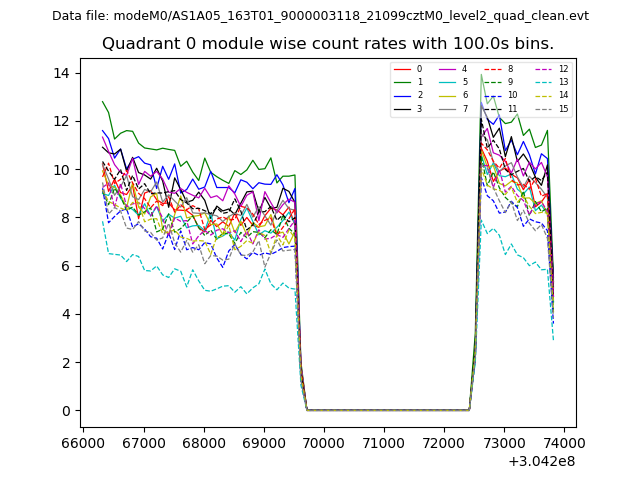 |
 |
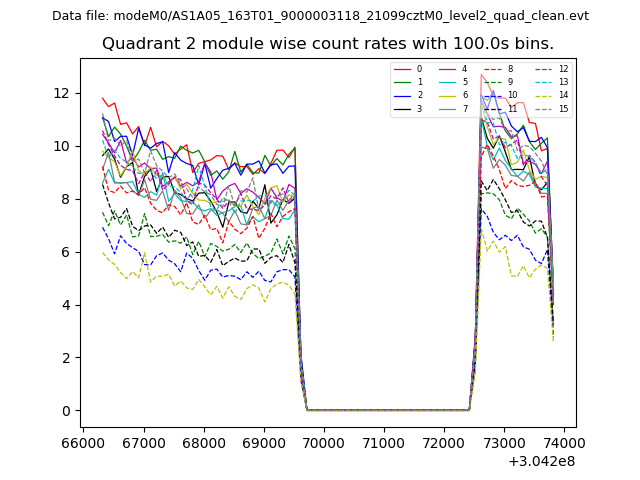
| Module-wise count rates for Quadrant B Data is divided into 100 sec bins |
 |
 |
| Module-wise count rates for Quadrant C Data is divided into 100 sec bins |
 |
 |
| Module-wise count rates for Quadrant D Data is divided into 100 sec bins |
 |
 |
| Parameter | Plot |
|---|---|
| CZT HV Monitor | 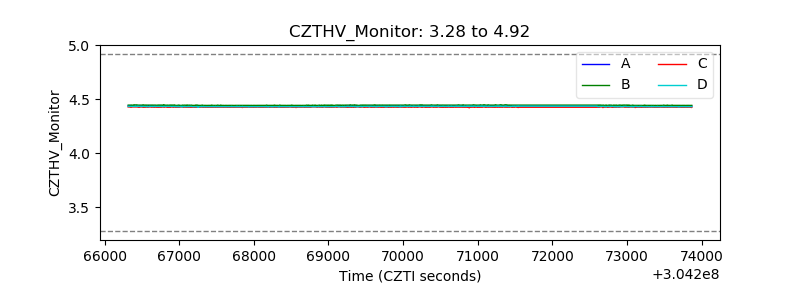 |
| D_VDD | 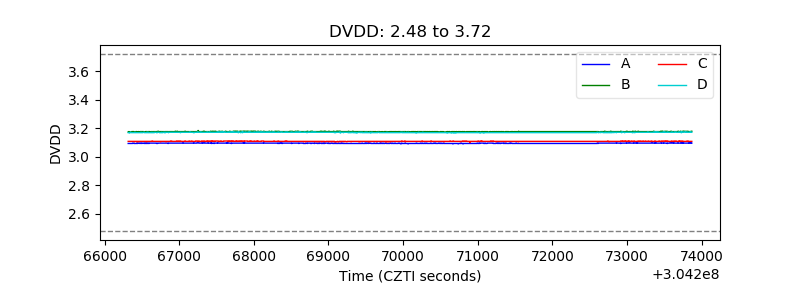 |
| Temperature 1 | 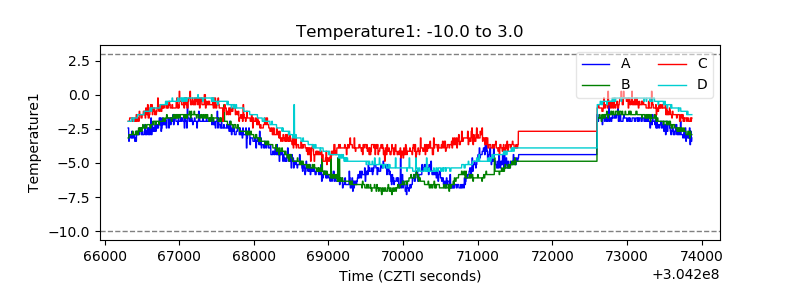 |
| Veto HV Monitor | 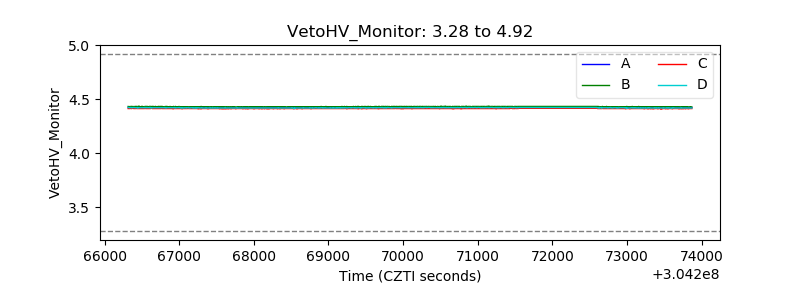 |
| Veto LLD | 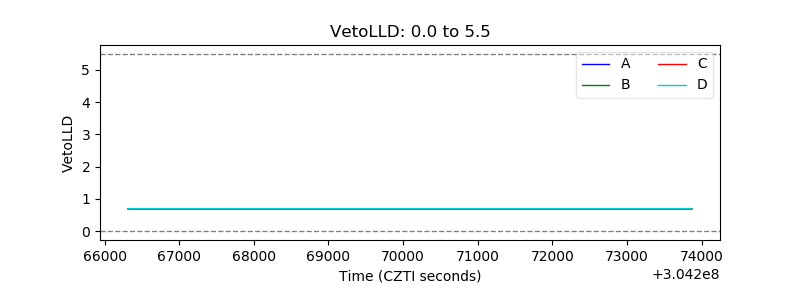 |
| Alpha Counter | 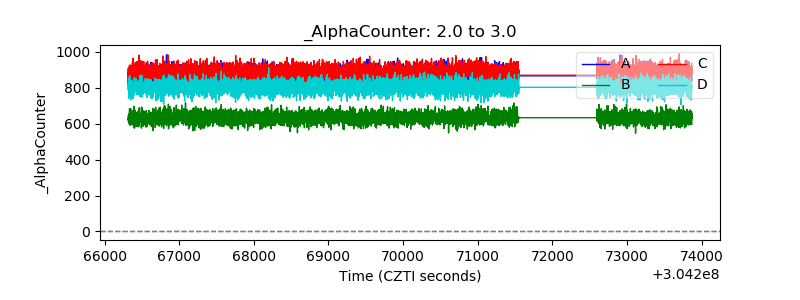 |
| _CPM_Rate | 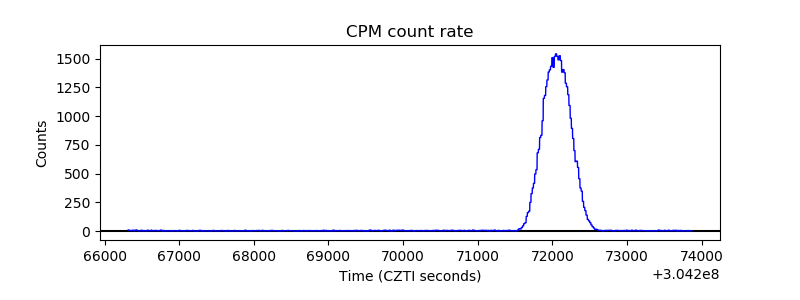 |
| CZT Counter | 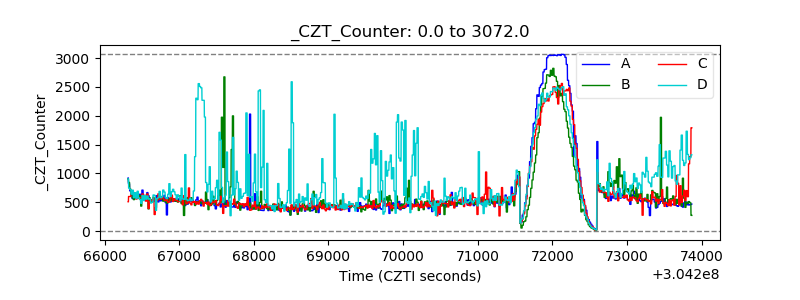 |
| +2.5 Volts monitor | 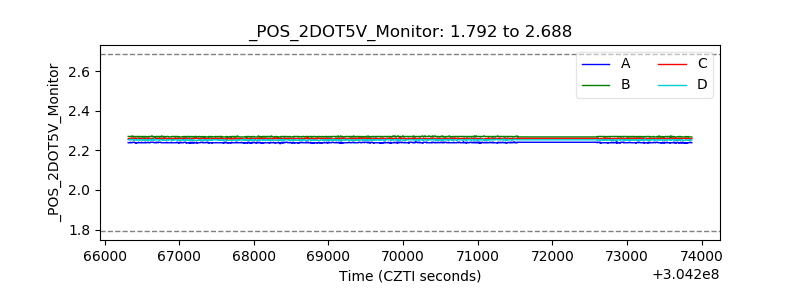 |
| +5 Volts monitor |  |
| _ROLL_ROT | 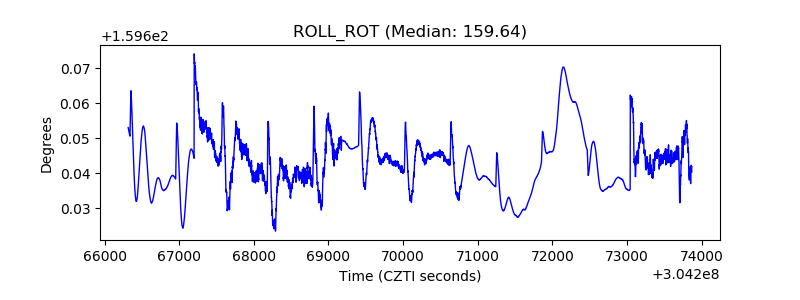 |
| _Roll_DEC | 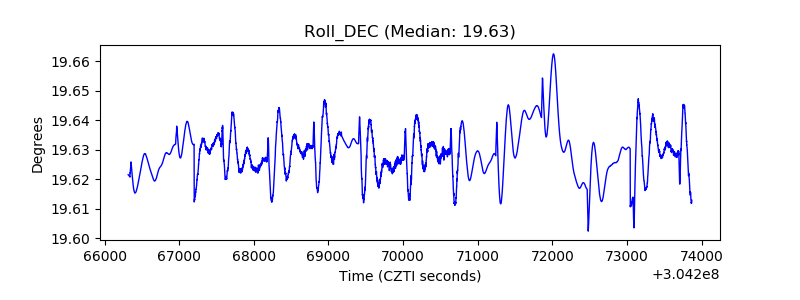 |
| _Roll_RA | 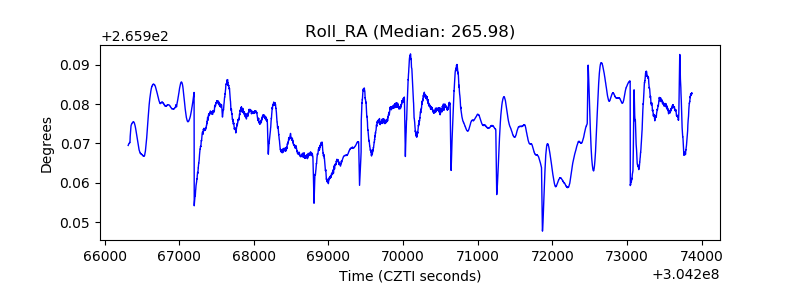 |
| Veto Counter | 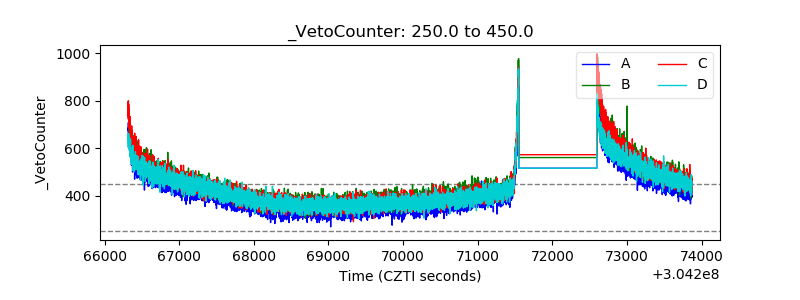 |