| Param | Original file | Final file |
|---|---|---|
| Filename | modeM0/AS1A05_163T01_9000003118_21101cztM0_level2.evt | modeM0/AS1A05_163T01_9000003118_21101cztM0_level2_quad_clean.evt |
| Size (bytes) | 556,251,840 | 90,518,400 |
| Size | 530.5 MB | 86.3 MB |
| Events in quadrant A | 3,081,583 | 596,704 |
| Events in quadrant B | 3,409,259 | 599,461 |
| Events in quadrant C | 3,697,137 | 566,523 |
| Events in quadrant D | 6,234,345 | 541,460 |
| Mode M9 | |||
|---|---|---|---|
| Quadrant | BADHDUFLAG | Total packets | Discarded packets |
| A | 0 | 11 | 0 |
| B | 0 | 11 | 0 |
| C | 0 | 11 | 0 |
| D | 0 | 11 | 0 |
| Mode M0 | |||
|---|---|---|---|
| Quadrant | BADHDUFLAG | Total packets | Discarded packets |
| A | 0 | 13321 | 2 |
| B | 0 | 14179 | 2 |
| C | 0 | 15066 | 2 |
| D | 0 | 22848 | 2 |
| Mode SS | |||
|---|---|---|---|
| Quadrant | BADHDUFLAG | Total packets | Discarded packets |
| A | 0 | 128 | 0 |
| B | 0 | 128 | 0 |
| C | 0 | 128 | 0 |
| D | 0 | 128 | 0 |
| Quadrant | Total seconds | Saturated seconds | Saturation percentage |
|---|---|---|---|
| A | 6258 | 43 | 0.687120% |
| B | 6259 | 76 | 1.214251% |
| C | 6259 | 191 | 3.051606% |
| D | 6259 | 192 | 3.067583% |
Noise dominated data is calculated using 1-second bins in cleaned event files. If a bin has >2000 counts, and if more than 50% of those come from <1% of pixels, then it is considered to be noise-dominated and hence unusable.
| Quadrant | # 1 sec bins | Bins with >0 counts | Bins with >2000 counts | High rate bins dominated by noise | Noise dominated (total time) | Noise dominated (detector-on time) | Marked lightcurve |
|---|---|---|---|---|---|---|---|
| A | 7453 | 6259 | 0 | 0 | 0.00% | 0.00% | 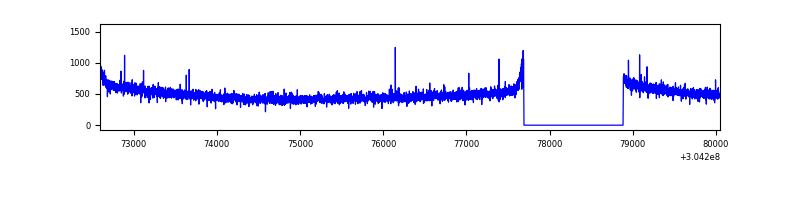 |
| B | 7454 | 6260 | 17 | 17 | 0.23% | 0.27% | 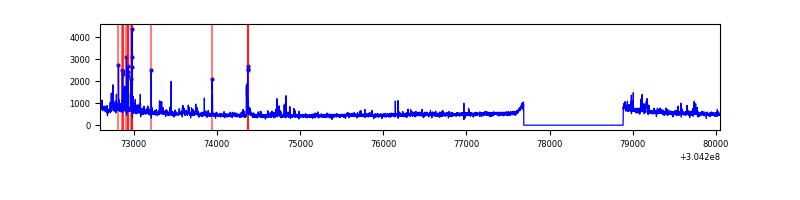 |
| C | 7454 | 6260 | 64 | 64 | 0.86% | 1.02% | 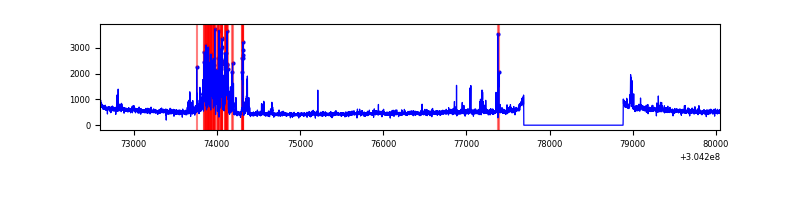 |
| D | 7454 | 6260 | 205 | 205 | 2.75% | 3.27% | 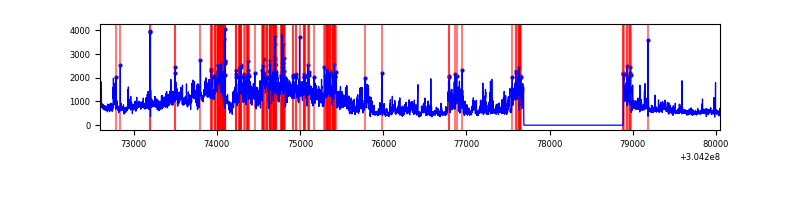 |
Top three noisy pixels from each quadrant. If the there are fewer than three noisy pixels in the level2.evt file, extra rows are filled as -1
| Pixel properties | Quadrant properties | ||||||
|---|---|---|---|---|---|---|---|
| Quadrant | DetID | PixID | Counts | Sigma | Mean | Median | Sigma |
| A | 13 | 254 | 10448 | 60.8 | 795 | 781 | 159.0 |
| A | 0 | 226 | 6900 | 38.48 | 795 | 781 | 159.0 |
| A | 15 | 192 | 6785 | 37.76 | 795 | 781 | 159.0 |
| B | 7 | 220 | 103581 | 682.43 | 793 | 774 | 150.6 |
| B | 3 | 64 | 58654 | 384.2 | 793 | 774 | 150.6 |
| B | 0 | 190 | 56123 | 367.4 | 793 | 774 | 150.6 |
| C | 7 | 221 | 589270 | 3319.23 | 761 | 769 | 177.3 |
| C | 14 | 238 | 120463 | 675.09 | 761 | 769 | 177.3 |
| C | 9 | 54 | 18719 | 101.24 | 761 | 769 | 177.3 |
| D | 1 | 20 | 2179242 | 11639.68 | 767 | 747 | 187.2 |
| D | 1 | 52 | 918446 | 4903.26 | 767 | 747 | 187.2 |
| D | 9 | 1 | 89006 | 471.57 | 767 | 747 | 187.2 |
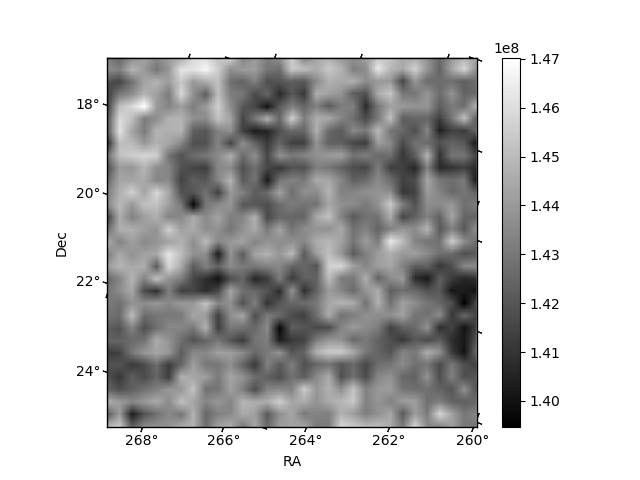
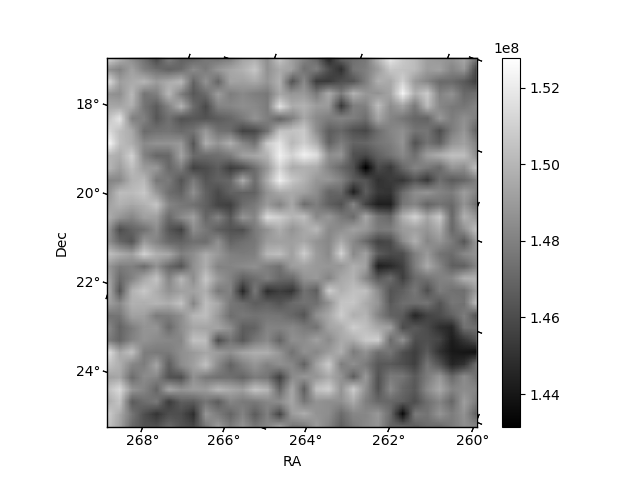
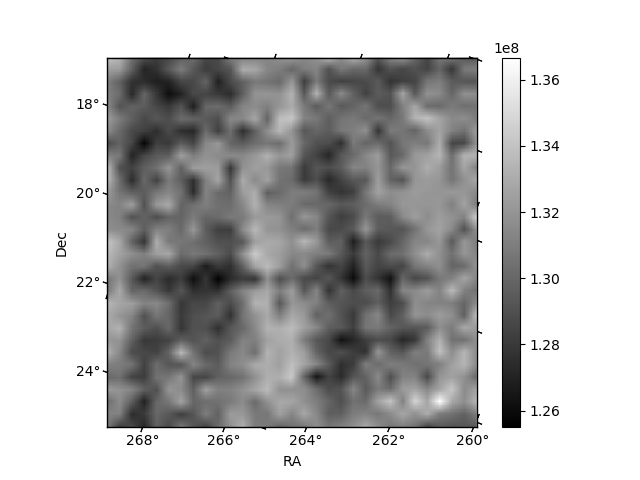
Histogram calculated using DETX and DETY for each event in the final _common_clean file
| Quadrant A | 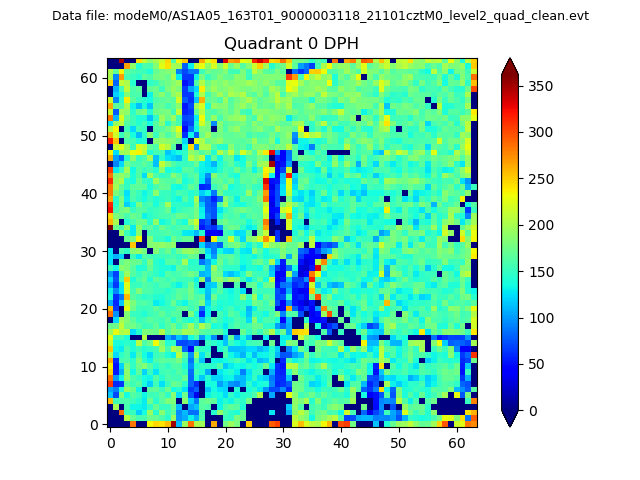 |
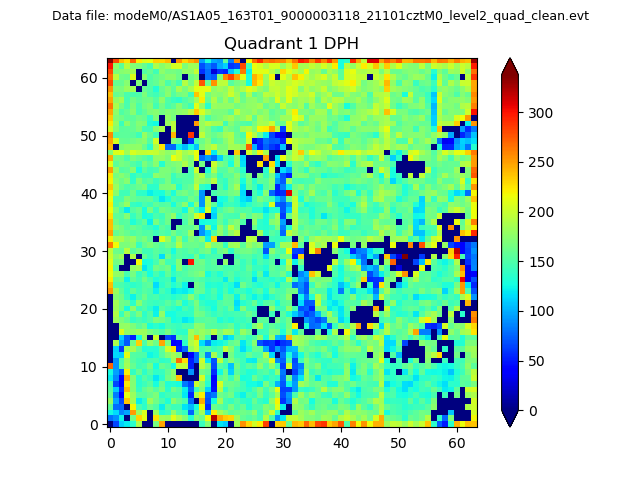 |
Quadrant B |
|---|---|---|---|
| Quadrant D | 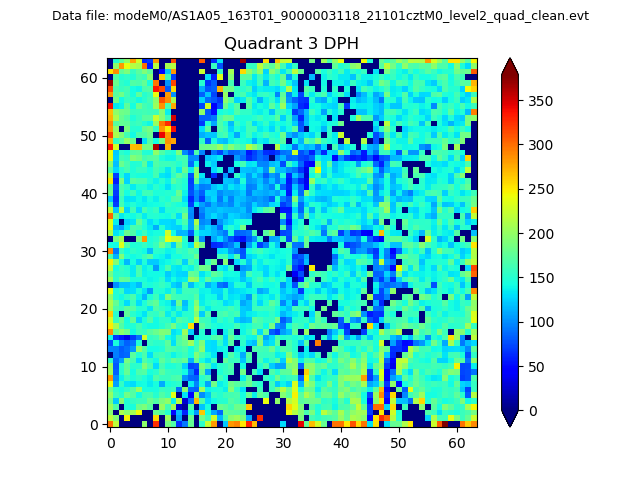 |
 |
Quadrant C |
| Plot type | Count rate plots | Images |
|---|---|---|
| Comparison with Poisson distribution Blue bars denote a histogram of data divided into 1 sec bins. Red curve is a Poisson curve with rate = median count rate of data. |
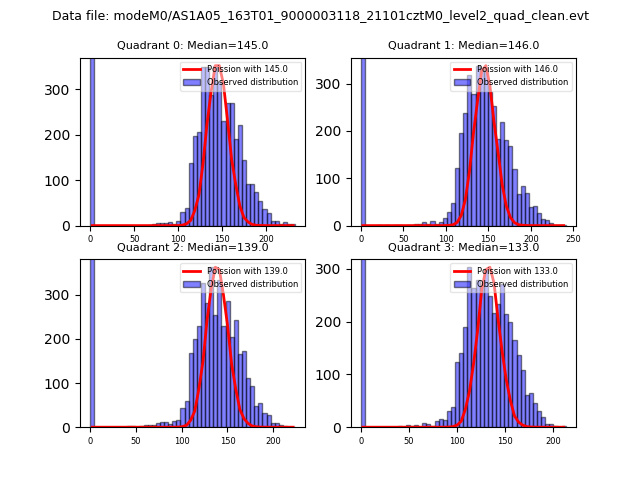 |
 |
| Quadrant-wise count rates Data is divided into 100 sec bins |
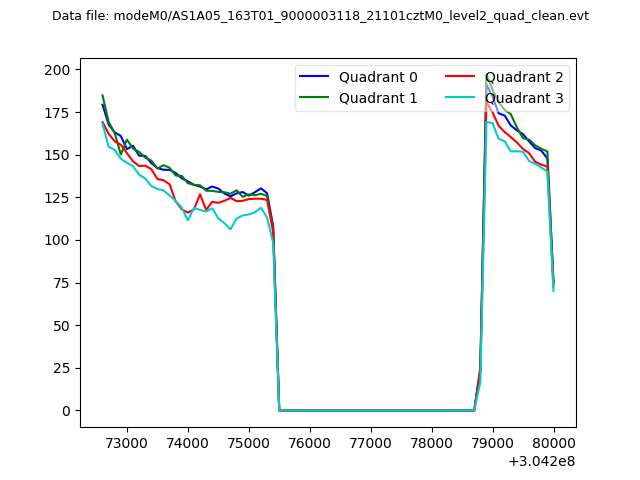 |
|
| Module-wise count rates for Quadrant A Data is divided into 100 sec bins |
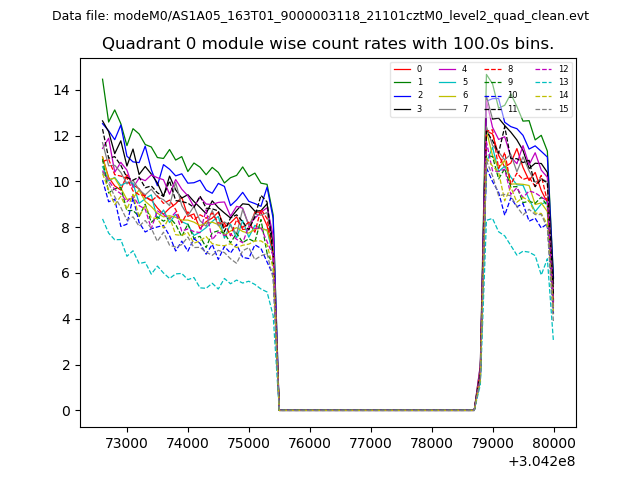 |
 |
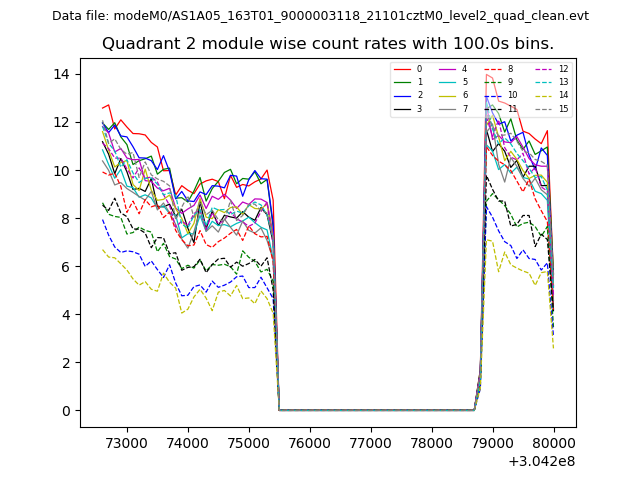
| Module-wise count rates for Quadrant B Data is divided into 100 sec bins |
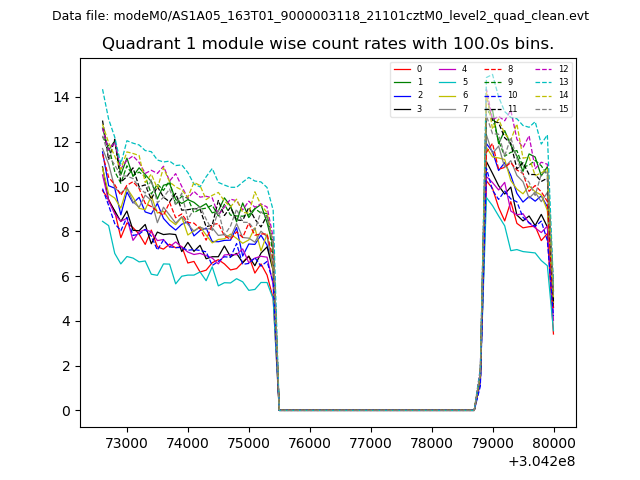 |
 |
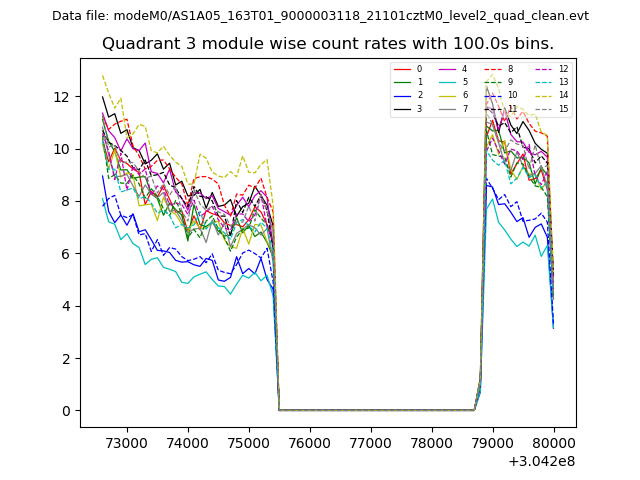
| Module-wise count rates for Quadrant C Data is divided into 100 sec bins |
 |
 |
| Module-wise count rates for Quadrant D Data is divided into 100 sec bins |
 |
 |
| Parameter | Plot |
|---|---|
| CZT HV Monitor | 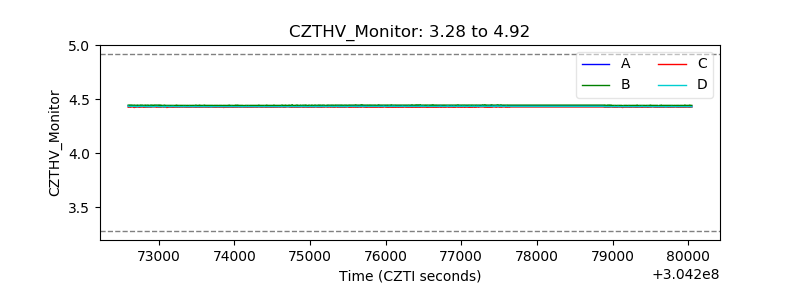 |
| D_VDD |  |
| Temperature 1 | 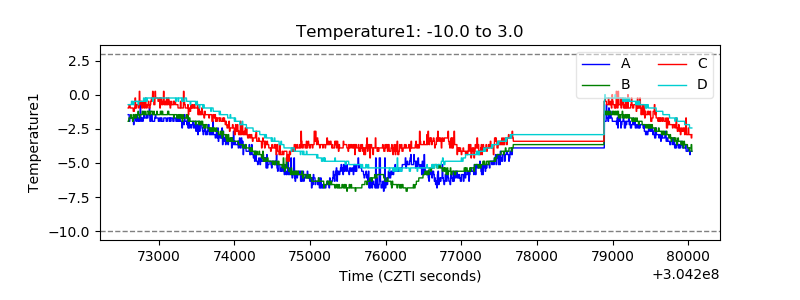 |
| Veto HV Monitor | 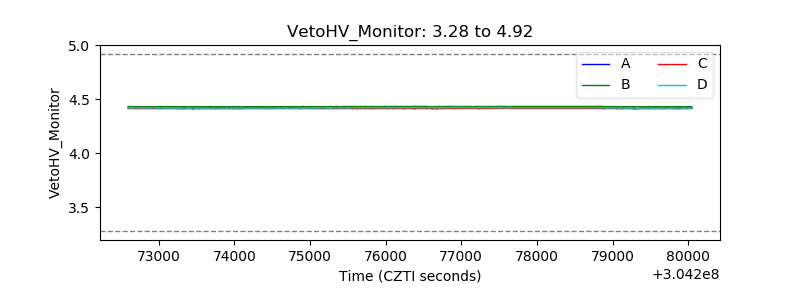 |
| Veto LLD | 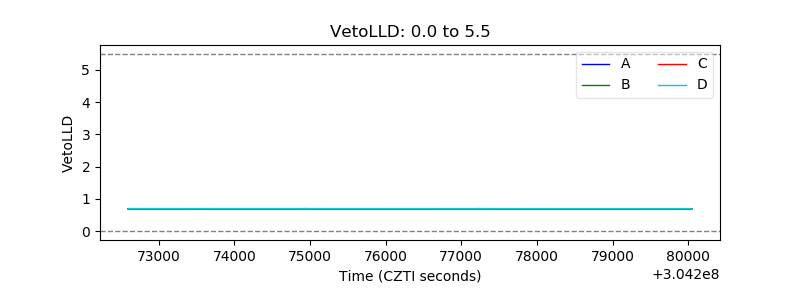 |
| Alpha Counter | 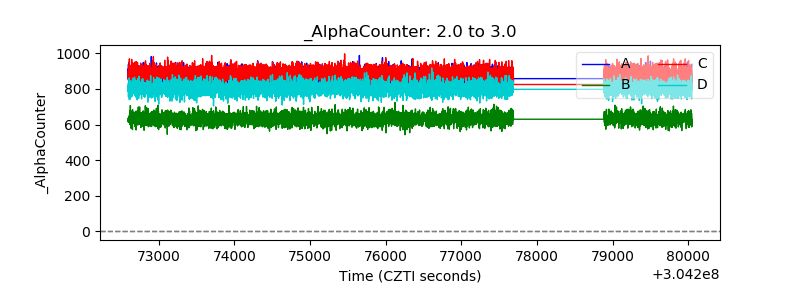 |
| _CPM_Rate | 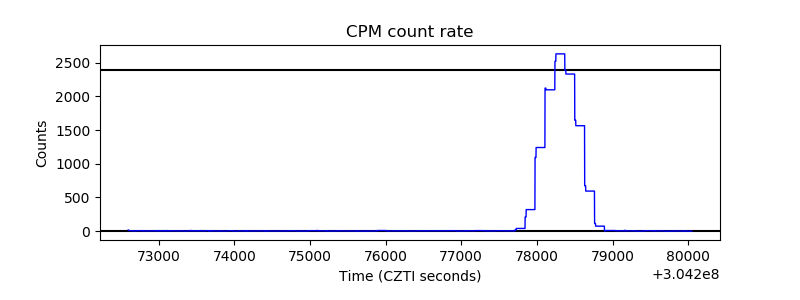 |
| CZT Counter | 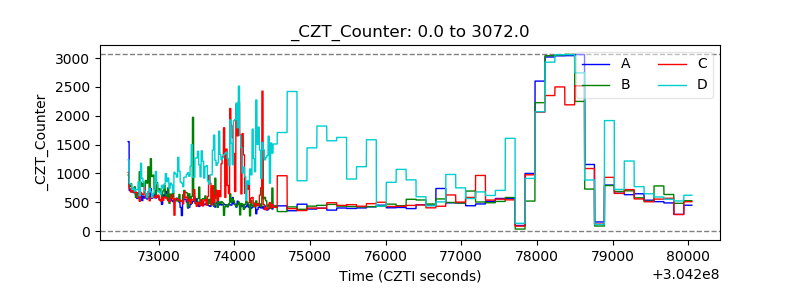 |
| +2.5 Volts monitor |  |
| +5 Volts monitor |  |
| _ROLL_ROT | 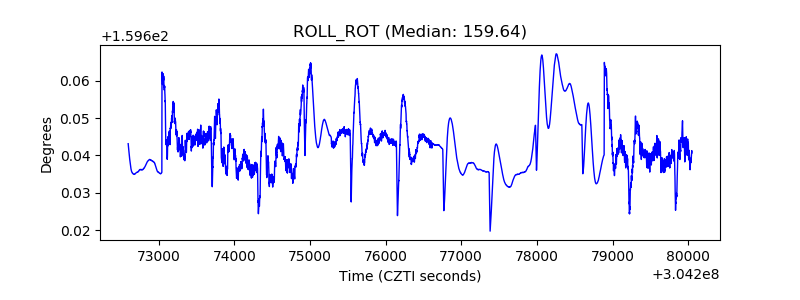 |
| _Roll_DEC | 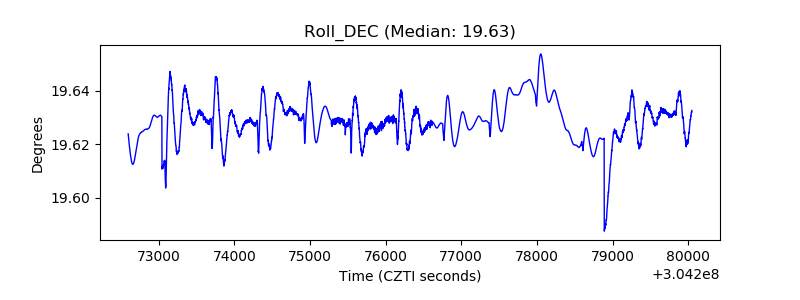 |
| _Roll_RA | 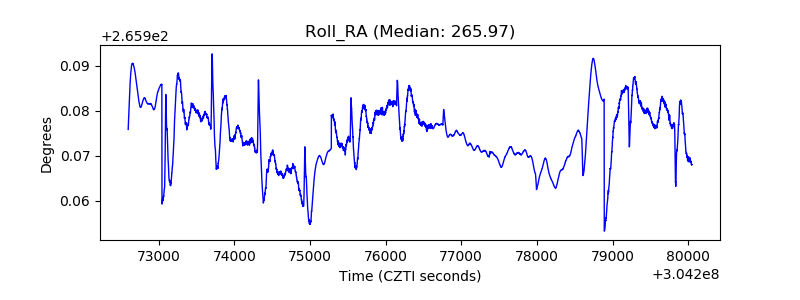 |
| Veto Counter | 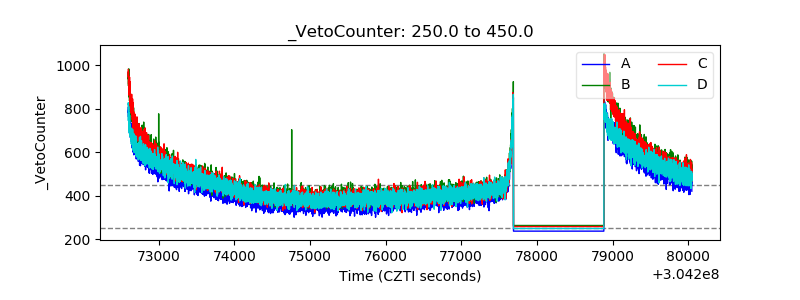 |