| Param | Original file | Final file |
|---|---|---|
| Filename | modeM0/AS1A05_163T01_9000003118_21102cztM0_level2.evt | modeM0/AS1A05_163T01_9000003118_21102cztM0_level2_quad_clean.evt |
| Size (bytes) | 497,275,200 | 95,904,000 |
| Size | 474.2 MB | 91.5 MB |
| Events in quadrant A | 3,150,303 | 634,551 |
| Events in quadrant B | 3,386,747 | 646,545 |
| Events in quadrant C | 3,287,791 | 606,906 |
| Events in quadrant D | 4,810,267 | 578,999 |
| Mode M9 | |||
|---|---|---|---|
| Quadrant | BADHDUFLAG | Total packets | Discarded packets |
| A | 0 | 13 | 0 |
| B | 0 | 14 | 0 |
| C | 0 | 14 | 0 |
| D | 0 | 14 | 0 |
| Mode M0 | |||
|---|---|---|---|
| Quadrant | BADHDUFLAG | Total packets | Discarded packets |
| A | 0 | 13369 | 2 |
| B | 0 | 13956 | 2 |
| C | 0 | 13755 | 2 |
| D | 0 | 18730 | 2 |
| Mode SS | |||
|---|---|---|---|
| Quadrant | BADHDUFLAG | Total packets | Discarded packets |
| A | 0 | 128 | 0 |
| B | 0 | 128 | 0 |
| C | 0 | 128 | 0 |
| D | 0 | 128 | 0 |
| Quadrant | Total seconds | Saturated seconds | Saturation percentage |
|---|---|---|---|
| A | 6264 | 26 | 0.415070% |
| B | 6264 | 46 | 0.734355% |
| C | 6264 | 73 | 1.165390% |
| D | 6263 | 99 | 1.580712% |
Noise dominated data is calculated using 1-second bins in cleaned event files. If a bin has >2000 counts, and if more than 50% of those come from <1% of pixels, then it is considered to be noise-dominated and hence unusable.
| Quadrant | # 1 sec bins | Bins with >0 counts | Bins with >2000 counts | High rate bins dominated by noise | Noise dominated (total time) | Noise dominated (detector-on time) | Marked lightcurve |
|---|---|---|---|---|---|---|---|
| A | 7544 | 6265 | 0 | 0 | 0.00% | 0.00% |  |
| B | 7544 | 6265 | 6 | 6 | 0.08% | 0.10% | 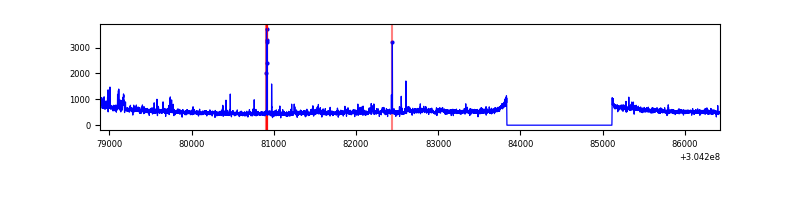 |
| C | 7544 | 6265 | 1 | 1 | 0.01% | 0.02% | 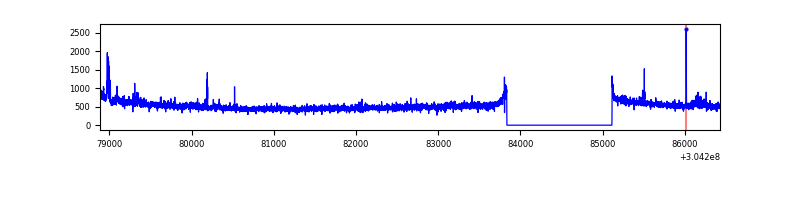 |
| D | 7543 | 6264 | 31 | 31 | 0.41% | 0.49% | 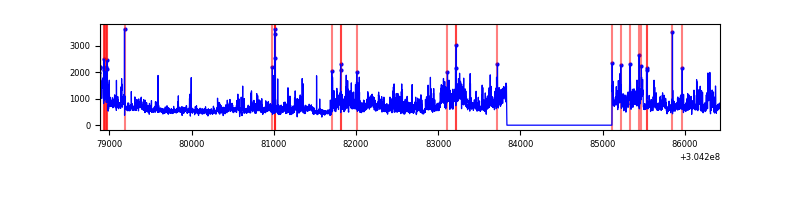 |
Top three noisy pixels from each quadrant. If the there are fewer than three noisy pixels in the level2.evt file, extra rows are filled as -1
| Pixel properties | Quadrant properties | ||||||
|---|---|---|---|---|---|---|---|
| Quadrant | DetID | PixID | Counts | Sigma | Mean | Median | Sigma |
| A | 13 | 254 | 10828 | 62.1 | 814 | 801 | 161.5 |
| A | 0 | 226 | 7066 | 38.8 | 814 | 801 | 161.5 |
| A | 8 | 205 | 6620 | 36.04 | 814 | 801 | 161.5 |
| B | 0 | 219 | 73039 | 473.11 | 816 | 796 | 152.7 |
| B | 0 | 190 | 38971 | 250.0 | 816 | 796 | 152.7 |
| B | 3 | 64 | 34302 | 219.43 | 816 | 796 | 152.7 |
| C | 14 | 238 | 124459 | 680.3 | 783 | 790 | 181.8 |
| C | 7 | 221 | 105339 | 575.12 | 783 | 790 | 181.8 |
| C | 9 | 54 | 6639 | 32.17 | 783 | 790 | 181.8 |
| D | 1 | 239 | 743222 | 3899.02 | 783 | 759 | 190.4 |
| D | 1 | 20 | 705899 | 3703.02 | 783 | 759 | 190.4 |
| D | 1 | 52 | 187427 | 980.28 | 783 | 759 | 190.4 |
Histogram calculated using DETX and DETY for each event in the final _common_clean file
| Quadrant A |  |
 |
Quadrant B |
|---|---|---|---|
| Quadrant D |  |
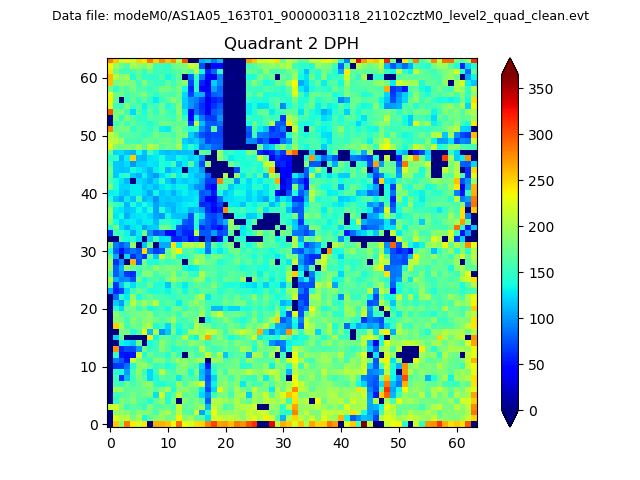 |
Quadrant C |
| Plot type | Count rate plots | Images |
|---|---|---|
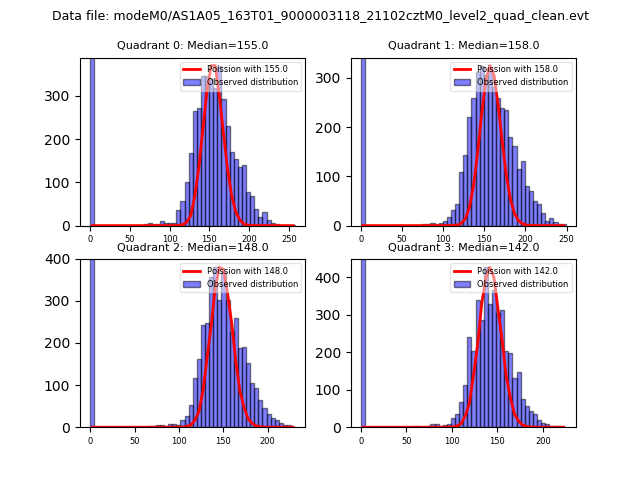
| Comparison with Poisson distribution Blue bars denote a histogram of data divided into 1 sec bins. Red curve is a Poisson curve with rate = median count rate of data. |
 |
 |
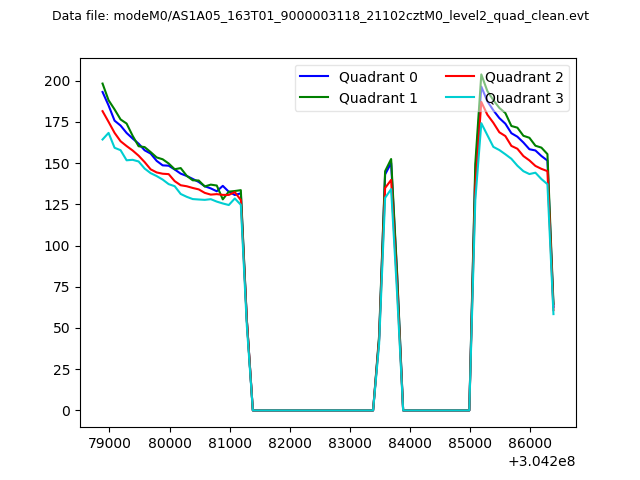
| Quadrant-wise count rates Data is divided into 100 sec bins |
 |
|
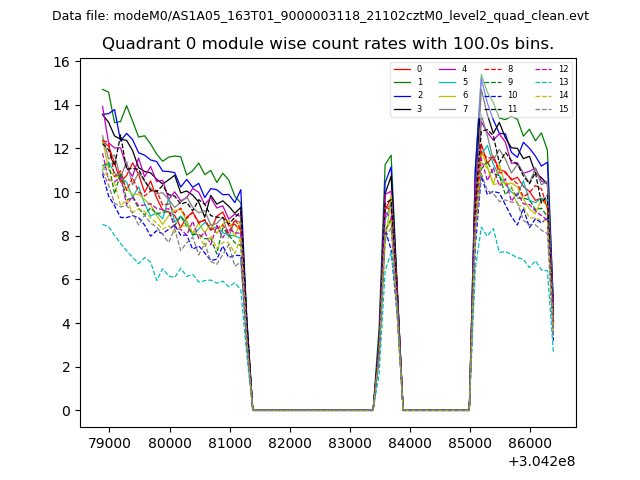
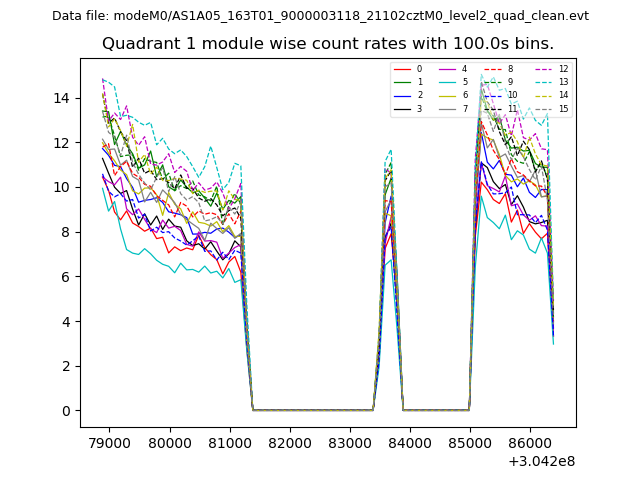
| Module-wise count rates for Quadrant A Data is divided into 100 sec bins |
 |
 |
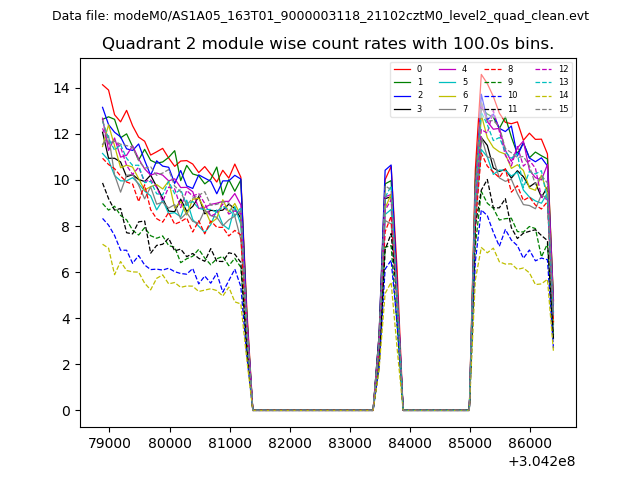
| Module-wise count rates for Quadrant B Data is divided into 100 sec bins |
 |
 |
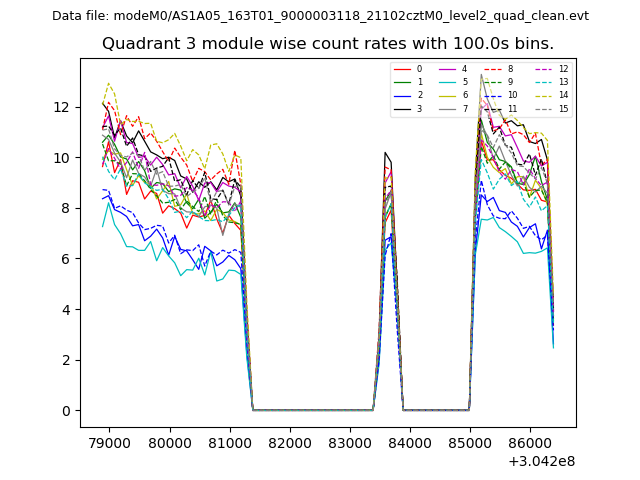
| Module-wise count rates for Quadrant C Data is divided into 100 sec bins |
 |
 |
| Module-wise count rates for Quadrant D Data is divided into 100 sec bins |
 |
 |
| Parameter | Plot |
|---|---|
| CZT HV Monitor | 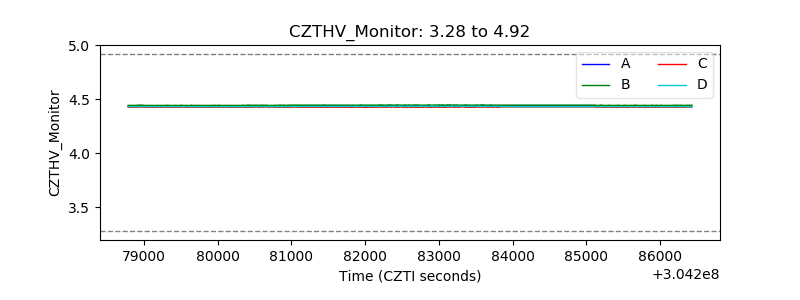 |
| D_VDD |  |
| Temperature 1 | 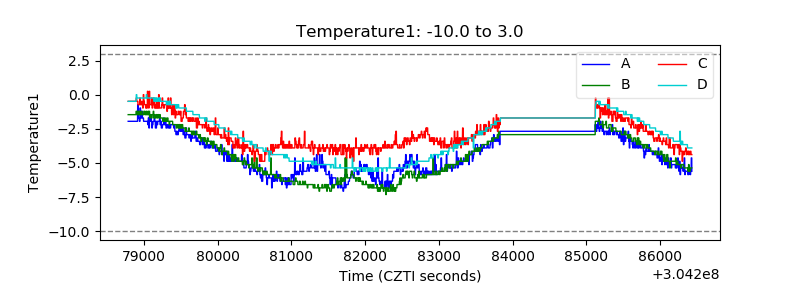 |
| Veto HV Monitor | 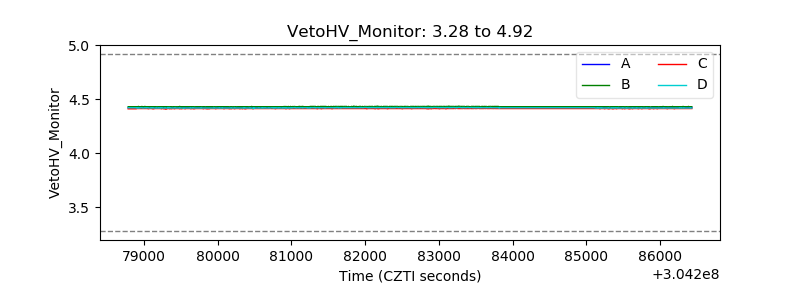 |
| Veto LLD | 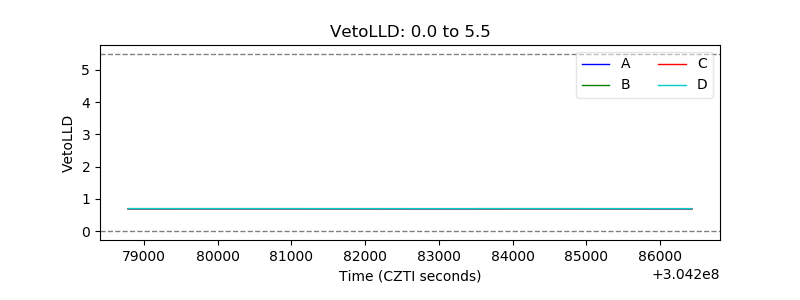 |
| Alpha Counter | 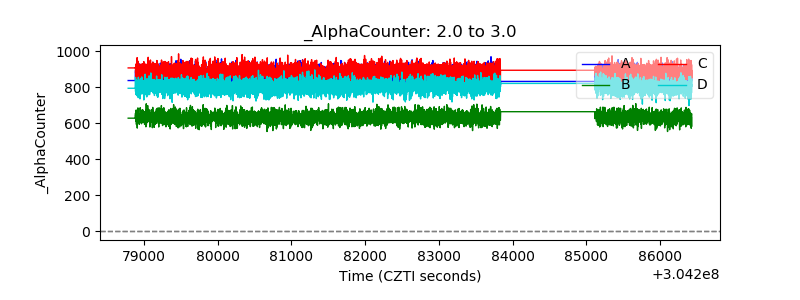 |
| _CPM_Rate | 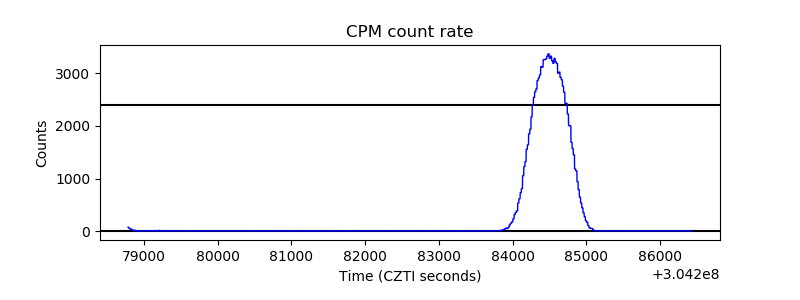 |
| CZT Counter | 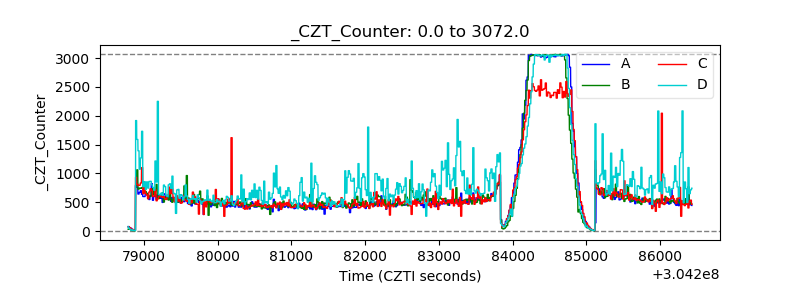 |
| +2.5 Volts monitor |  |
| +5 Volts monitor | 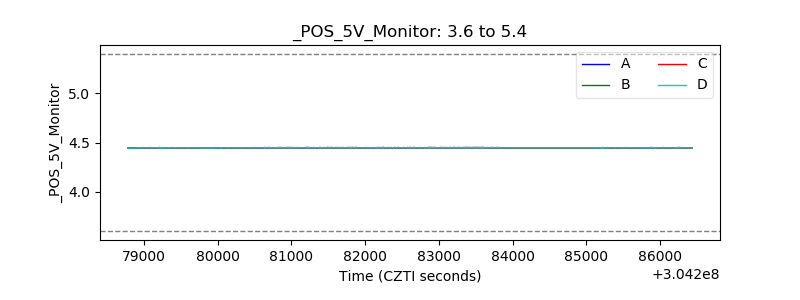 |
| _ROLL_ROT | 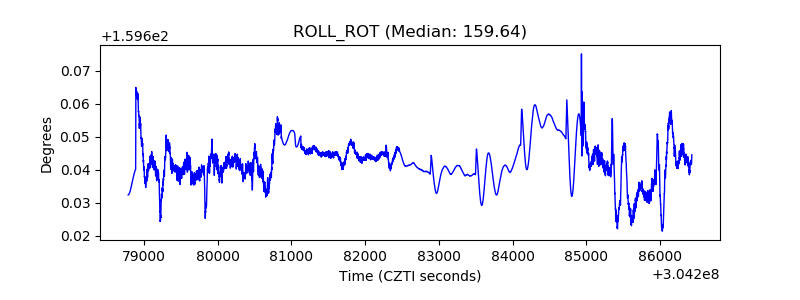 |
| _Roll_DEC | 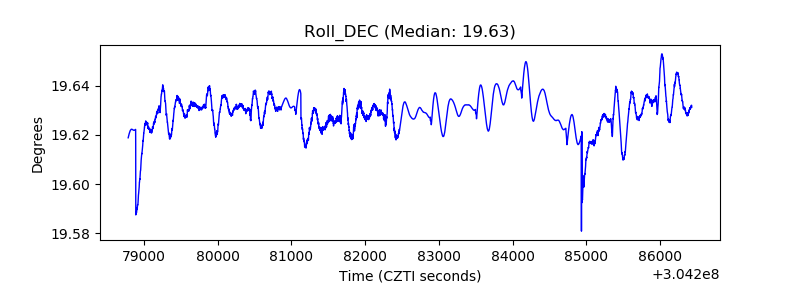 |
| _Roll_RA | 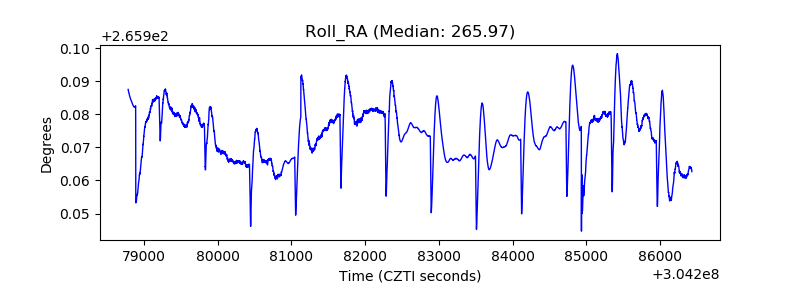 |
| Veto Counter | 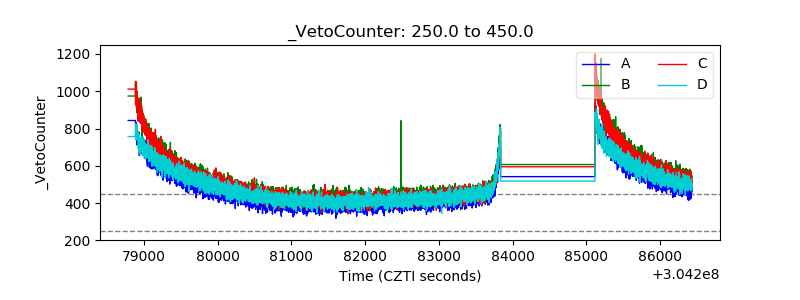 |