| Param | Original file | Final file |
|---|---|---|
| Filename | modeM0/AS1A05_163T01_9000003118_21103cztM0_level2.evt | modeM0/AS1A05_163T01_9000003118_21103cztM0_level2_quad_clean.evt |
| Size (bytes) | 565,151,040 | 96,140,160 |
| Size | 539.0 MB | 91.7 MB |
| Events in quadrant A | 3,182,907 | 644,136 |
| Events in quadrant B | 3,315,389 | 662,800 |
| Events in quadrant C | 3,265,615 | 616,444 |
| Events in quadrant D | 6,932,330 | 555,186 |
| Mode M9 | |||
|---|---|---|---|
| Quadrant | BADHDUFLAG | Total packets | Discarded packets |
| A | 0 | 23 | 0 |
| B | 0 | 24 | 0 |
| C | 0 | 24 | 0 |
| D | 0 | 24 | 0 |
| Mode M0 | |||
|---|---|---|---|
| Quadrant | BADHDUFLAG | Total packets | Discarded packets |
| A | 0 | 13266 | 3 |
| B | 0 | 13605 | 2 |
| C | 0 | 13458 | 2 |
| D | 0 | 25077 | 2 |
| Mode SS | |||
|---|---|---|---|
| Quadrant | BADHDUFLAG | Total packets | Discarded packets |
| A | 0 | 126 | 0 |
| B | 0 | 126 | 0 |
| C | 0 | 126 | 0 |
| D | 0 | 126 | 0 |
| Quadrant | Total seconds | Saturated seconds | Saturation percentage |
|---|---|---|---|
| A | 6200 | 27 | 0.435484% |
| B | 6200 | 53 | 0.854839% |
| C | 6200 | 48 | 0.774194% |
| D | 6200 | 577 | 9.306452% |
Noise dominated data is calculated using 1-second bins in cleaned event files. If a bin has >2000 counts, and if more than 50% of those come from <1% of pixels, then it is considered to be noise-dominated and hence unusable.
| Quadrant | # 1 sec bins | Bins with >0 counts | Bins with >2000 counts | High rate bins dominated by noise | Noise dominated (total time) | Noise dominated (detector-on time) | Marked lightcurve |
|---|---|---|---|---|---|---|---|
| A | 7545 | 6201 | 0 | 0 | 0.00% | 0.00% | 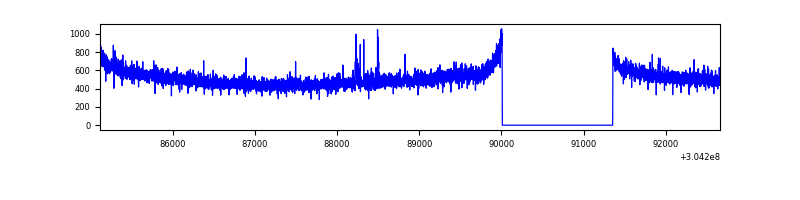 |
| B | 7545 | 6201 | 0 | 0 | 0.00% | 0.00% | 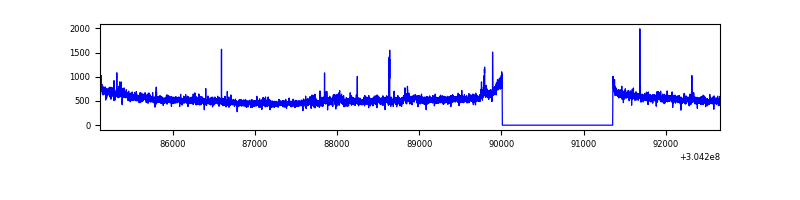 |
| C | 7545 | 6201 | 1 | 1 | 0.01% | 0.02% | 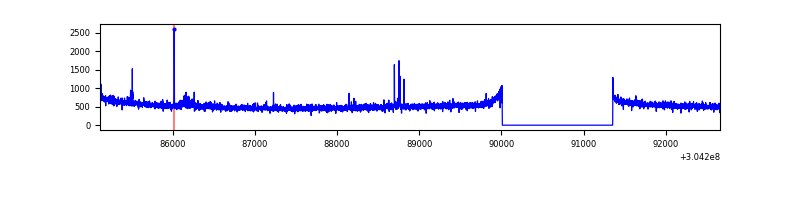 |
| D | 7545 | 6201 | 644 | 644 | 8.54% | 10.39% | 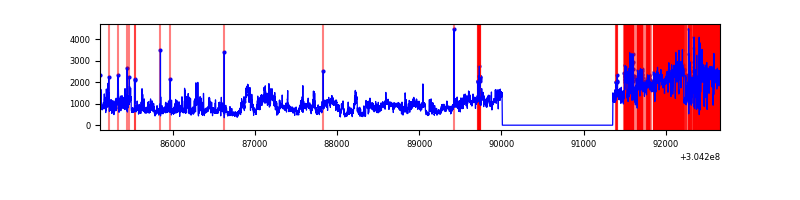 |
Top three noisy pixels from each quadrant. If the there are fewer than three noisy pixels in the level2.evt file, extra rows are filled as -1
| Pixel properties | Quadrant properties | ||||||
|---|---|---|---|---|---|---|---|
| Quadrant | DetID | PixID | Counts | Sigma | Mean | Median | Sigma |
| A | 15 | 192 | 12730 | 72.56 | 821 | 806 | 164.3 |
| A | 13 | 254 | 10969 | 61.84 | 821 | 806 | 164.3 |
| A | 0 | 226 | 7076 | 38.15 | 821 | 806 | 164.3 |
| B | 0 | 219 | 46648 | 298.43 | 825 | 807 | 153.6 |
| B | 12 | 111 | 17405 | 108.06 | 825 | 807 | 153.6 |
| B | 11 | 111 | 14991 | 92.34 | 825 | 807 | 153.6 |
| C | 14 | 238 | 125768 | 681.11 | 789 | 797 | 183.5 |
| C | 7 | 221 | 57220 | 307.51 | 789 | 797 | 183.5 |
| C | 13 | 61 | 5367 | 24.91 | 789 | 797 | 183.5 |
| D | 1 | 20 | 1808040 | 9742.11 | 770 | 751 | 185.5 |
| D | 1 | 52 | 1551374 | 8358.56 | 770 | 751 | 185.5 |
| D | 7 | 238 | 315285 | 1695.48 | 770 | 751 | 185.5 |
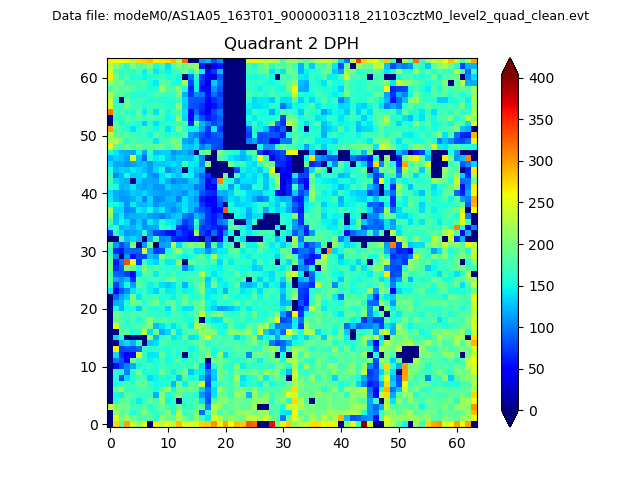
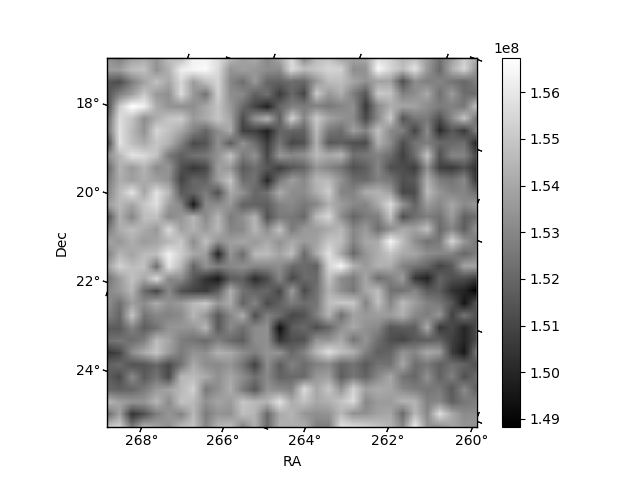
Histogram calculated using DETX and DETY for each event in the final _common_clean file
| Quadrant A | 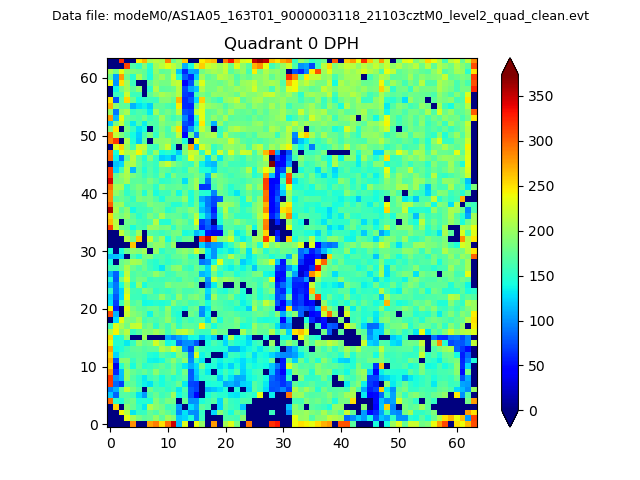 |
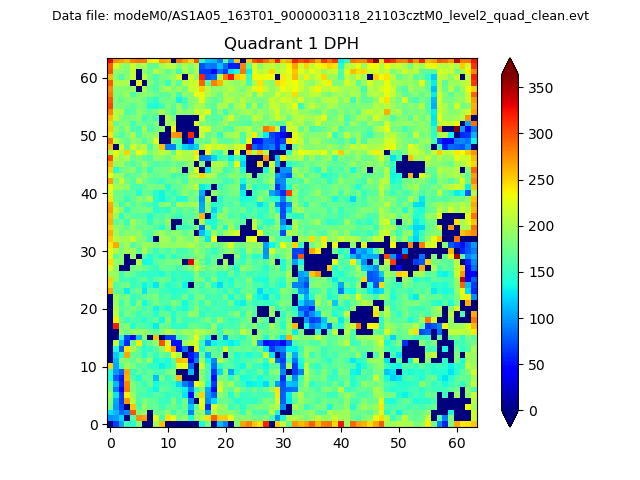 |
Quadrant B |
|---|---|---|---|
| Quadrant D | 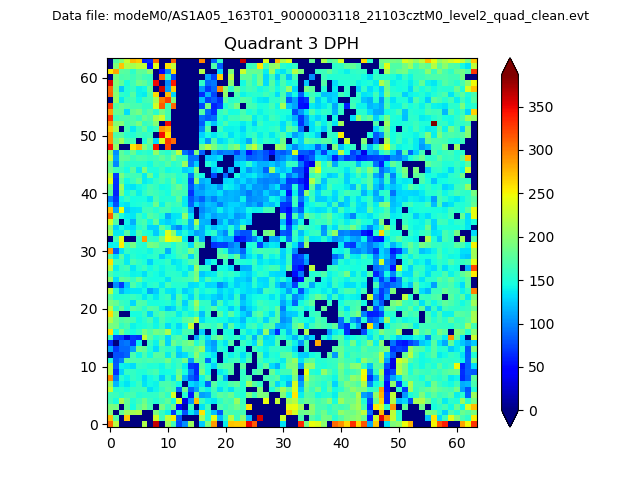 |
 |
Quadrant C |
| Plot type | Count rate plots | Images |
|---|---|---|
| Comparison with Poisson distribution Blue bars denote a histogram of data divided into 1 sec bins. Red curve is a Poisson curve with rate = median count rate of data. |
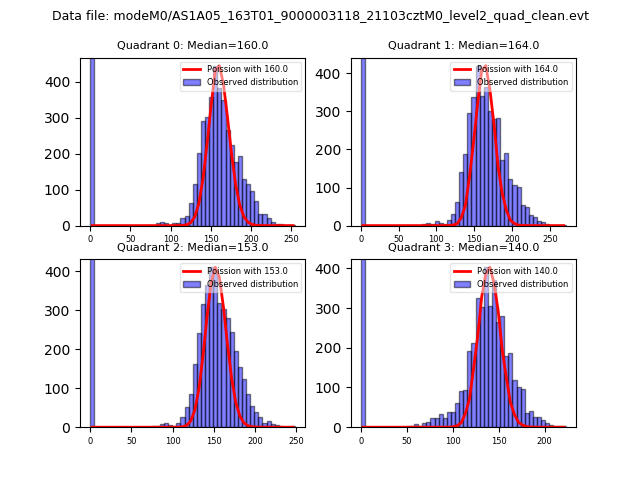 |
 |
| Quadrant-wise count rates Data is divided into 100 sec bins |
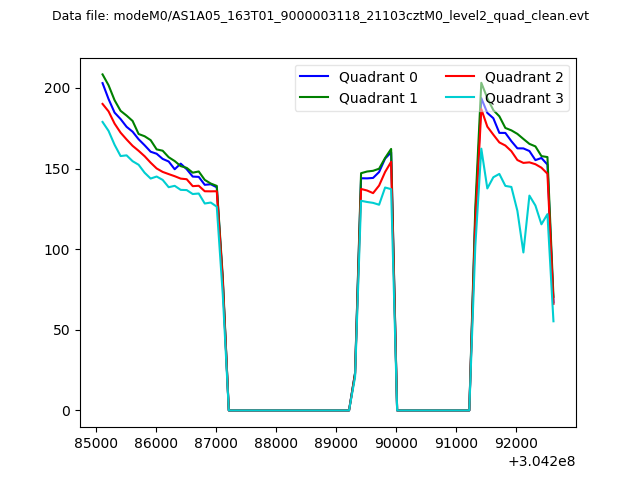 |
|
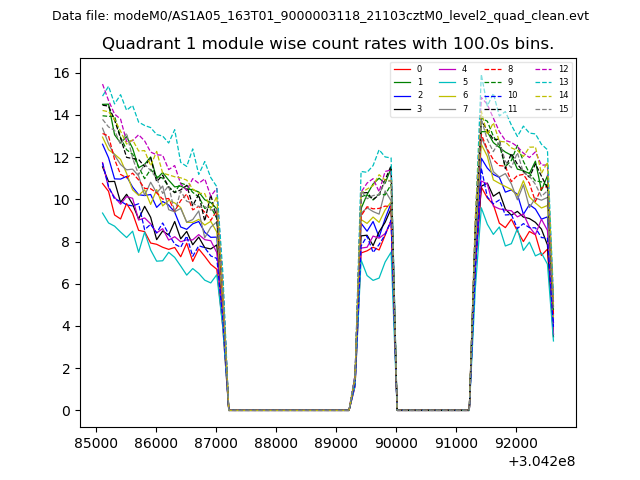
| Module-wise count rates for Quadrant A Data is divided into 100 sec bins |
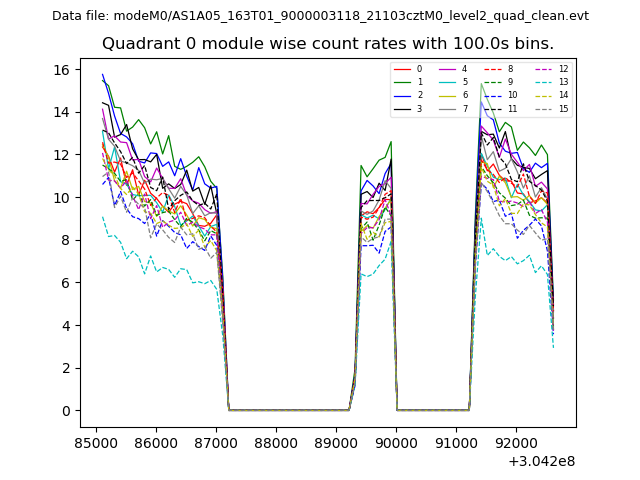 |
 |
| Module-wise count rates for Quadrant B Data is divided into 100 sec bins |
 |
 |
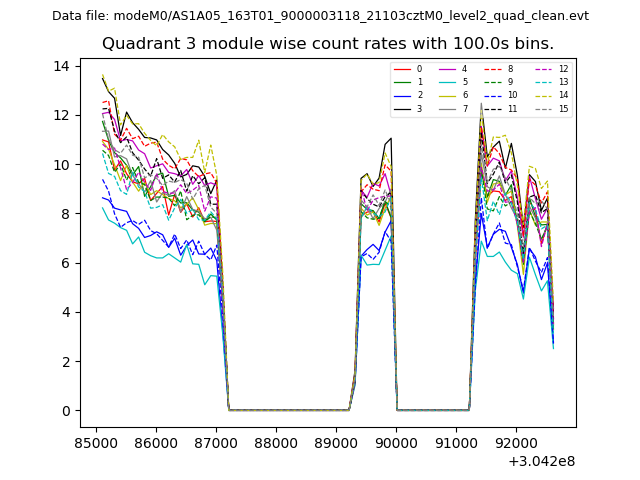
| Module-wise count rates for Quadrant C Data is divided into 100 sec bins |
 |
 |
| Module-wise count rates for Quadrant D Data is divided into 100 sec bins |
 |
 |
| Parameter | Plot |
|---|---|
| CZT HV Monitor | 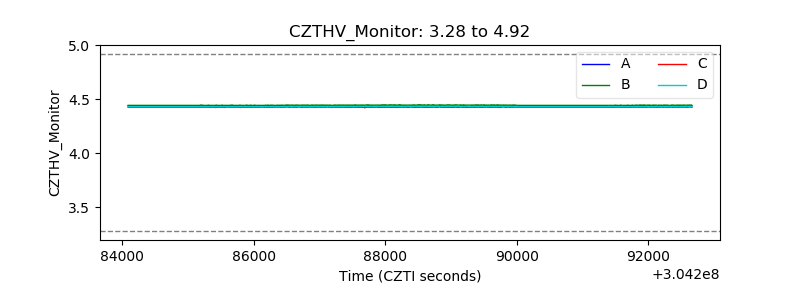 |
| D_VDD |  |
| Temperature 1 | 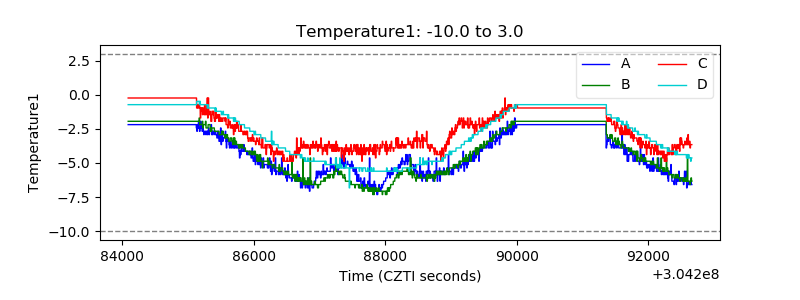 |
| Veto HV Monitor | 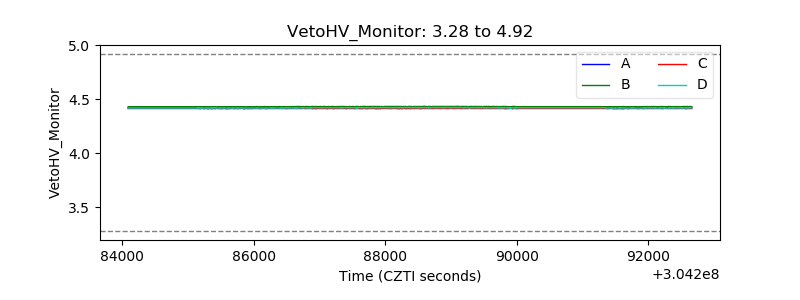 |
| Veto LLD | 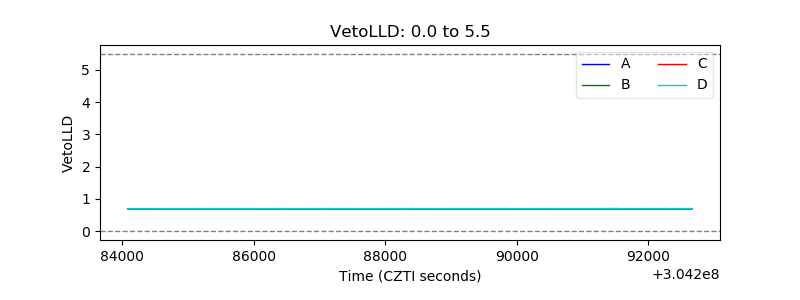 |
| Alpha Counter | 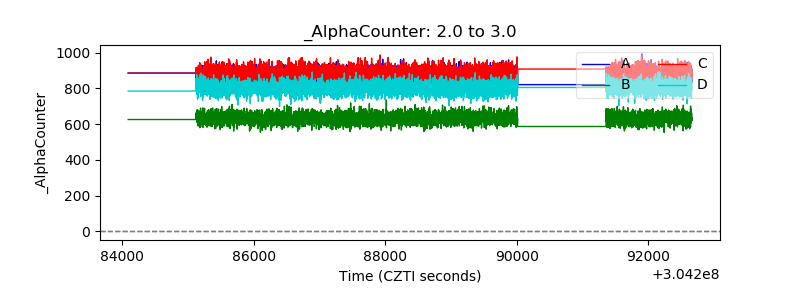 |
| _CPM_Rate | 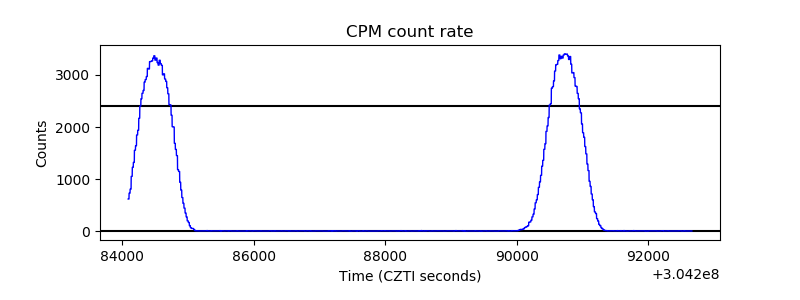 |
| CZT Counter | 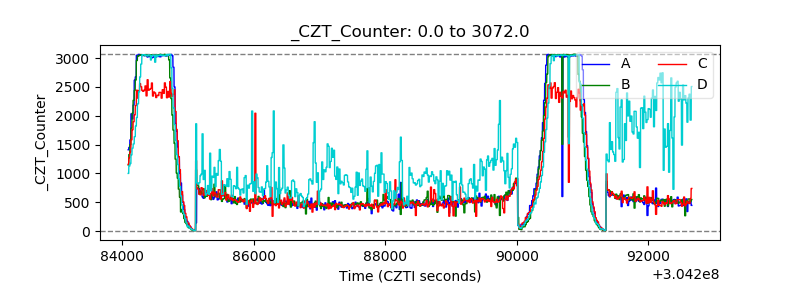 |
| +2.5 Volts monitor |  |
| +5 Volts monitor |  |
| _ROLL_ROT | 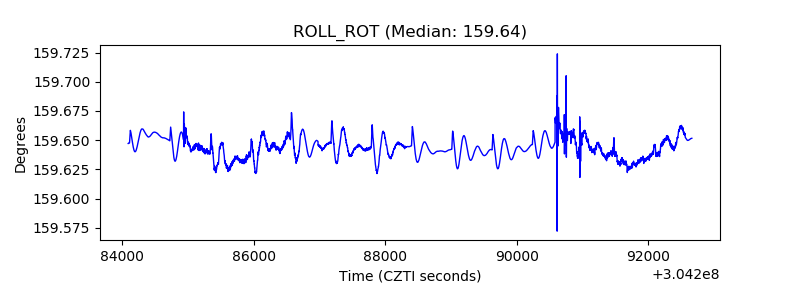 |
| _Roll_DEC | 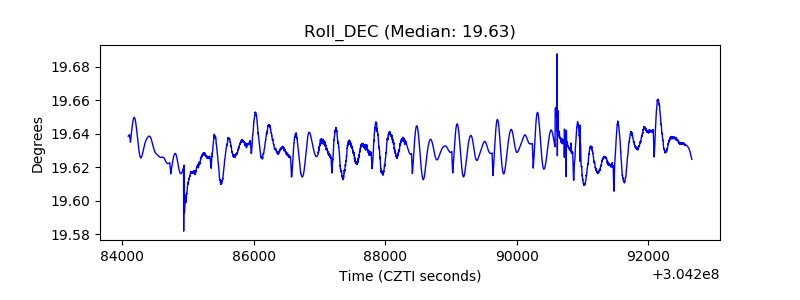 |
| _Roll_RA |  |
| Veto Counter | 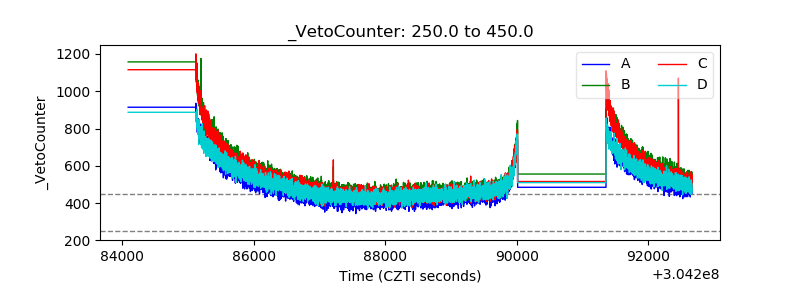 |