| Param | Original file | Final file |
|---|---|---|
| Filename | modeM0/AS1A05_163T01_9000003118_21104cztM0_level2.evt | modeM0/AS1A05_163T01_9000003118_21104cztM0_level2_quad_clean.evt |
| Size (bytes) | 594,083,520 | 92,831,040 |
| Size | 566.6 MB | 88.5 MB |
| Events in quadrant A | 3,117,464 | 621,766 |
| Events in quadrant B | 3,354,482 | 636,004 |
| Events in quadrant C | 3,167,738 | 594,237 |
| Events in quadrant D | 7,936,373 | 529,409 |
| Mode M9 | |||
|---|---|---|---|
| Quadrant | BADHDUFLAG | Total packets | Discarded packets |
| A | 0 | 24 | 0 |
| B | 0 | 25 | 0 |
| C | 0 | 25 | 0 |
| D | 0 | 25 | 0 |
| Mode M0 | |||
|---|---|---|---|
| Quadrant | BADHDUFLAG | Total packets | Discarded packets |
| A | 0 | 12990 | 2 |
| B | 0 | 13580 | 2 |
| C | 0 | 13018 | 2 |
| D | 0 | 27938 | 2 |
| Mode SS | |||
|---|---|---|---|
| Quadrant | BADHDUFLAG | Total packets | Discarded packets |
| A | 0 | 126 | 0 |
| B | 0 | 126 | 0 |
| C | 0 | 126 | 0 |
| D | 0 | 126 | 0 |
| Quadrant | Total seconds | Saturated seconds | Saturation percentage |
|---|---|---|---|
| A | 6152 | 14 | 0.227568% |
| B | 6151 | 50 | 0.812876% |
| C | 6151 | 38 | 0.617786% |
| D | 6151 | 642 | 10.437327% |
Noise dominated data is calculated using 1-second bins in cleaned event files. If a bin has >2000 counts, and if more than 50% of those come from <1% of pixels, then it is considered to be noise-dominated and hence unusable.
| Quadrant | # 1 sec bins | Bins with >0 counts | Bins with >2000 counts | High rate bins dominated by noise | Noise dominated (total time) | Noise dominated (detector-on time) | Marked lightcurve |
|---|---|---|---|---|---|---|---|
| A | 7547 | 6153 | 0 | 0 | 0.00% | 0.00% | 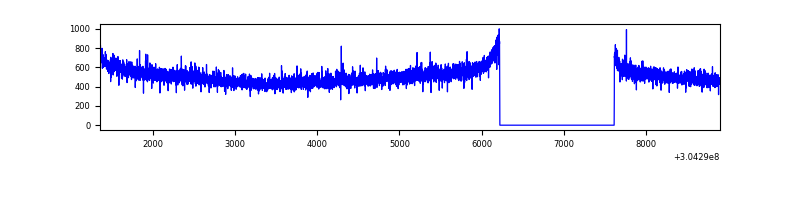 |
| B | 7546 | 6152 | 1 | 1 | 0.01% | 0.02% | 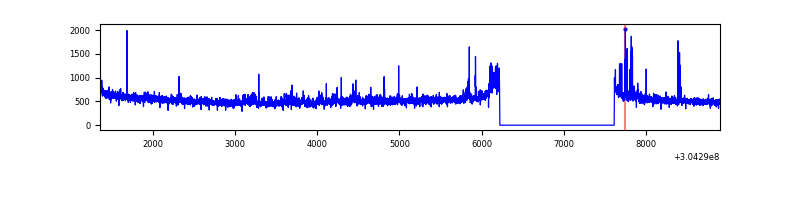 |
| C | 7546 | 6152 | 0 | 0 | 0.00% | 0.00% | 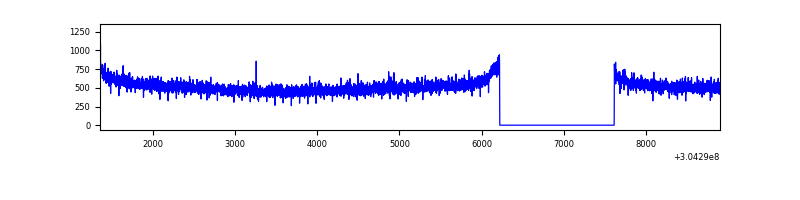 |
| D | 7546 | 6152 | 825 | 825 | 10.93% | 13.41% | 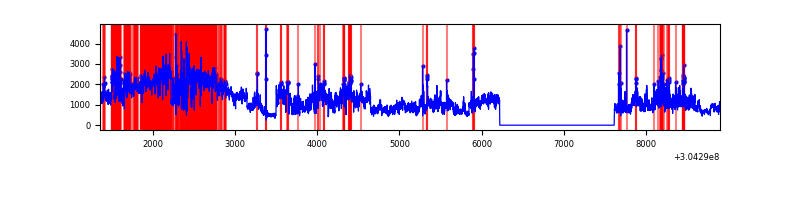 |
Top three noisy pixels from each quadrant. If the there are fewer than three noisy pixels in the level2.evt file, extra rows are filled as -1
| Pixel properties | Quadrant properties | ||||||
|---|---|---|---|---|---|---|---|
| Quadrant | DetID | PixID | Counts | Sigma | Mean | Median | Sigma |
| A | 13 | 254 | 10124 | 58.08 | 807 | 795 | 160.6 |
| A | 0 | 226 | 7076 | 39.1 | 807 | 795 | 160.6 |
| A | 3 | 137 | 6071 | 32.85 | 807 | 795 | 160.6 |
| B | 0 | 219 | 74591 | 492.1 | 812 | 794 | 150.0 |
| B | 7 | 220 | 51281 | 336.66 | 812 | 794 | 150.0 |
| B | 12 | 111 | 17423 | 110.89 | 812 | 794 | 150.0 |
| C | 14 | 238 | 123026 | 682.67 | 773 | 782 | 179.1 |
| C | 7 | 221 | 20328 | 109.15 | 773 | 782 | 179.1 |
| C | 10 | 91 | 6358 | 31.14 | 773 | 782 | 179.1 |
| D | 1 | 52 | 2623890 | 14430.49 | 752 | 732 | 181.8 |
| D | 1 | 20 | 1613390 | 8871.54 | 752 | 732 | 181.8 |
| D | 7 | 238 | 357017 | 1959.99 | 752 | 732 | 181.8 |
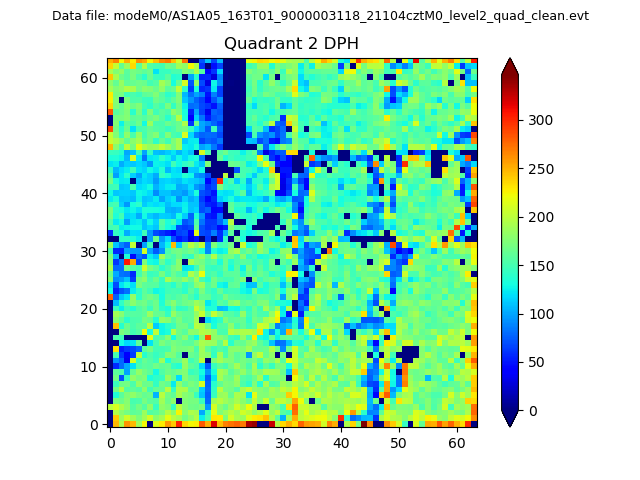
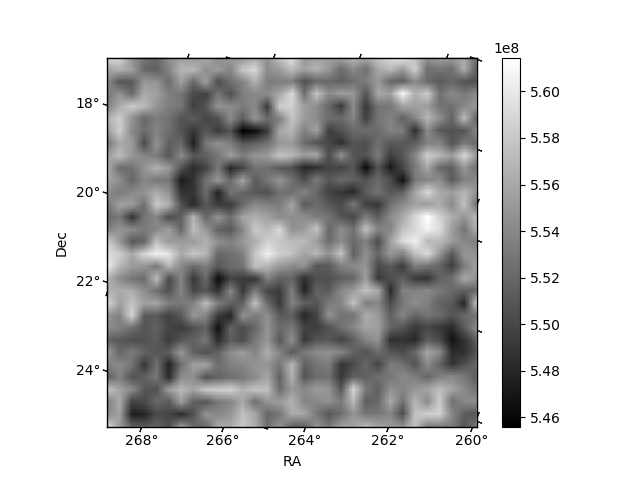
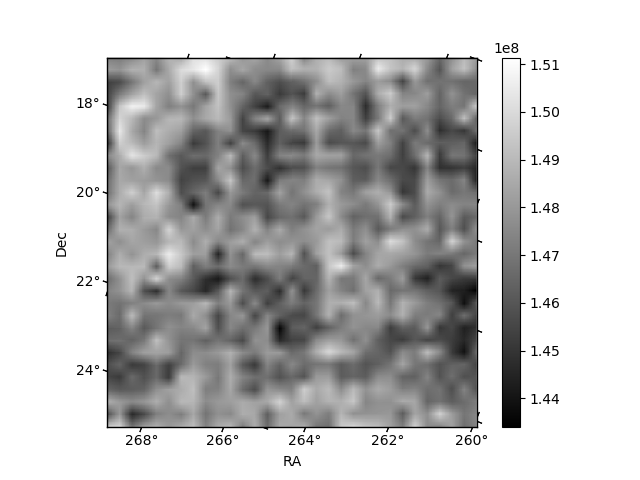
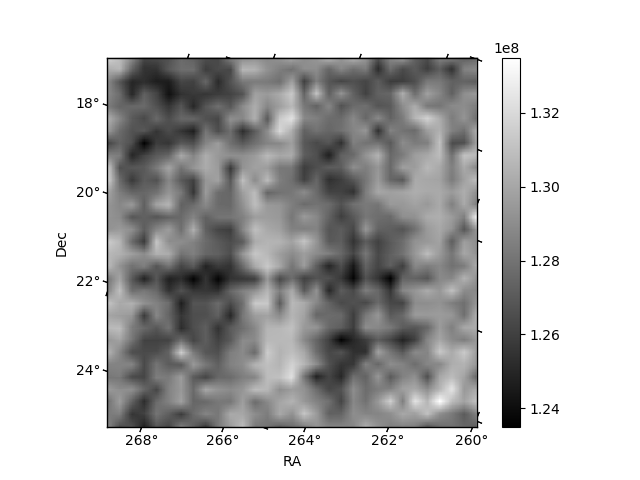
Histogram calculated using DETX and DETY for each event in the final _common_clean file
| Quadrant A | 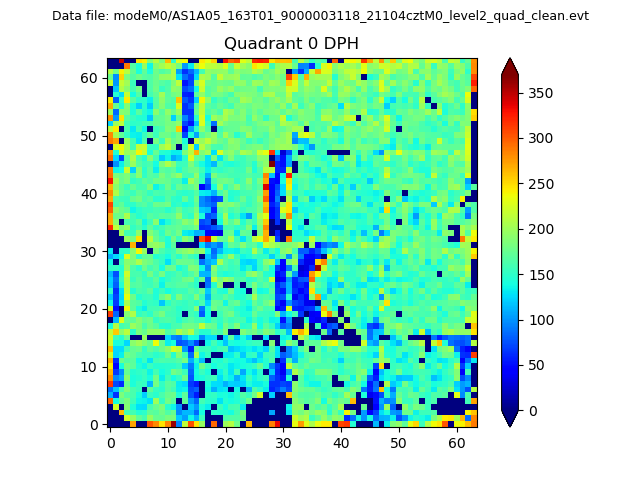 |
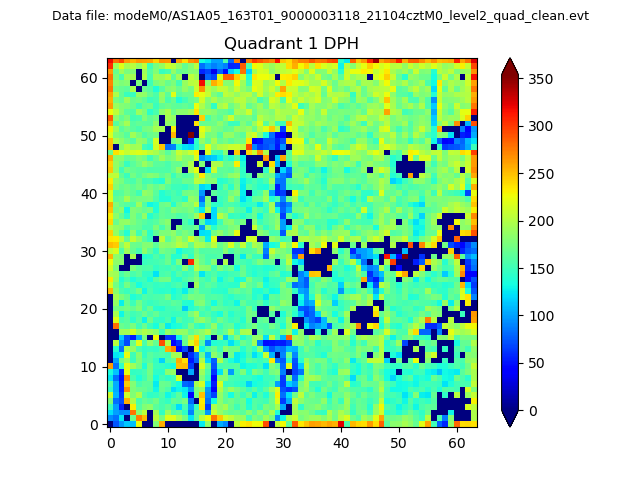 |
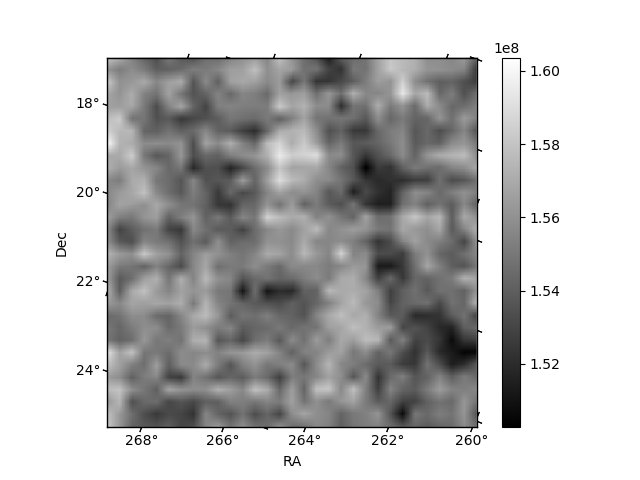
Quadrant B |
|---|---|---|---|
| Quadrant D | 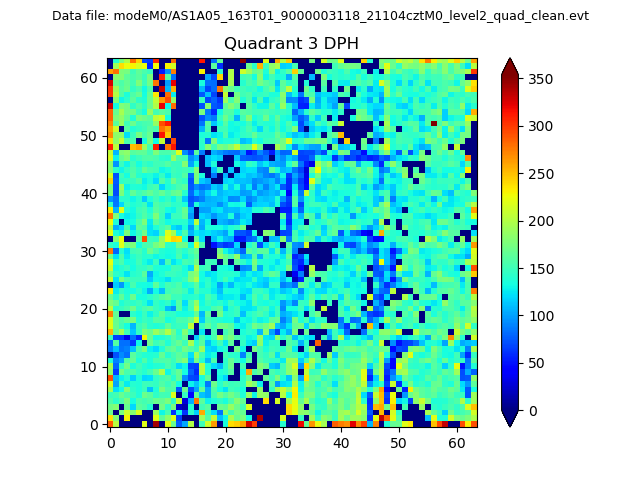 |
 |
Quadrant C |
| Plot type | Count rate plots | Images |
|---|---|---|
| Comparison with Poisson distribution Blue bars denote a histogram of data divided into 1 sec bins. Red curve is a Poisson curve with rate = median count rate of data. |
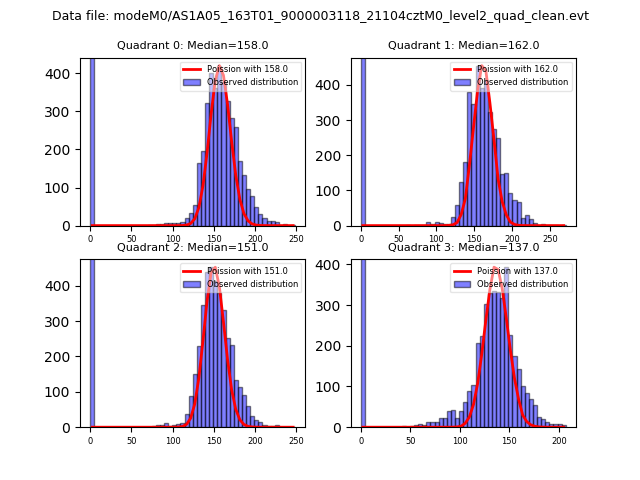 |
 |
| Quadrant-wise count rates Data is divided into 100 sec bins |
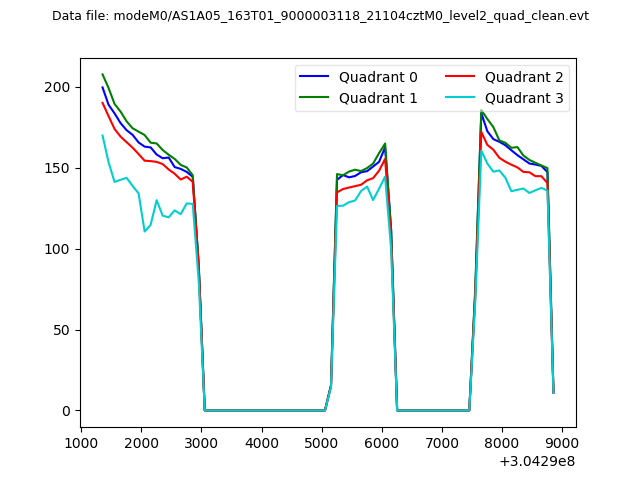 |
|
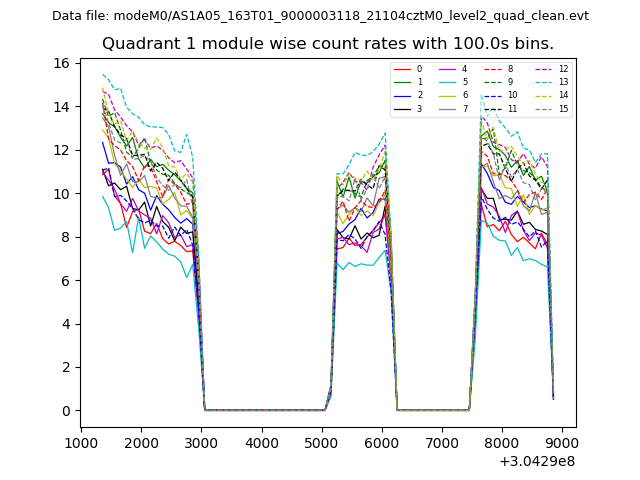
| Module-wise count rates for Quadrant A Data is divided into 100 sec bins |
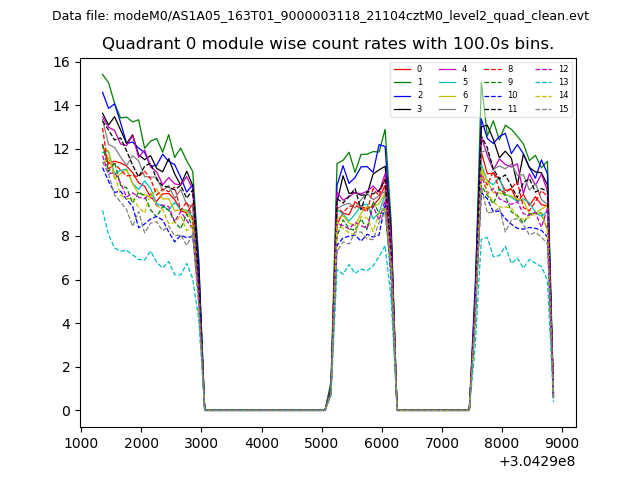 |
 |
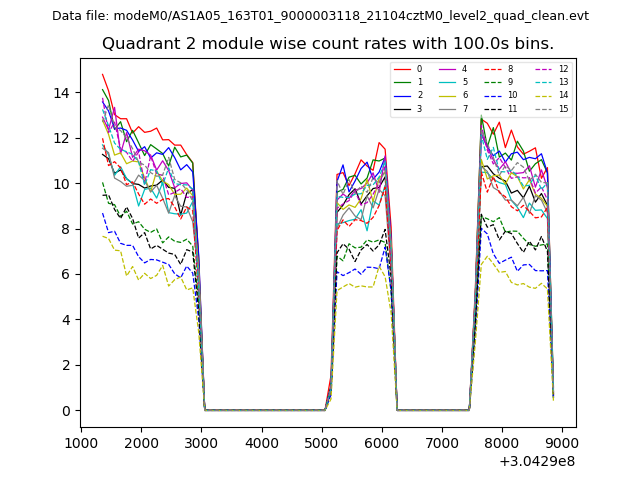
| Module-wise count rates for Quadrant B Data is divided into 100 sec bins |
 |
 |
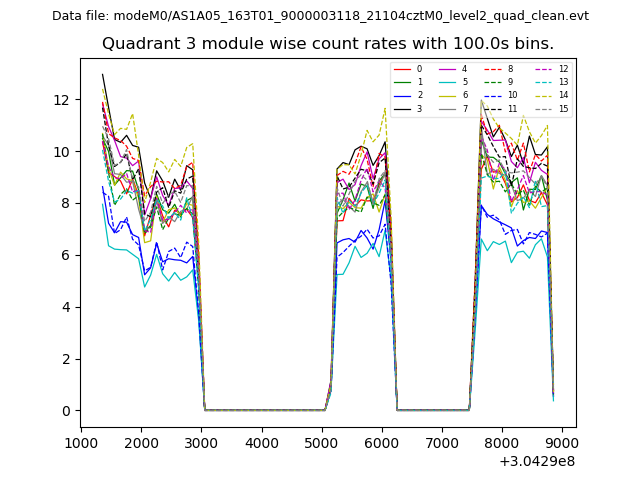
| Module-wise count rates for Quadrant C Data is divided into 100 sec bins |
 |
 |
| Module-wise count rates for Quadrant D Data is divided into 100 sec bins |
 |
 |
| Parameter | Plot |
|---|---|
| CZT HV Monitor | 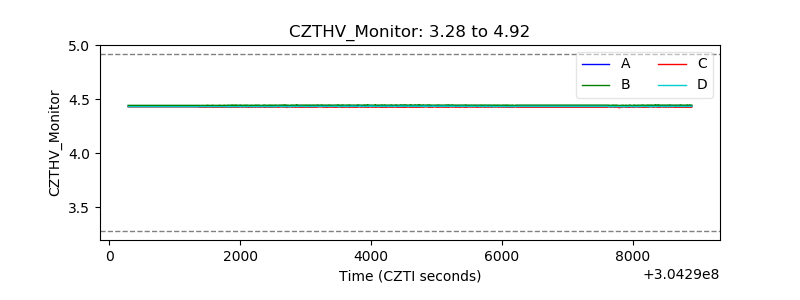 |
| D_VDD | 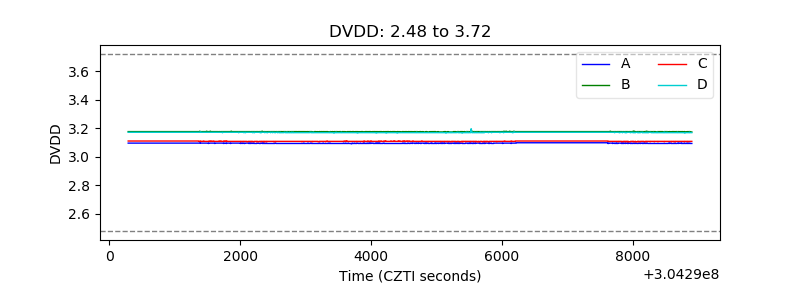 |
| Temperature 1 |  |
| Veto HV Monitor | 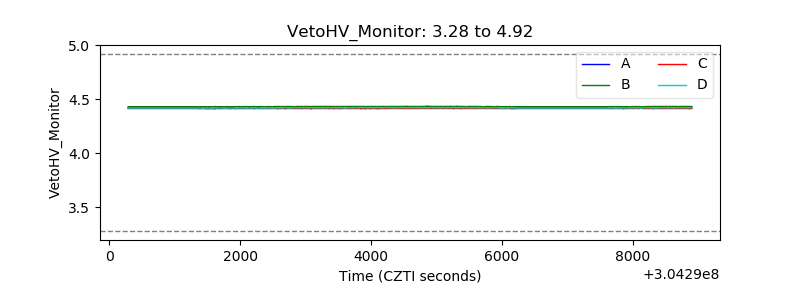 |
| Veto LLD | 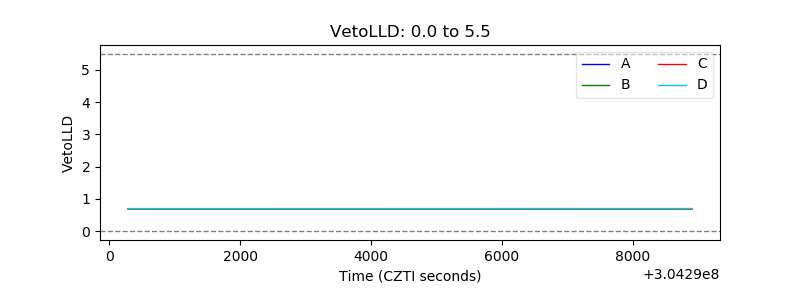 |
| Alpha Counter | 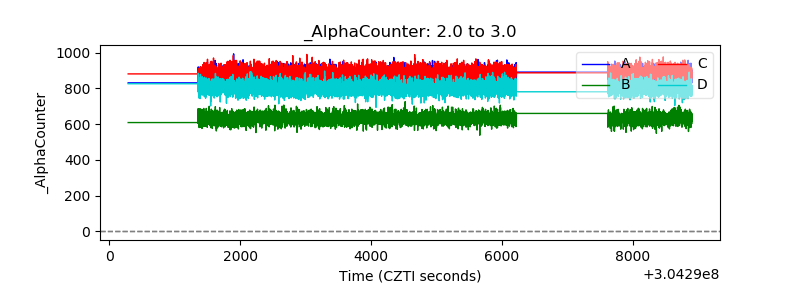 |
| _CPM_Rate | 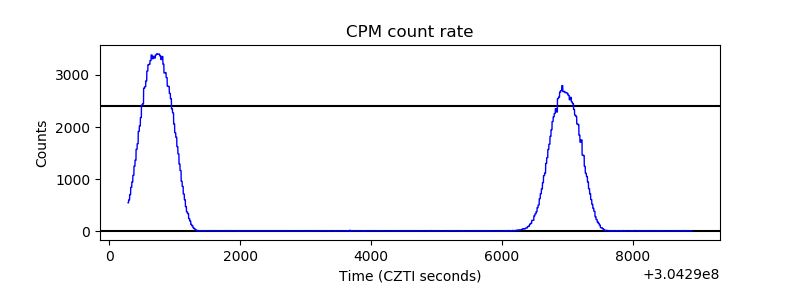 |
| CZT Counter | 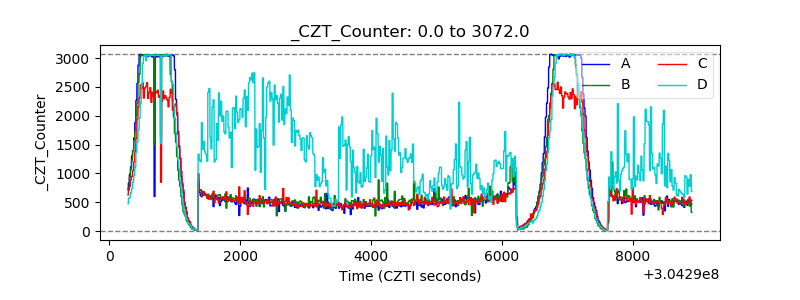 |
| +2.5 Volts monitor | 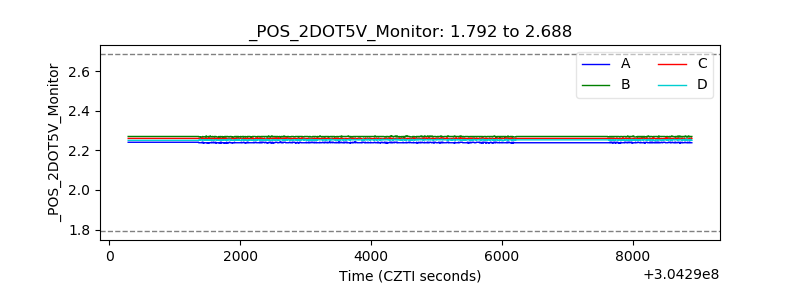 |
| +5 Volts monitor |  |
| _ROLL_ROT | 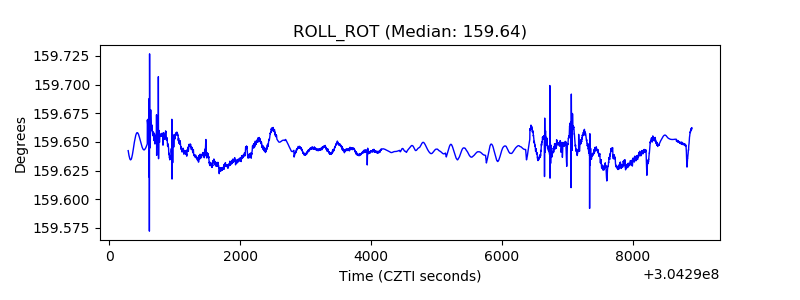 |
| _Roll_DEC | 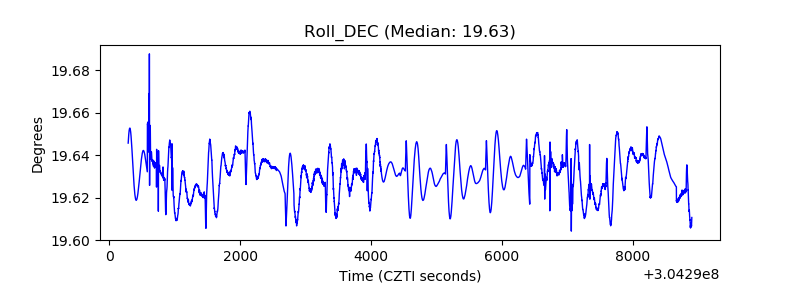 |
| _Roll_RA | 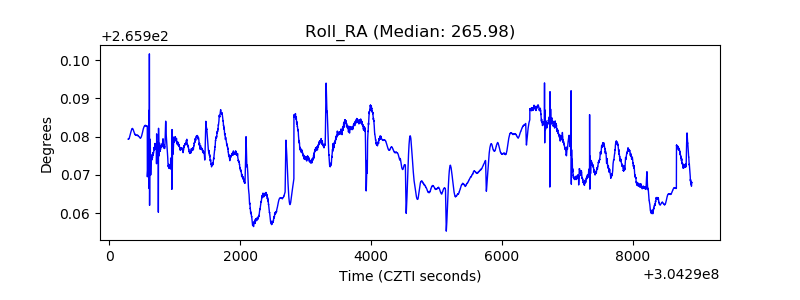 |
| Veto Counter | 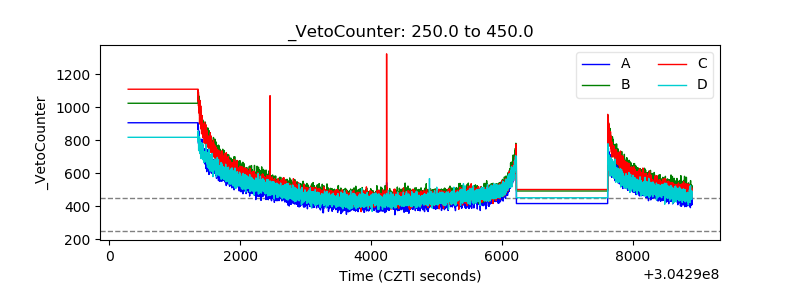 |