| Param | Original file | Final file |
|---|---|---|
| Filename | modeM0/AS1A05_163T01_9000003118_21105cztM0_level2.evt | modeM0/AS1A05_163T01_9000003118_21105cztM0_level2_quad_clean.evt |
| Size (bytes) | 507,922,560 | 84,631,680 |
| Size | 484.4 MB | 80.7 MB |
| Events in quadrant A | 3,109,176 | 549,882 |
| Events in quadrant B | 3,324,566 | 559,803 |
| Events in quadrant C | 3,317,515 | 523,414 |
| Events in quadrant D | 5,206,756 | 492,530 |
| Mode M9 | |||
|---|---|---|---|
| Quadrant | BADHDUFLAG | Total packets | Discarded packets |
| A | 0 | 17 | 0 |
| B | 0 | 18 | 0 |
| C | 0 | 18 | 0 |
| D | 0 | 18 | 0 |
| Mode M0 | |||
|---|---|---|---|
| Quadrant | BADHDUFLAG | Total packets | Discarded packets |
| A | 0 | 13058 | 2 |
| B | 0 | 13679 | 2 |
| C | 0 | 13592 | 2 |
| D | 0 | 19901 | 2 |
| Mode SS | |||
|---|---|---|---|
| Quadrant | BADHDUFLAG | Total packets | Discarded packets |
| A | 0 | 126 | 0 |
| B | 0 | 126 | 0 |
| C | 0 | 126 | 0 |
| D | 0 | 126 | 0 |
| Quadrant | Total seconds | Saturated seconds | Saturation percentage |
|---|---|---|---|
| A | 6268 | 23 | 0.366943% |
| B | 6268 | 69 | 1.100830% |
| C | 6268 | 67 | 1.068922% |
| D | 6267 | 210 | 3.350886% |
Noise dominated data is calculated using 1-second bins in cleaned event files. If a bin has >2000 counts, and if more than 50% of those come from <1% of pixels, then it is considered to be noise-dominated and hence unusable.
| Quadrant | # 1 sec bins | Bins with >0 counts | Bins with >2000 counts | High rate bins dominated by noise | Noise dominated (total time) | Noise dominated (detector-on time) | Marked lightcurve |
|---|---|---|---|---|---|---|---|
| A | 7543 | 6269 | 0 | 0 | 0.00% | 0.00% | 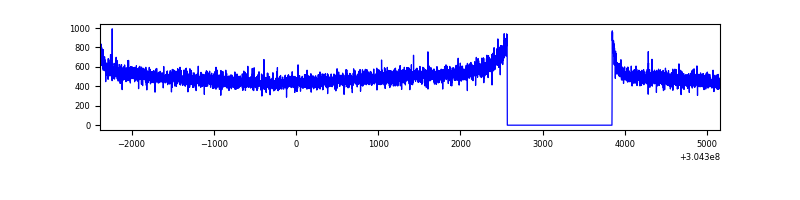 |
| B | 7543 | 6269 | 3 | 3 | 0.04% | 0.05% | 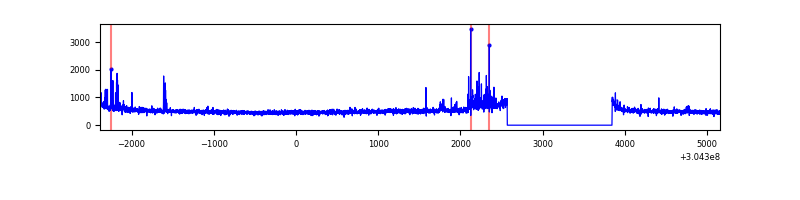 |
| C | 7543 | 6269 | 0 | 0 | 0.00% | 0.00% | 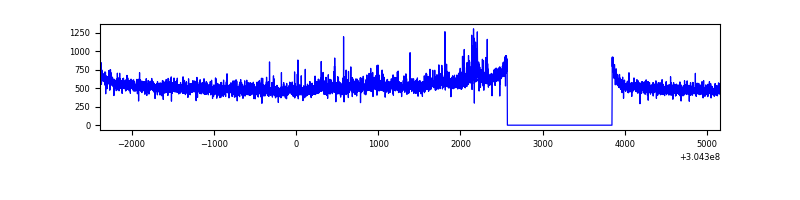 |
| D | 7542 | 6268 | 139 | 139 | 1.84% | 2.22% | 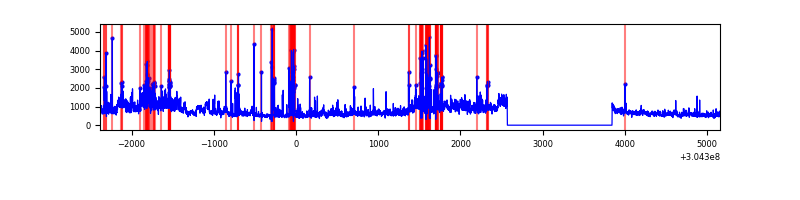 |
Top three noisy pixels from each quadrant. If the there are fewer than three noisy pixels in the level2.evt file, extra rows are filled as -1
| Pixel properties | Quadrant properties | ||||||
|---|---|---|---|---|---|---|---|
| Quadrant | DetID | PixID | Counts | Sigma | Mean | Median | Sigma |
| A | 13 | 254 | 10074 | 57.57 | 807 | 793 | 161.2 |
| A | 0 | 226 | 7106 | 39.16 | 807 | 793 | 161.2 |
| A | 3 | 137 | 6476 | 35.25 | 807 | 793 | 161.2 |
| B | 7 | 220 | 105668 | 687.58 | 811 | 794 | 152.5 |
| B | 12 | 111 | 17722 | 110.98 | 811 | 794 | 152.5 |
| B | 11 | 111 | 15751 | 98.06 | 811 | 794 | 152.5 |
| C | 7 | 221 | 183545 | 1015.88 | 772 | 777 | 179.9 |
| C | 14 | 238 | 122040 | 674.01 | 772 | 777 | 179.9 |
| C | 13 | 61 | 5311 | 25.2 | 772 | 777 | 179.9 |
| D | 1 | 20 | 1290893 | 7000.3 | 763 | 742 | 184.3 |
| D | 1 | 52 | 562338 | 3047.19 | 763 | 742 | 184.3 |
| D | 7 | 223 | 200520 | 1083.98 | 763 | 742 | 184.3 |
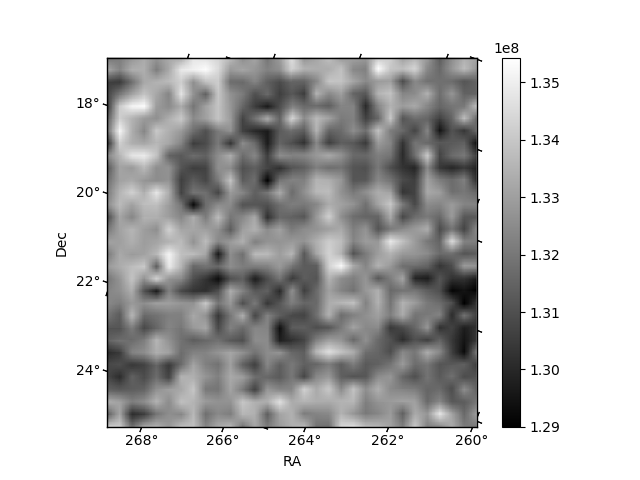
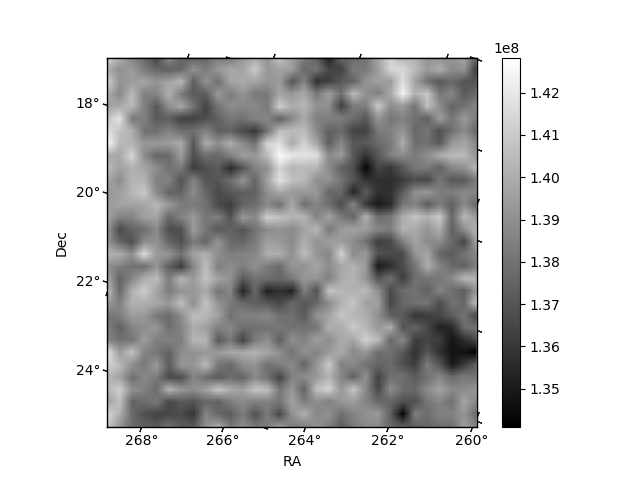
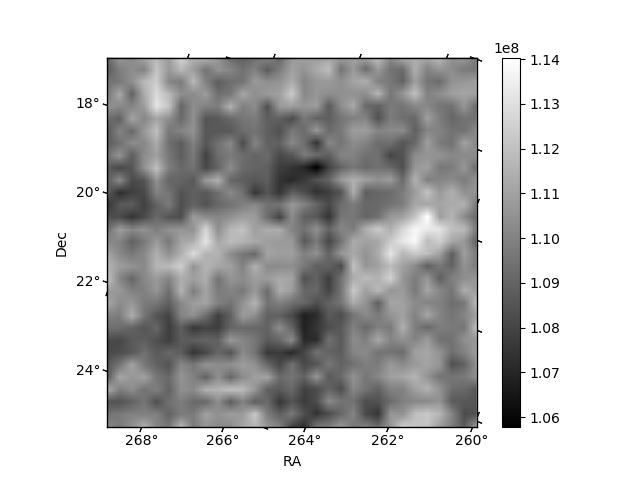
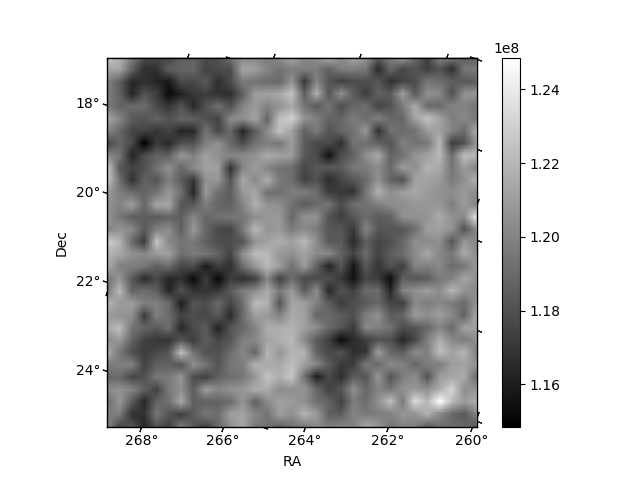
Histogram calculated using DETX and DETY for each event in the final _common_clean file
| Quadrant A | 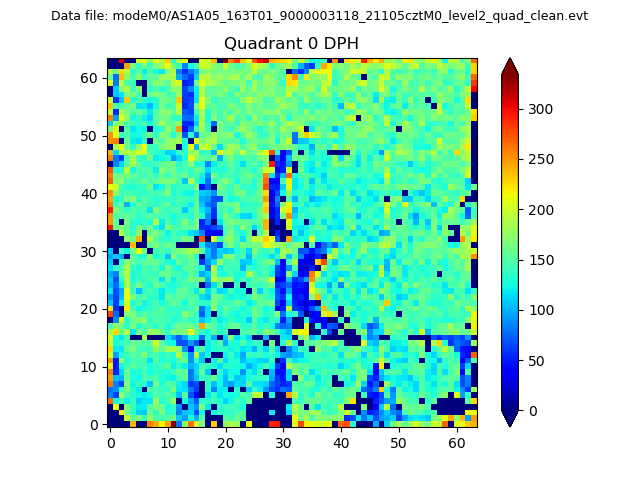 |
 |
Quadrant B |
|---|---|---|---|
| Quadrant D |  |
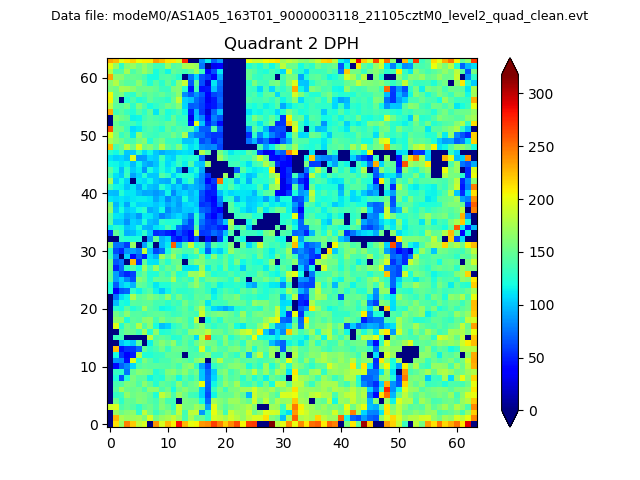 |
Quadrant C |
| Plot type | Count rate plots | Images |
|---|---|---|
| Comparison with Poisson distribution Blue bars denote a histogram of data divided into 1 sec bins. Red curve is a Poisson curve with rate = median count rate of data. |
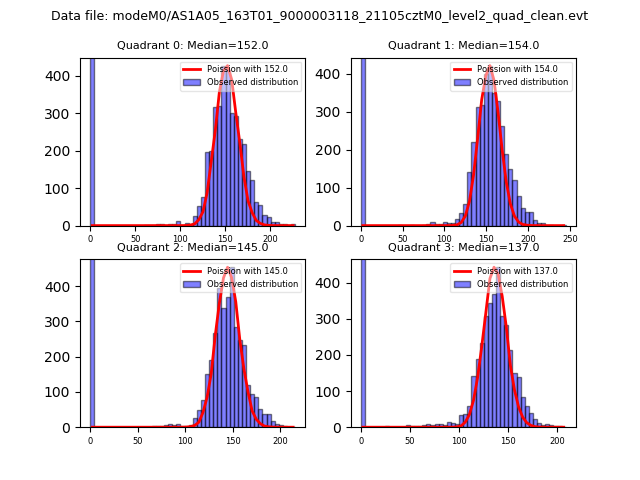 |
 |
| Quadrant-wise count rates Data is divided into 100 sec bins |
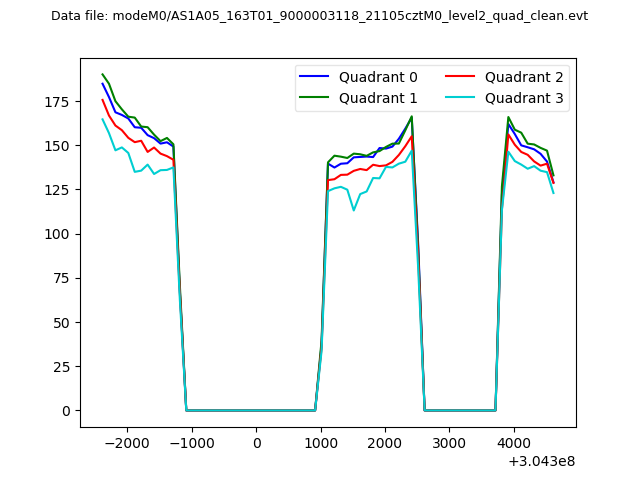 |
|
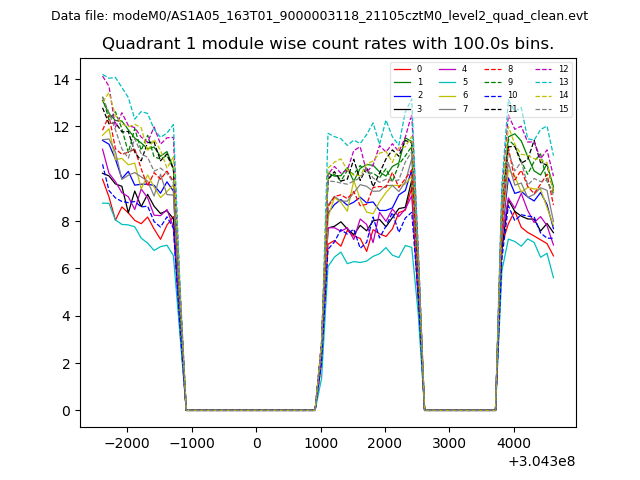
| Module-wise count rates for Quadrant A Data is divided into 100 sec bins |
 |
 |
| Module-wise count rates for Quadrant B Data is divided into 100 sec bins |
 |
 |
| Module-wise count rates for Quadrant C Data is divided into 100 sec bins |
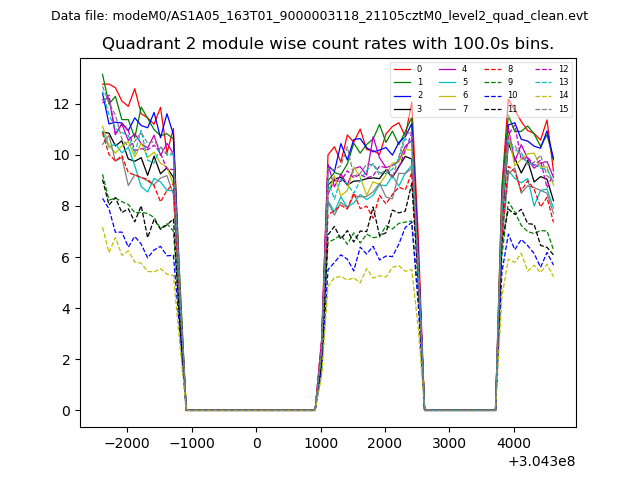 |
 |
| Module-wise count rates for Quadrant D Data is divided into 100 sec bins |
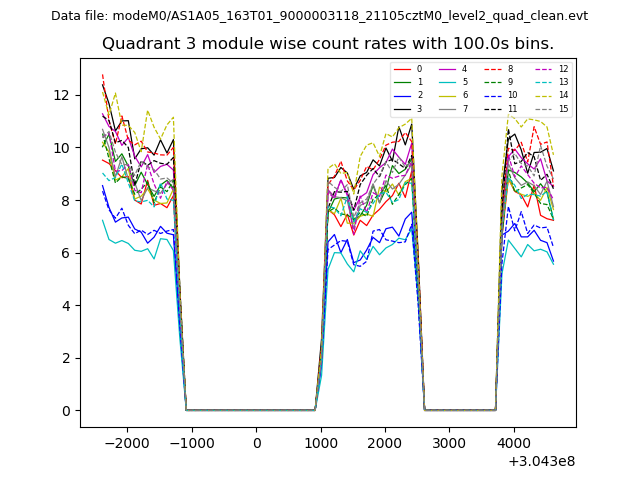 |
 |
| Parameter | Plot |
|---|---|
| CZT HV Monitor |  |
| D_VDD | 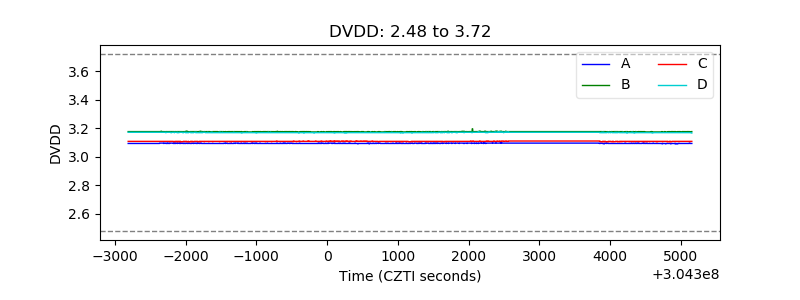 |
| Temperature 1 | 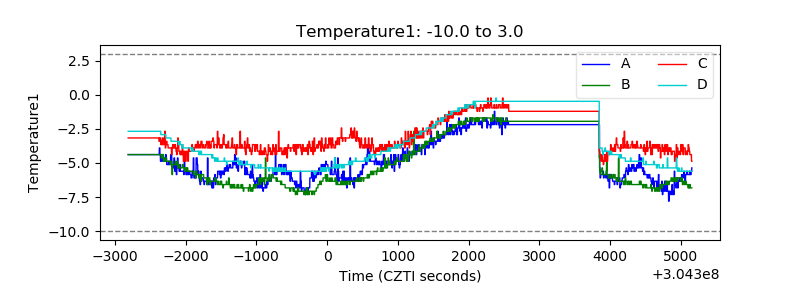 |
| Veto HV Monitor | 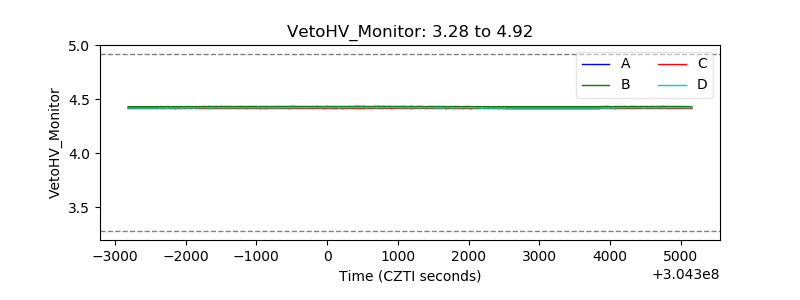 |
| Veto LLD | 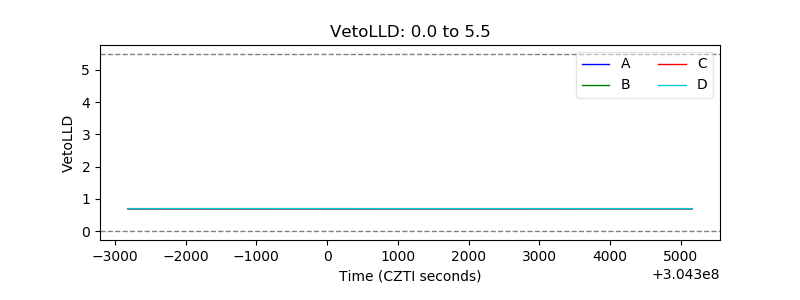 |
| Alpha Counter | 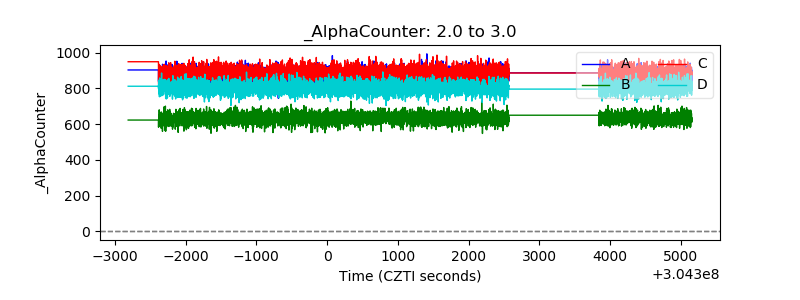 |
| _CPM_Rate | 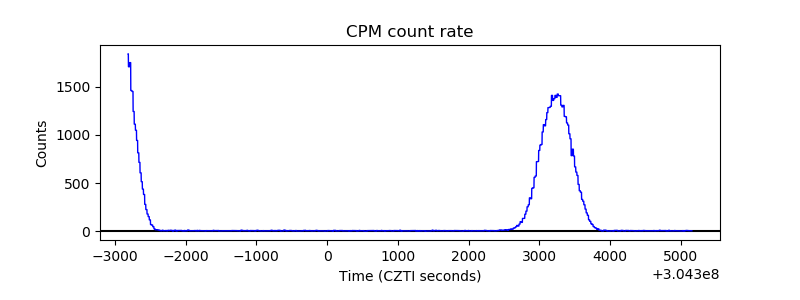 |
| CZT Counter | 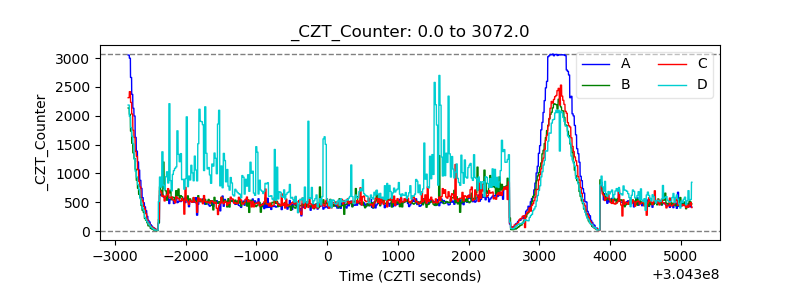 |
| +2.5 Volts monitor |  |
| +5 Volts monitor | 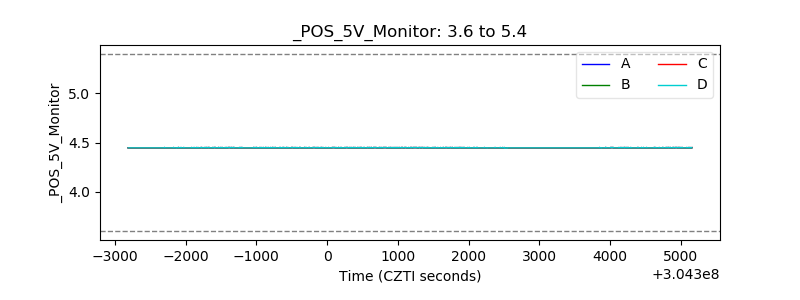 |
| _ROLL_ROT | 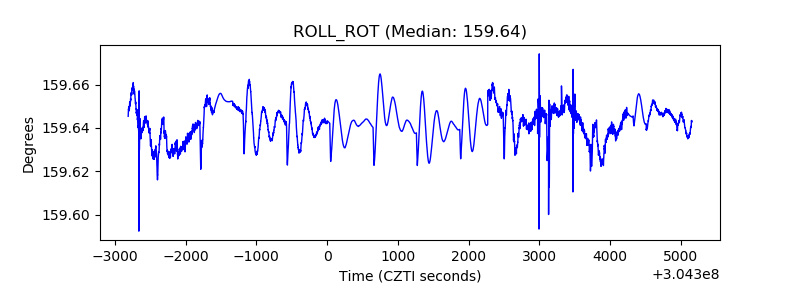 |
| _Roll_DEC | 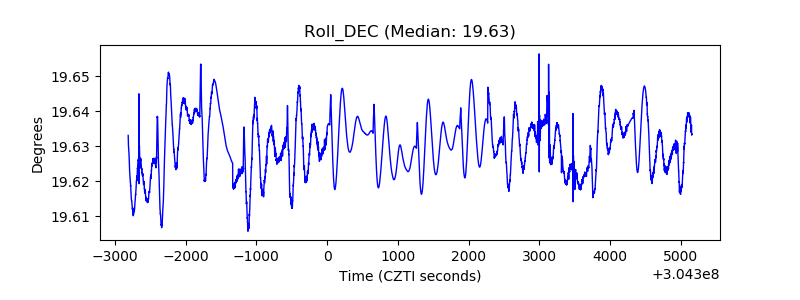 |
| _Roll_RA | 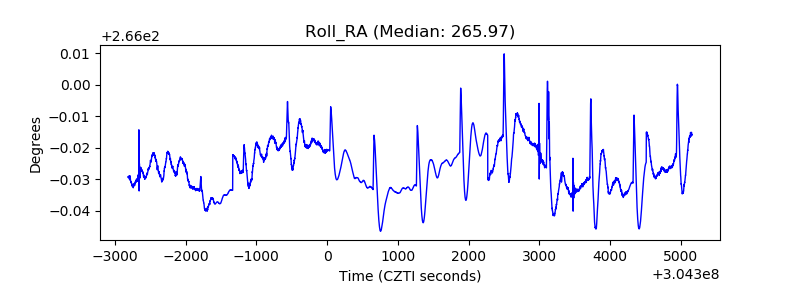 |
| Veto Counter | 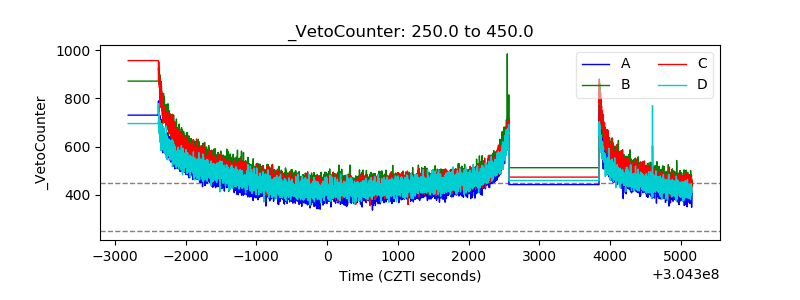 |