| Param | Original file | Final file |
|---|---|---|
| Filename | modeM0/AS1A05_163T01_9000003118_21106cztM0_level2.evt | modeM0/AS1A05_163T01_9000003118_21106cztM0_level2_quad_clean.evt |
| Size (bytes) | 503,844,480 | 79,346,880 |
| Size | 480.5 MB | 75.7 MB |
| Events in quadrant A | 3,263,352 | 497,726 |
| Events in quadrant B | 3,605,159 | 502,743 |
| Events in quadrant C | 3,255,714 | 479,488 |
| Events in quadrant D | 4,686,882 | 462,527 |
| Mode M9 | |||
|---|---|---|---|
| Quadrant | BADHDUFLAG | Total packets | Discarded packets |
| A | 0 | 14 | 0 |
| B | 0 | 15 | 0 |
| C | 0 | 15 | 0 |
| D | 0 | 15 | 0 |
| Mode M0 | |||
|---|---|---|---|
| Quadrant | BADHDUFLAG | Total packets | Discarded packets |
| A | 0 | 13731 | 2 |
| B | 0 | 14905 | 2 |
| C | 0 | 13638 | 2 |
| D | 0 | 18326 | 2 |
| Mode SS | |||
|---|---|---|---|
| Quadrant | BADHDUFLAG | Total packets | Discarded packets |
| A | 0 | 134 | 0 |
| B | 0 | 134 | 0 |
| C | 0 | 134 | 0 |
| D | 0 | 134 | 0 |
| Quadrant | Total seconds | Saturated seconds | Saturation percentage |
|---|---|---|---|
| A | 6599 | 51 | 0.772844% |
| B | 6599 | 125 | 1.894226% |
| C | 6599 | 71 | 1.075921% |
| D | 6598 | 267 | 4.046681% |
Noise dominated data is calculated using 1-second bins in cleaned event files. If a bin has >2000 counts, and if more than 50% of those come from <1% of pixels, then it is considered to be noise-dominated and hence unusable.
| Quadrant | # 1 sec bins | Bins with >0 counts | Bins with >2000 counts | High rate bins dominated by noise | Noise dominated (total time) | Noise dominated (detector-on time) | Marked lightcurve |
|---|---|---|---|---|---|---|---|
| A | 7609 | 6600 | 3 | 3 | 0.04% | 0.05% | 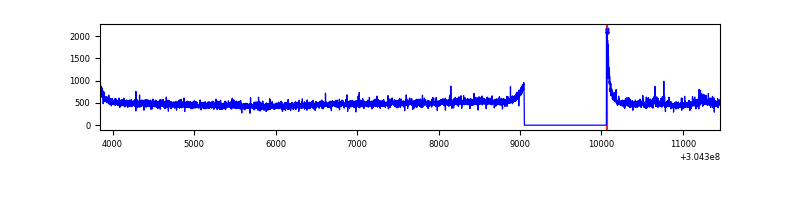 |
| B | 7609 | 6600 | 20 | 20 | 0.26% | 0.30% | 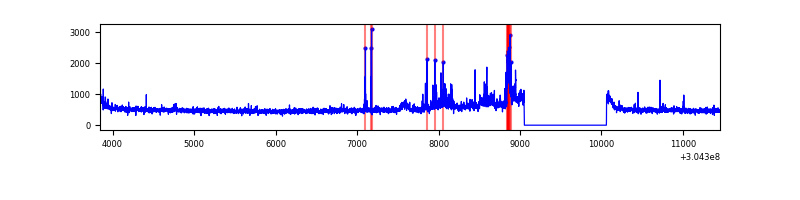 |
| C | 7609 | 6600 | 1 | 1 | 0.01% | 0.02% | 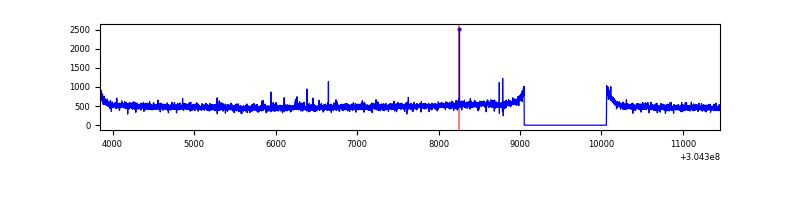 |
| D | 7608 | 6599 | 231 | 231 | 3.04% | 3.50% | 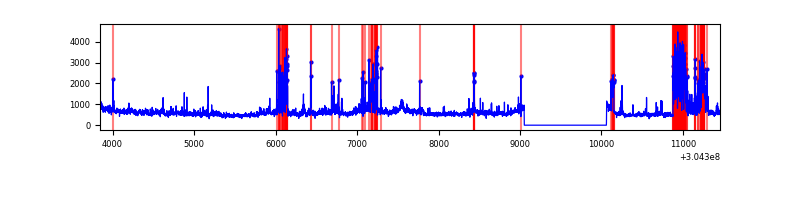 |
Top three noisy pixels from each quadrant. If the there are fewer than three noisy pixels in the level2.evt file, extra rows are filled as -1
| Pixel properties | Quadrant properties | ||||||
|---|---|---|---|---|---|---|---|
| Quadrant | DetID | PixID | Counts | Sigma | Mean | Median | Sigma |
| A | 13 | 34 | 83408 | 494.59 | 825 | 810 | 167.0 |
| A | 13 | 254 | 10534 | 58.23 | 825 | 810 | 167.0 |
| A | 0 | 226 | 7049 | 37.36 | 825 | 810 | 167.0 |
| B | 0 | 182 | 185175 | 1177.18 | 827 | 807 | 156.6 |
| B | 0 | 228 | 71454 | 451.08 | 827 | 807 | 156.6 |
| B | 7 | 220 | 33624 | 209.53 | 827 | 807 | 156.6 |
| C | 14 | 238 | 124623 | 661.53 | 793 | 799 | 187.2 |
| C | 7 | 221 | 28772 | 149.45 | 793 | 799 | 187.2 |
| C | 9 | 54 | 13941 | 70.21 | 793 | 799 | 187.2 |
| D | 1 | 20 | 651246 | 3425.03 | 785 | 765 | 189.9 |
| D | 10 | 199 | 549139 | 2887.4 | 785 | 765 | 189.9 |
| D | 13 | 153 | 188046 | 986.11 | 785 | 765 | 189.9 |
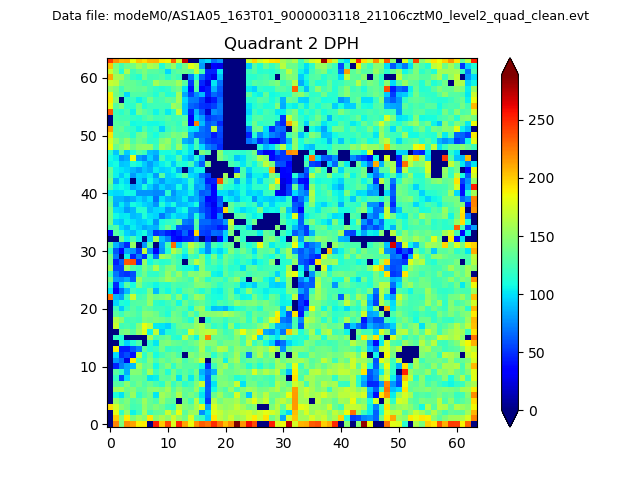
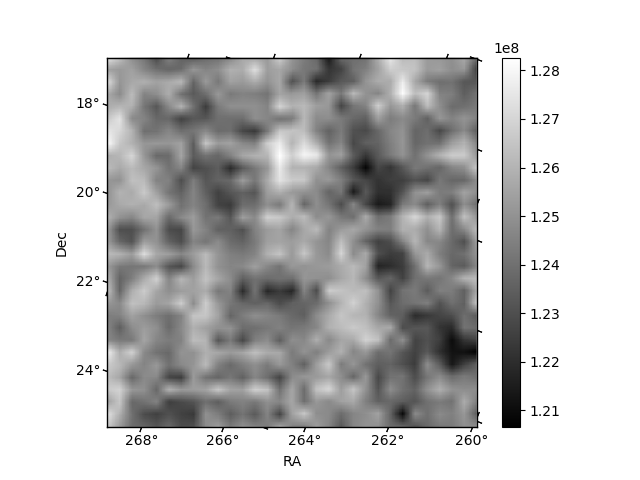
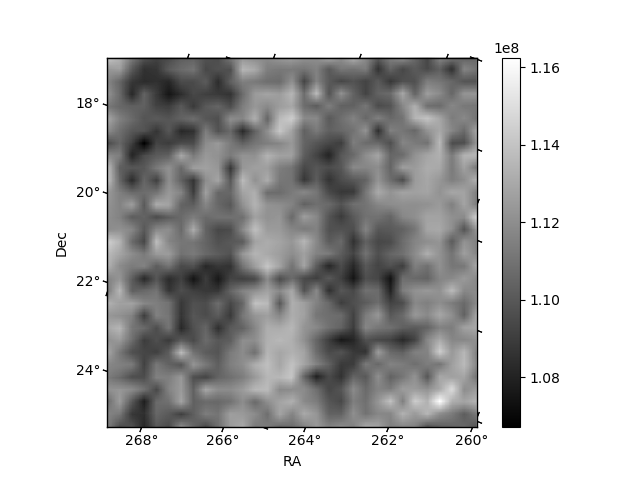
Histogram calculated using DETX and DETY for each event in the final _common_clean file
| Quadrant A | 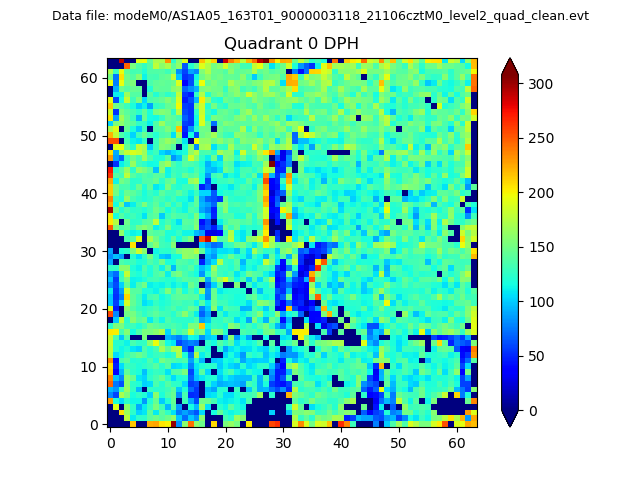 |
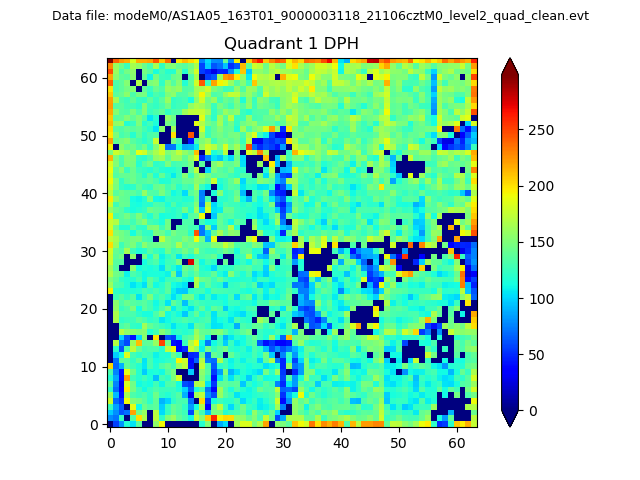 |
Quadrant B |
|---|---|---|---|
| Quadrant D | 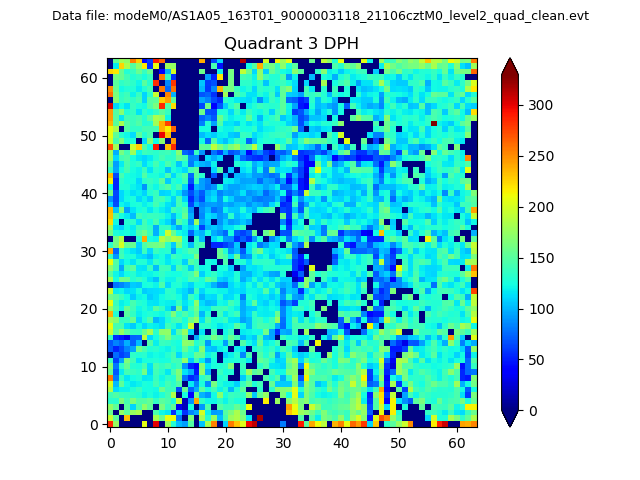 |
 |
Quadrant C |
| Plot type | Count rate plots | Images |
|---|---|---|
| Comparison with Poisson distribution Blue bars denote a histogram of data divided into 1 sec bins. Red curve is a Poisson curve with rate = median count rate of data. |
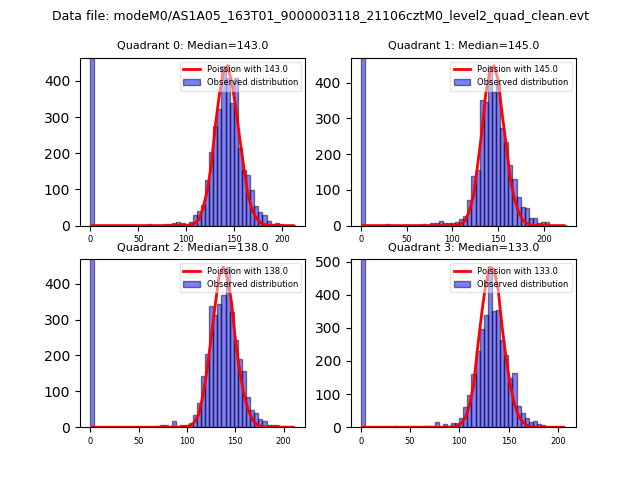 |
 |
| Quadrant-wise count rates Data is divided into 100 sec bins |
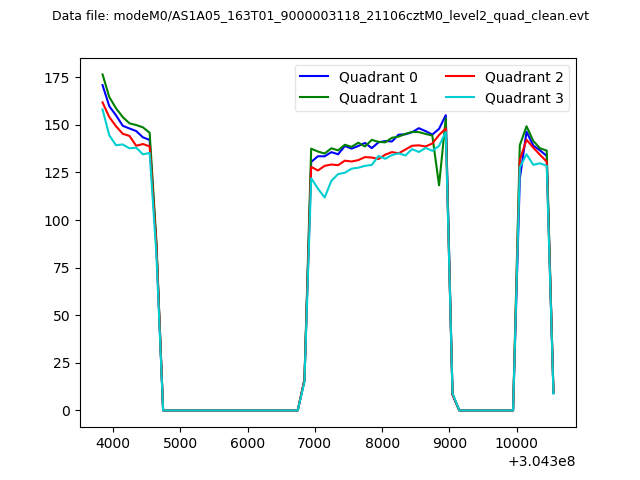 |
|
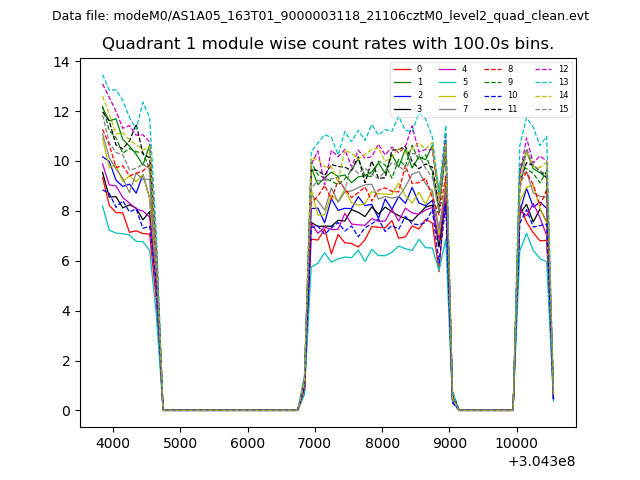
| Module-wise count rates for Quadrant A Data is divided into 100 sec bins |
 |
 |
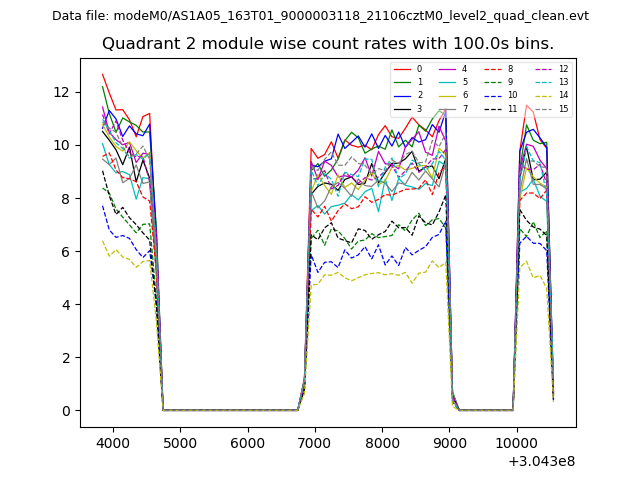
| Module-wise count rates for Quadrant B Data is divided into 100 sec bins |
 |
 |
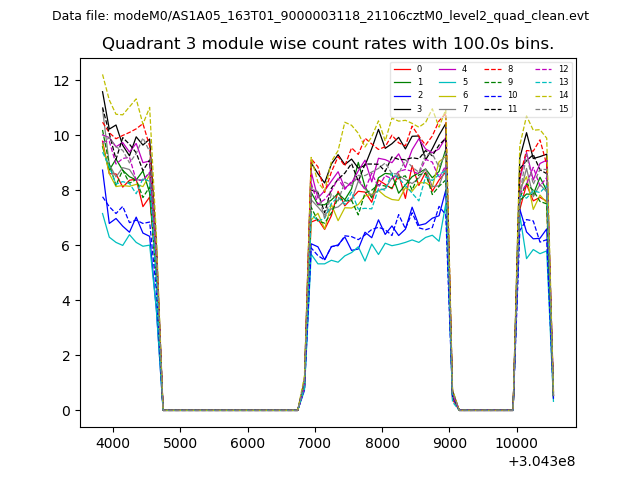
| Module-wise count rates for Quadrant C Data is divided into 100 sec bins |
 |
 |
| Module-wise count rates for Quadrant D Data is divided into 100 sec bins |
 |
 |
| Parameter | Plot |
|---|---|
| CZT HV Monitor | 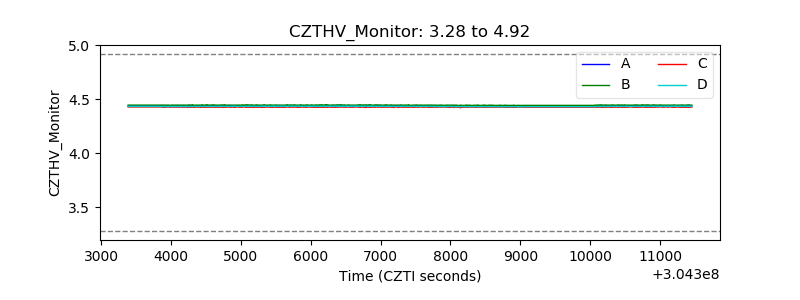 |
| D_VDD | 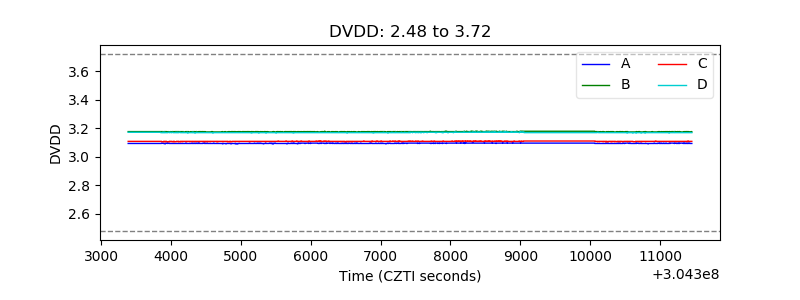 |
| Temperature 1 | 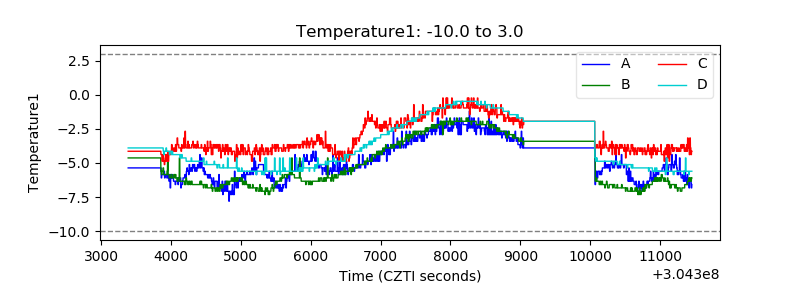 |
| Veto HV Monitor | 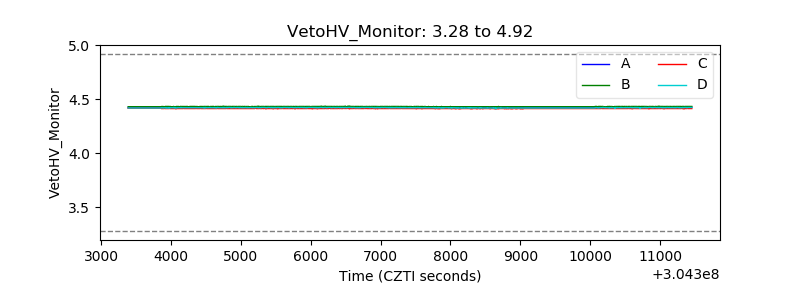 |
| Veto LLD | 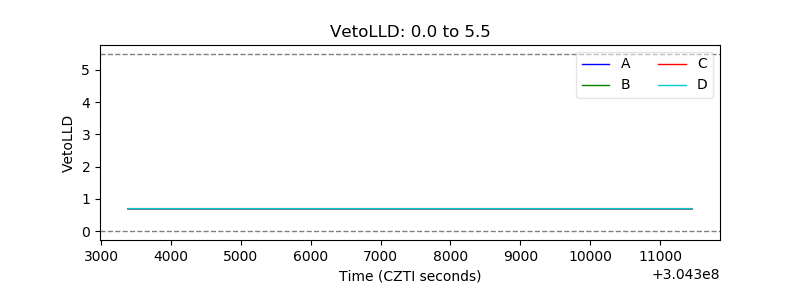 |
| Alpha Counter | 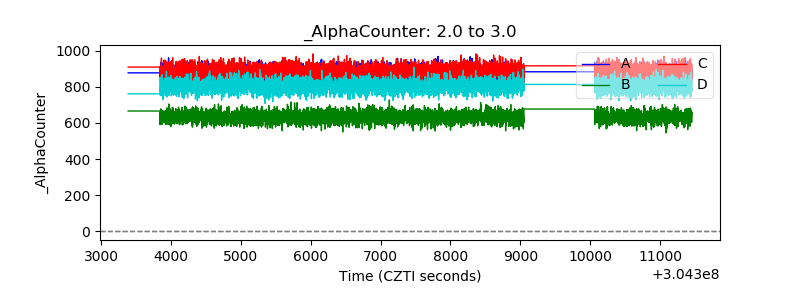 |
| _CPM_Rate | 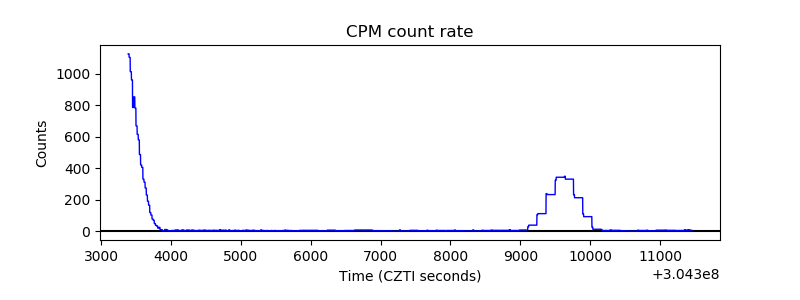 |
| CZT Counter | 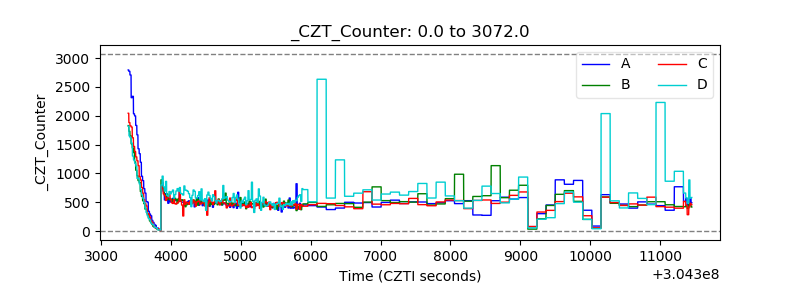 |
| +2.5 Volts monitor |  |
| +5 Volts monitor | 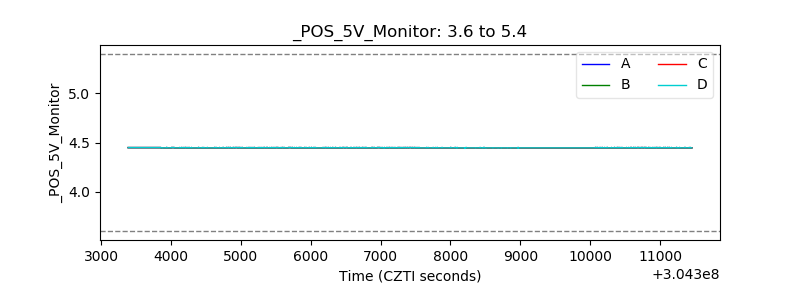 |
| _ROLL_ROT | 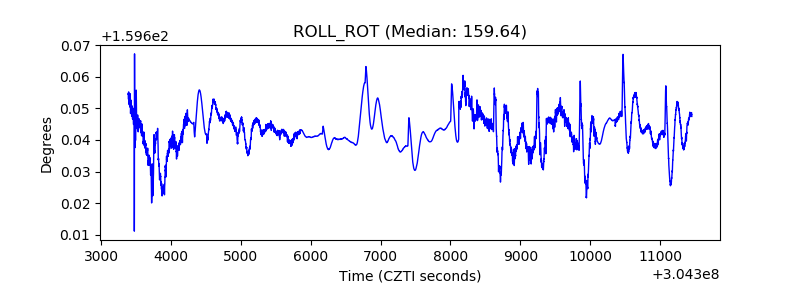 |
| _Roll_DEC | 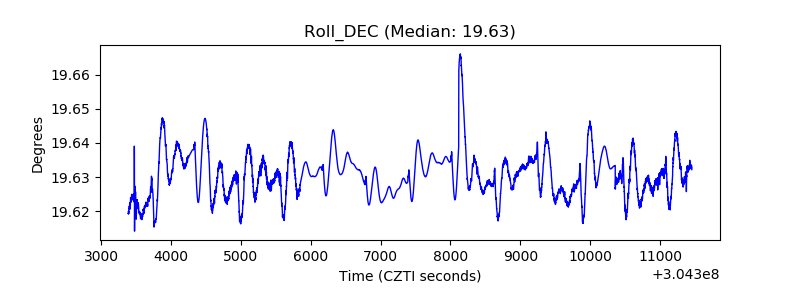 |
| _Roll_RA | 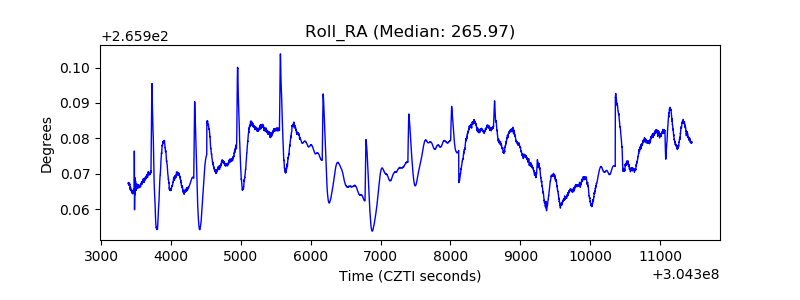 |
| Veto Counter | 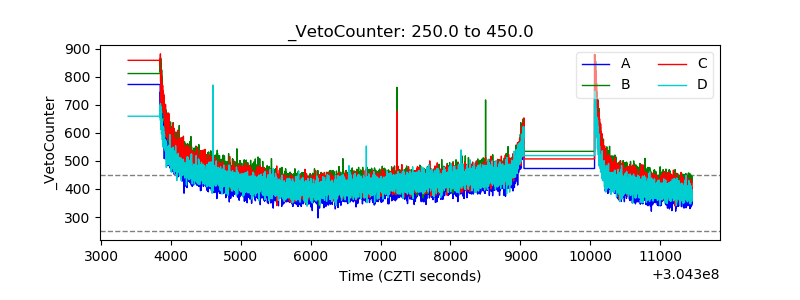 |