| Param | Original file | Final file |
|---|---|---|
| Filename | modeM0/AS1A05_163T01_9000003118_21107cztM0_level2.evt | modeM0/AS1A05_163T01_9000003118_21107cztM0_level2_quad_clean.evt |
| Size (bytes) | 579,116,160 | 70,937,280 |
| Size | 552.3 MB | 67.7 MB |
| Events in quadrant A | 3,515,200 | 441,134 |
| Events in quadrant B | 4,961,150 | 416,042 |
| Events in quadrant C | 3,213,616 | 425,269 |
| Events in quadrant D | 5,393,773 | 397,101 |
| Mode M9 | |||
|---|---|---|---|
| Quadrant | BADHDUFLAG | Total packets | Discarded packets |
| A | 0 | 6 | 0 |
| B | 0 | 6 | 0 |
| C | 0 | 6 | 0 |
| D | 0 | 6 | 0 |
| Mode M0 | |||
|---|---|---|---|
| Quadrant | BADHDUFLAG | Total packets | Discarded packets |
| A | 0 | 14716 | 1 |
| B | 0 | 19089 | 1 |
| C | 0 | 13788 | 1 |
| D | 0 | 20406 | 1 |
| Mode SS | |||
|---|---|---|---|
| Quadrant | BADHDUFLAG | Total packets | Discarded packets |
| A | 0 | 138 | 0 |
| B | 0 | 138 | 0 |
| C | 0 | 138 | 0 |
| D | 0 | 138 | 0 |
| Quadrant | Total seconds | Saturated seconds | Saturation percentage |
|---|---|---|---|
| A | 6712 | 80 | 1.191895% |
| B | 6712 | 600 | 8.939213% |
| C | 6712 | 98 | 1.460072% |
| D | 6712 | 548 | 8.164482% |
Noise dominated data is calculated using 1-second bins in cleaned event files. If a bin has >2000 counts, and if more than 50% of those come from <1% of pixels, then it is considered to be noise-dominated and hence unusable.
| Quadrant | # 1 sec bins | Bins with >0 counts | Bins with >2000 counts | High rate bins dominated by noise | Noise dominated (total time) | Noise dominated (detector-on time) | Marked lightcurve |
|---|---|---|---|---|---|---|---|
| A | 7302 | 6714 | 0 | 0 | 0.00% | 0.00% | 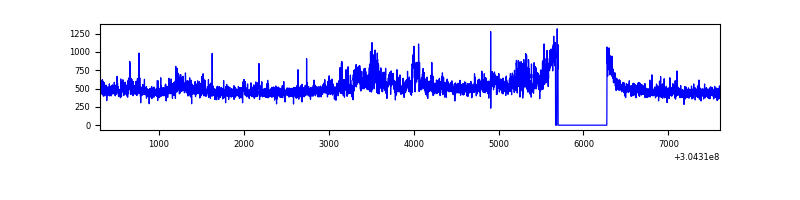 |
| B | 7302 | 6714 | 259 | 259 | 3.55% | 3.86% | 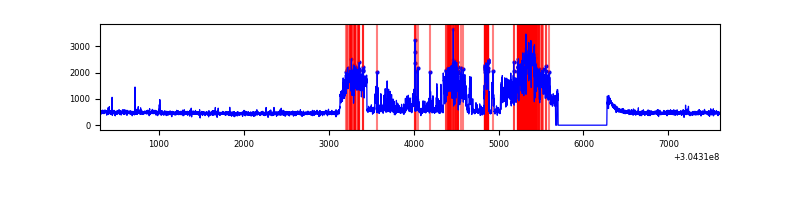 |
| C | 7302 | 6714 | 0 | 0 | 0.00% | 0.00% | 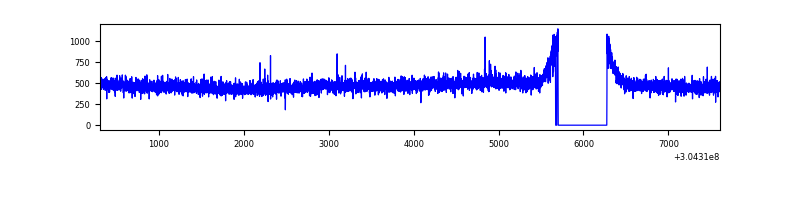 |
| D | 7302 | 6714 | 460 | 460 | 6.30% | 6.85% | 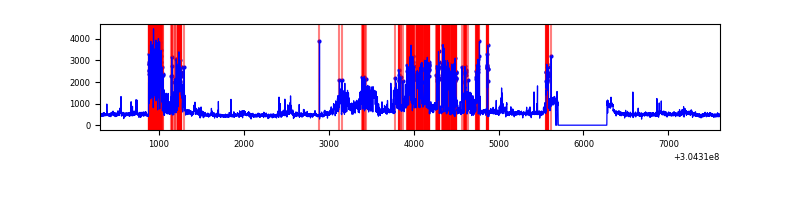 |
Top three noisy pixels from each quadrant. If the there are fewer than three noisy pixels in the level2.evt file, extra rows are filled as -1
| Pixel properties | Quadrant properties | ||||||
|---|---|---|---|---|---|---|---|
| Quadrant | DetID | PixID | Counts | Sigma | Mean | Median | Sigma |
| A | 13 | 34 | 343729 | 2053.51 | 822 | 804 | 167.0 |
| A | 13 | 254 | 10215 | 56.36 | 822 | 804 | 167.0 |
| A | 0 | 226 | 6933 | 36.7 | 822 | 804 | 167.0 |
| B | 0 | 182 | 1700206 | 10947.88 | 803 | 783 | 155.2 |
| B | 7 | 220 | 34085 | 214.54 | 803 | 783 | 155.2 |
| B | 0 | 219 | 20316 | 125.83 | 803 | 783 | 155.2 |
| C | 14 | 238 | 122091 | 651.13 | 789 | 794 | 186.3 |
| C | 7 | 221 | 18461 | 94.84 | 789 | 794 | 186.3 |
| C | 13 | 61 | 5404 | 24.75 | 789 | 794 | 186.3 |
| D | 10 | 199 | 670160 | 3548.08 | 776 | 755 | 188.7 |
| D | 1 | 52 | 626167 | 3314.9 | 776 | 755 | 188.7 |
| D | 1 | 20 | 525111 | 2779.27 | 776 | 755 | 188.7 |
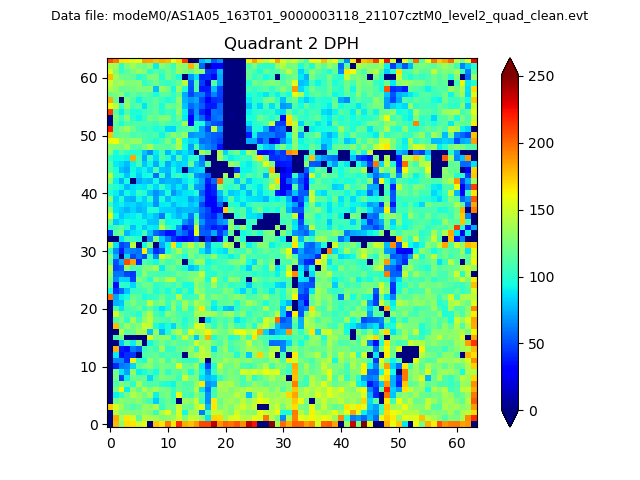
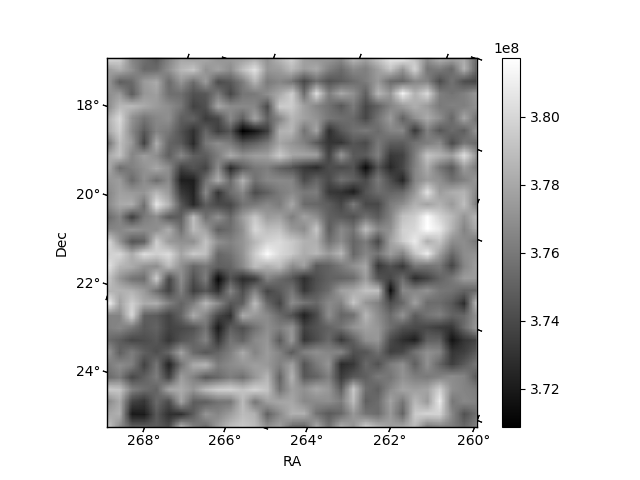
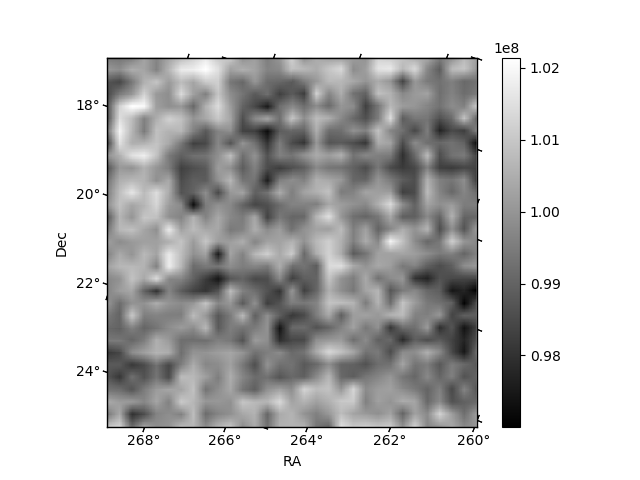
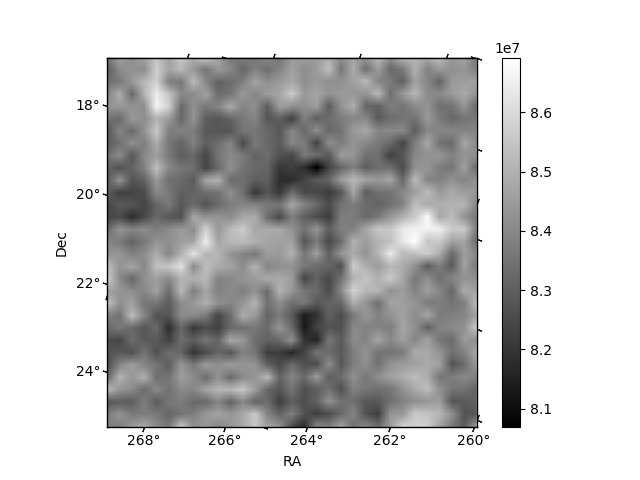
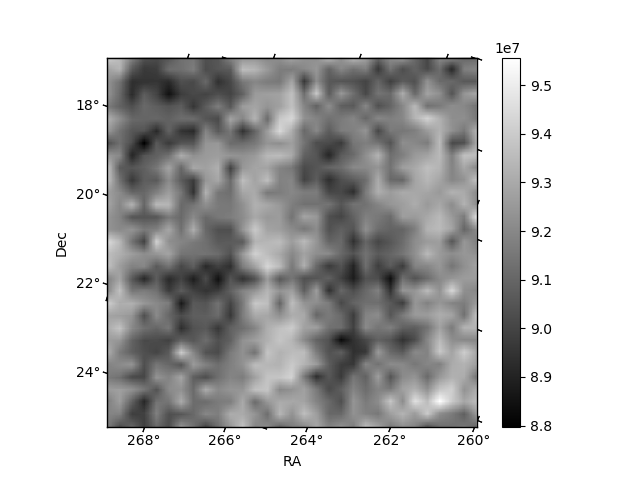
Histogram calculated using DETX and DETY for each event in the final _common_clean file
| Quadrant A | 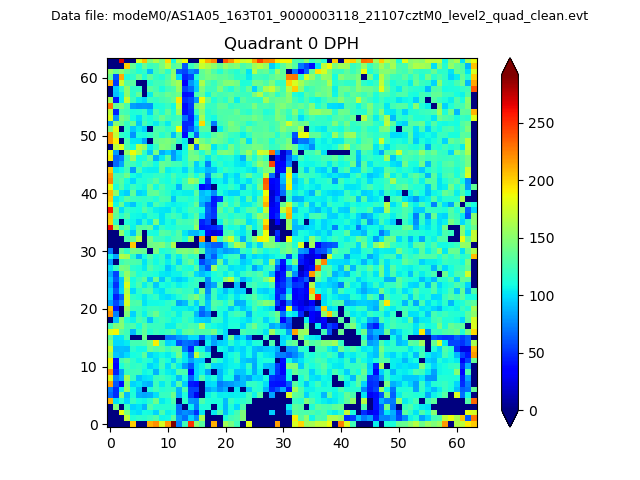 |
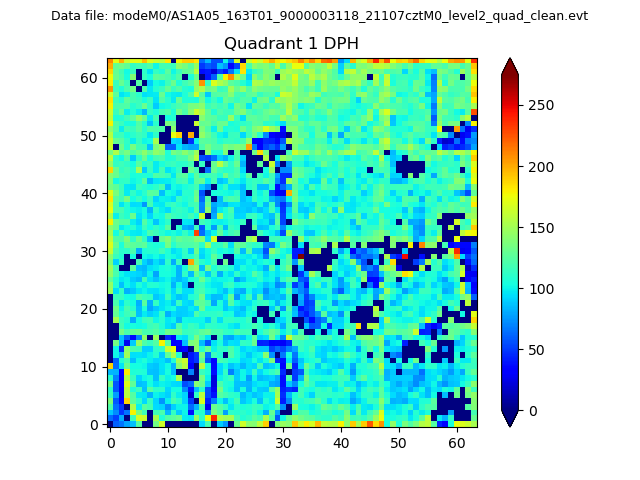 |
Quadrant B |
|---|---|---|---|
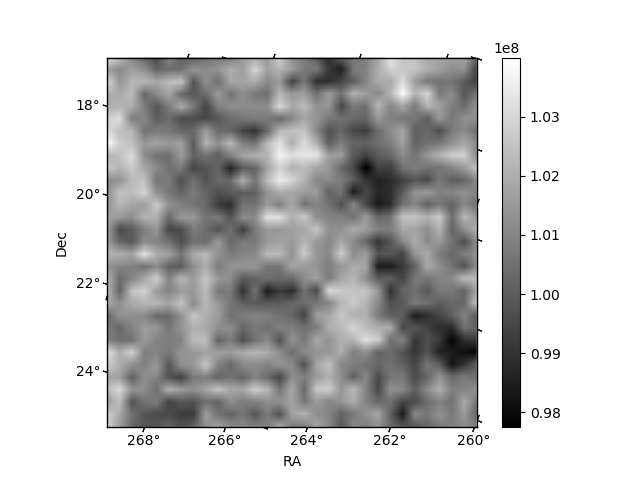
| Quadrant D | 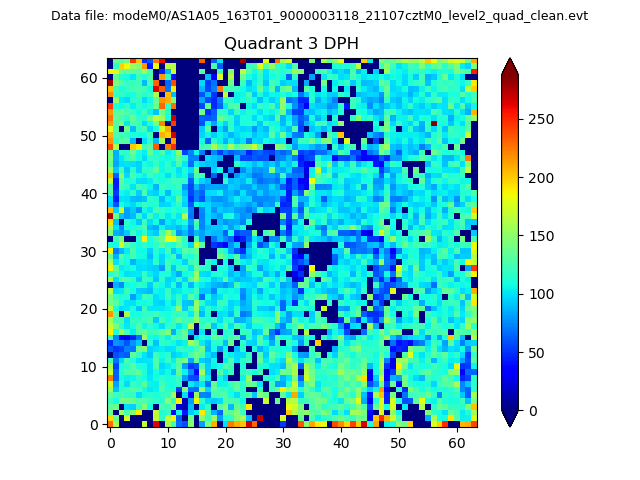 |
 |
Quadrant C |
| Plot type | Count rate plots | Images |
|---|---|---|
| Comparison with Poisson distribution Blue bars denote a histogram of data divided into 1 sec bins. Red curve is a Poisson curve with rate = median count rate of data. |
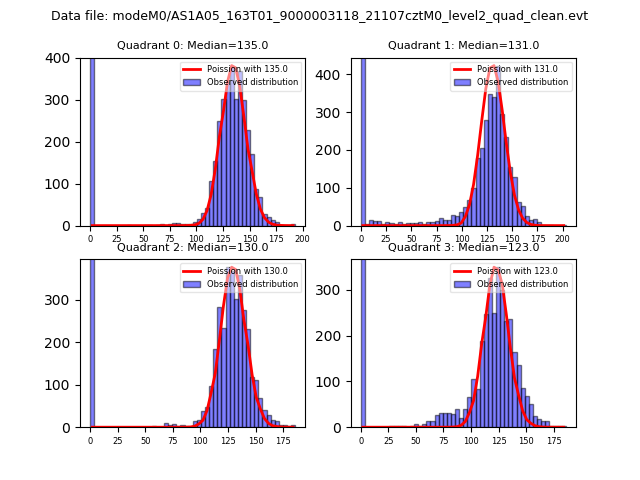 |
 |
| Quadrant-wise count rates Data is divided into 100 sec bins |
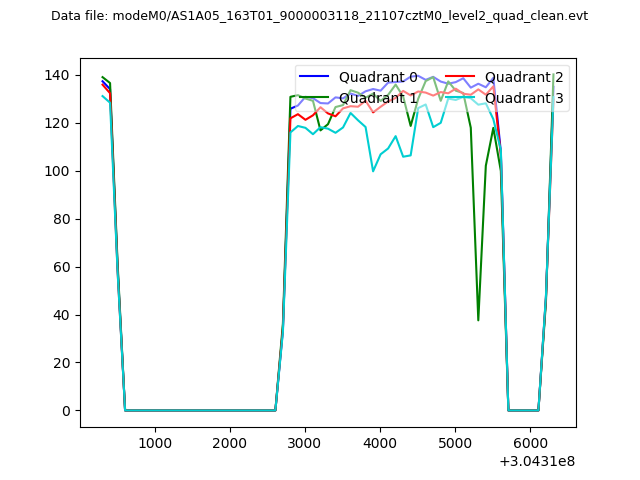 |
|
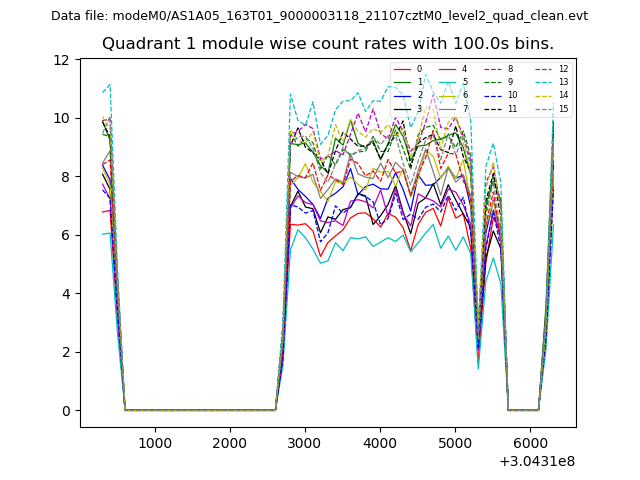
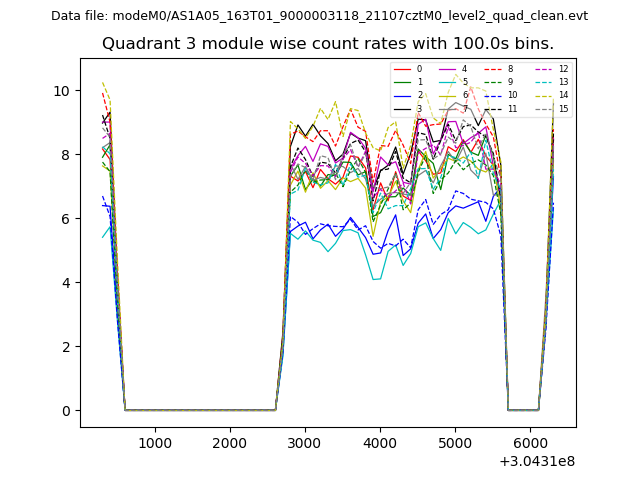
| Module-wise count rates for Quadrant A Data is divided into 100 sec bins |
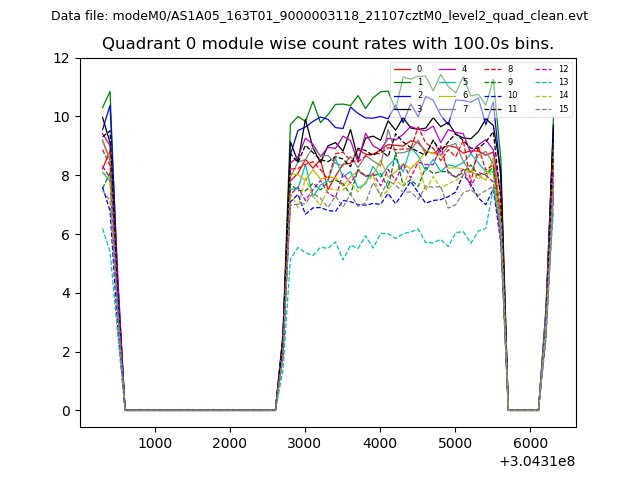 |
 |
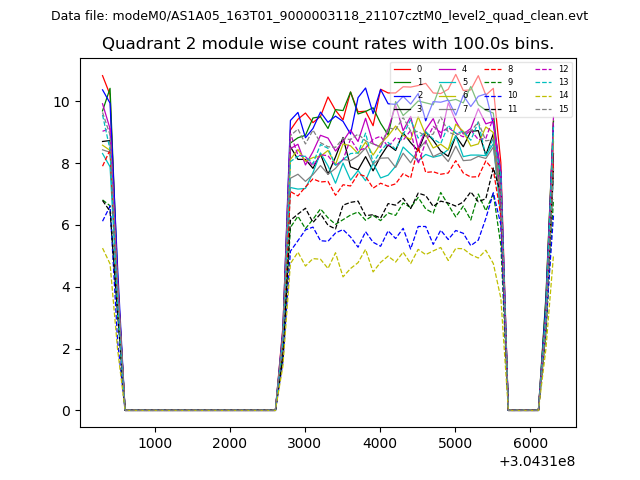
| Module-wise count rates for Quadrant B Data is divided into 100 sec bins |
 |
 |
| Module-wise count rates for Quadrant C Data is divided into 100 sec bins |
 |
 |
| Module-wise count rates for Quadrant D Data is divided into 100 sec bins |
 |
 |
| Parameter | Plot |
|---|---|
| CZT HV Monitor | 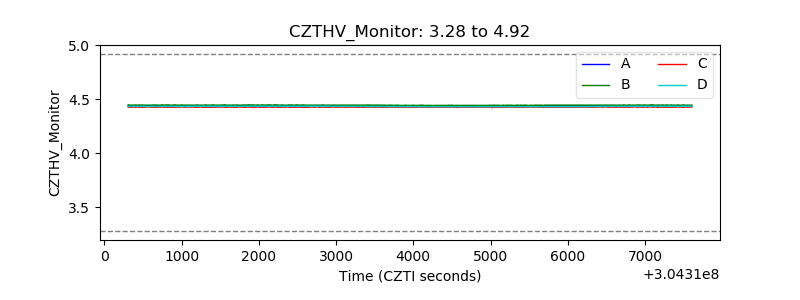 |
| D_VDD | 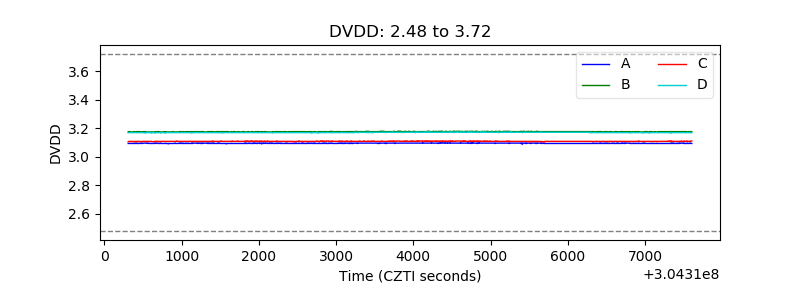 |
| Temperature 1 | 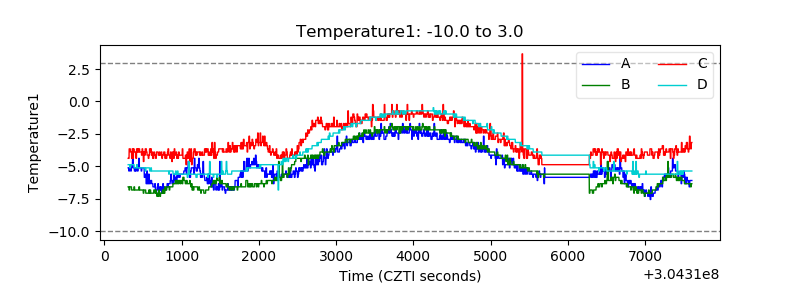 |
| Veto HV Monitor |  |
| Veto LLD | 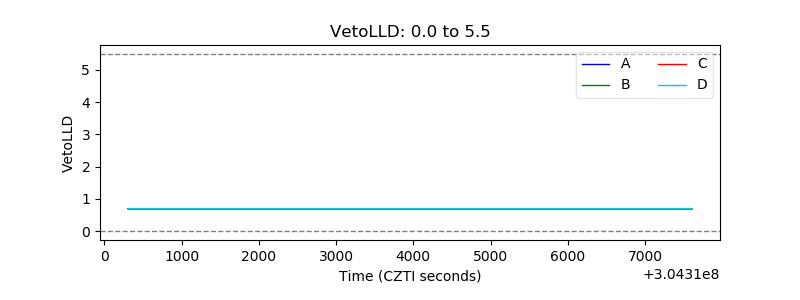 |
| Alpha Counter | 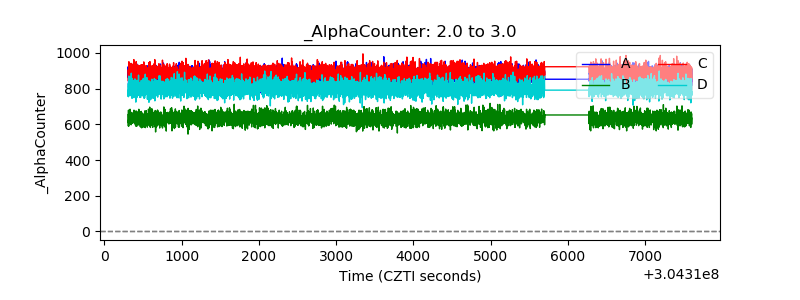 |
| _CPM_Rate | 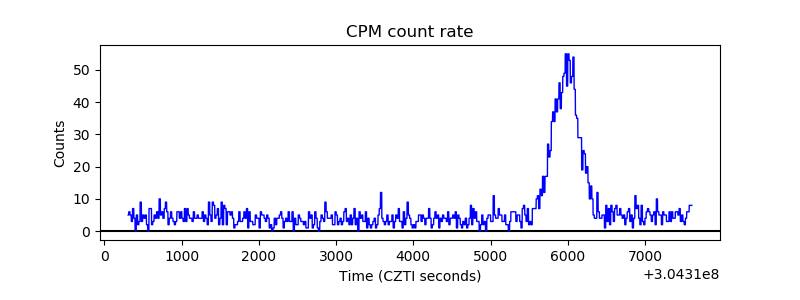 |
| CZT Counter | 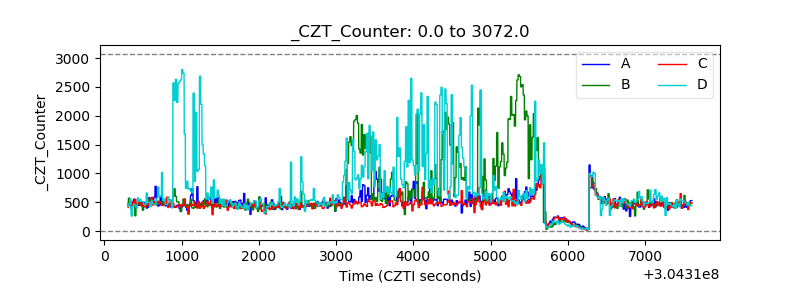 |
| +2.5 Volts monitor |  |
| +5 Volts monitor |  |
| _ROLL_ROT | 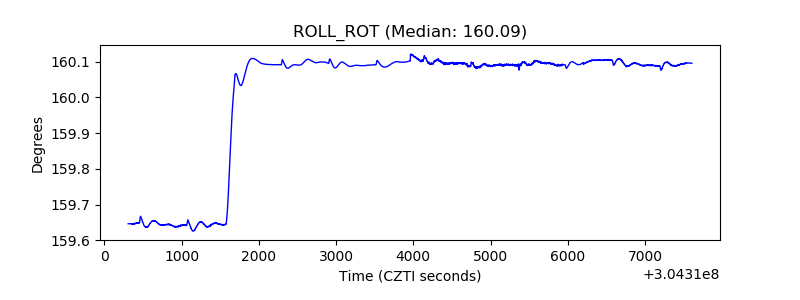 |
| _Roll_DEC | 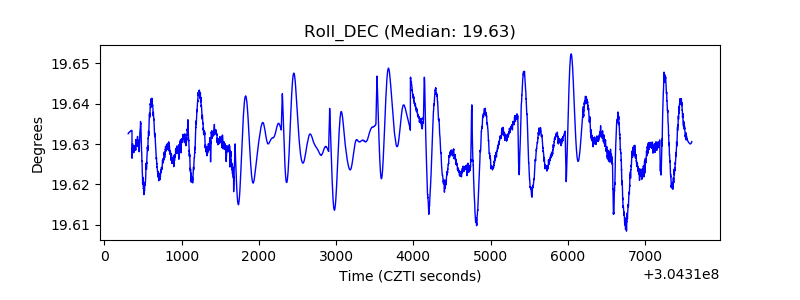 |
| _Roll_RA | 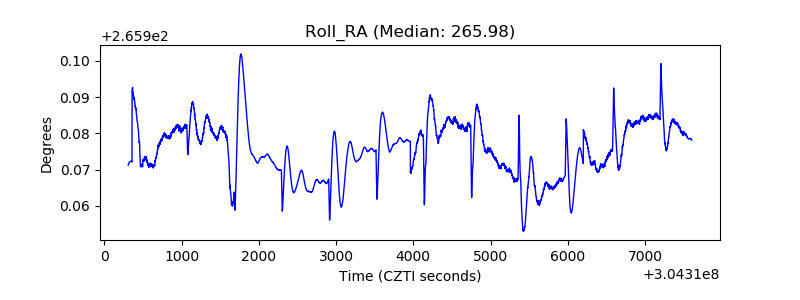 |
| Veto Counter | 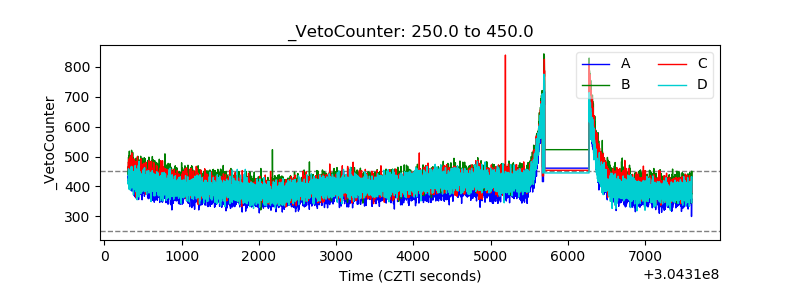 |