| Param | Original file | Final file |
|---|---|---|
| Filename | modeM0/AS1A05_163T01_9000003118_21108cztM0_level2.evt | modeM0/AS1A05_163T01_9000003118_21108cztM0_level2_quad_clean.evt |
| Size (bytes) | 679,173,120 | 99,768,960 |
| Size | 647.7 MB | 95.1 MB |
| Events in quadrant A | 4,278,976 | 626,342 |
| Events in quadrant B | 5,332,660 | 606,720 |
| Events in quadrant C | 4,220,450 | 607,035 |
| Events in quadrant D | 6,153,901 | 583,434 |
| Mode M9 | |||
|---|---|---|---|
| Quadrant | BADHDUFLAG | Total packets | Discarded packets |
| A | 0 | 8 | 0 |
| B | 0 | 8 | 0 |
| C | 0 | 8 | 0 |
| D | 0 | 8 | 0 |
| Mode M0 | |||
|---|---|---|---|
| Quadrant | BADHDUFLAG | Total packets | Discarded packets |
| A | 0 | 18314 | 2 |
| B | 0 | 21202 | 2 |
| C | 0 | 18015 | 3 |
| D | 0 | 24246 | 2 |
| Mode SS | |||
|---|---|---|---|
| Quadrant | BADHDUFLAG | Total packets | Discarded packets |
| A | 0 | 178 | 0 |
| B | 0 | 178 | 0 |
| C | 0 | 178 | 0 |
| D | 0 | 178 | 0 |
| Quadrant | Total seconds | Saturated seconds | Saturation percentage |
|---|---|---|---|
| A | 8603 | 270 | 3.138440% |
| B | 8604 | 689 | 8.007903% |
| C | 8603 | 290 | 3.370917% |
| D | 8603 | 291 | 3.382541% |
Noise dominated data is calculated using 1-second bins in cleaned event files. If a bin has >2000 counts, and if more than 50% of those come from <1% of pixels, then it is considered to be noise-dominated and hence unusable.
| Quadrant | # 1 sec bins | Bins with >0 counts | Bins with >2000 counts | High rate bins dominated by noise | Noise dominated (total time) | Noise dominated (detector-on time) | Marked lightcurve |
|---|---|---|---|---|---|---|---|
| A | 9378 | 8606 | 0 | 0 | 0.00% | 0.00% | 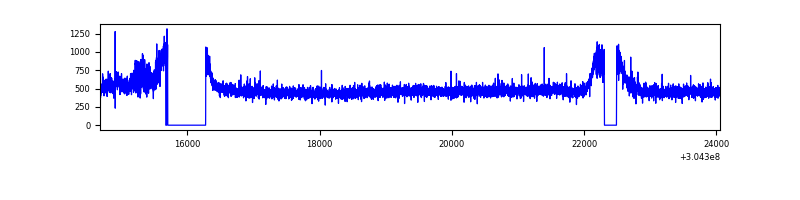 |
| B | 9379 | 8606 | 220 | 220 | 2.35% | 2.56% | 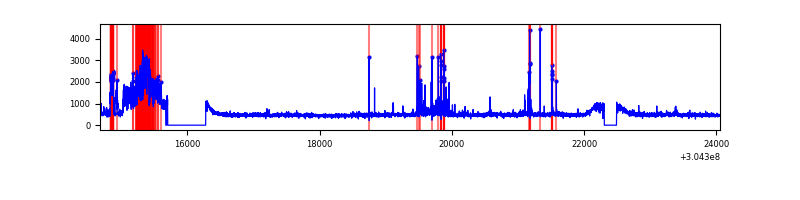 |
| C | 9378 | 8606 | 0 | 0 | 0.00% | 0.00% | 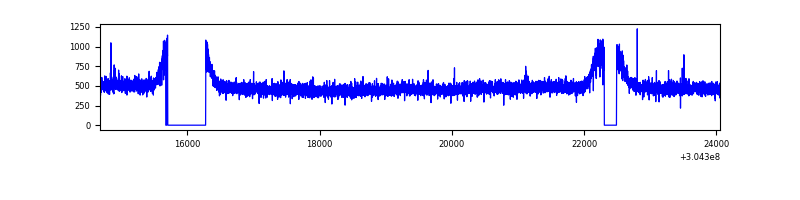 |
| D | 9378 | 8606 | 49 | 49 | 0.52% | 0.57% | 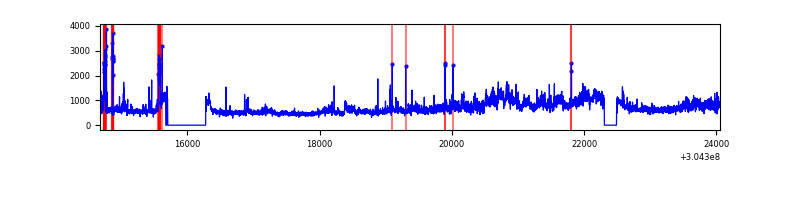 |
Top three noisy pixels from each quadrant. If the there are fewer than three noisy pixels in the level2.evt file, extra rows are filled as -1
| Pixel properties | Quadrant properties | ||||||
|---|---|---|---|---|---|---|---|
| Quadrant | DetID | PixID | Counts | Sigma | Mean | Median | Sigma |
| A | 13 | 34 | 101084 | 454.7 | 1082 | 1057 | 220.0 |
| A | 13 | 254 | 13640 | 57.2 | 1082 | 1057 | 220.0 |
| A | 3 | 137 | 9297 | 37.46 | 1082 | 1057 | 220.0 |
| B | 0 | 182 | 883074 | 4240.86 | 1061 | 1033 | 208.0 |
| B | 7 | 220 | 190490 | 910.91 | 1061 | 1033 | 208.0 |
| B | 0 | 198 | 25762 | 118.9 | 1061 | 1033 | 208.0 |
| C | 14 | 238 | 158896 | 641.45 | 1037 | 1043 | 246.1 |
| C | 7 | 221 | 20682 | 79.8 | 1037 | 1043 | 246.1 |
| C | 13 | 61 | 7334 | 25.56 | 1037 | 1043 | 246.1 |
| D | 1 | 20 | 1807964 | 7090.07 | 1045 | 1016 | 254.9 |
| D | 10 | 199 | 112428 | 437.16 | 1045 | 1016 | 254.9 |
| D | 1 | 52 | 62939 | 242.97 | 1045 | 1016 | 254.9 |
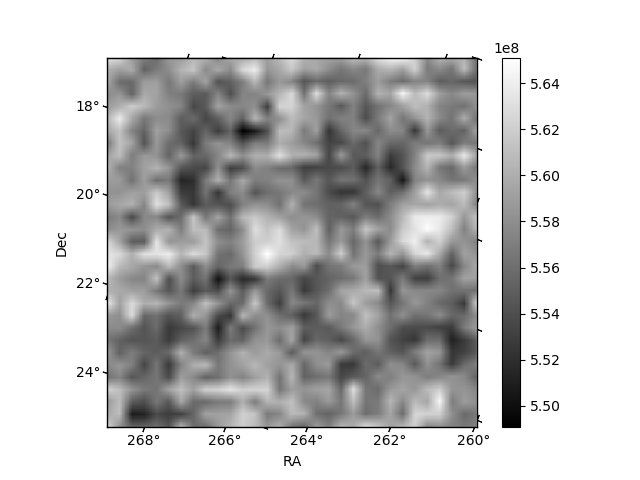
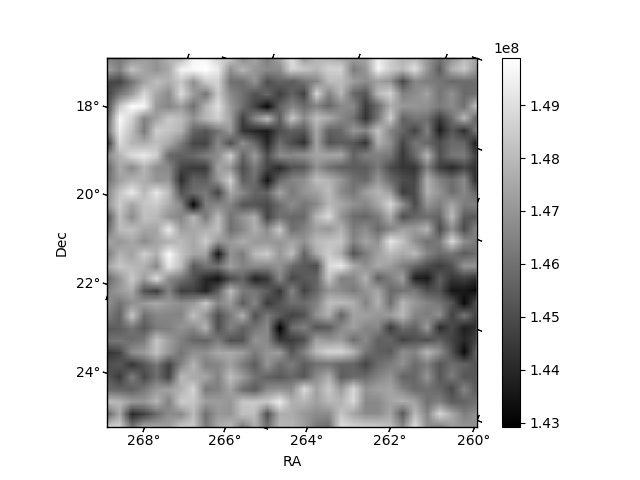
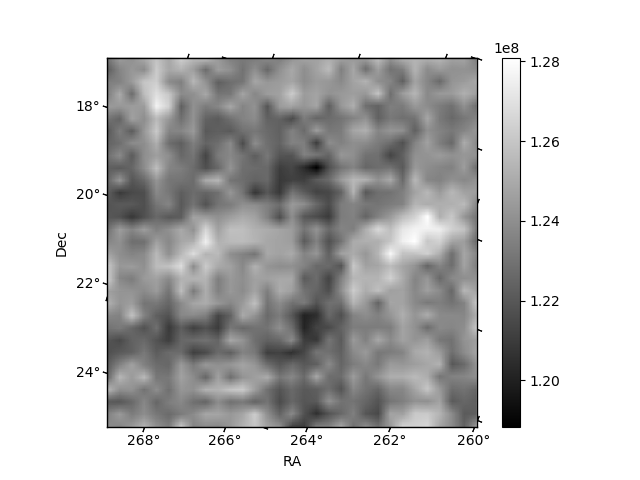
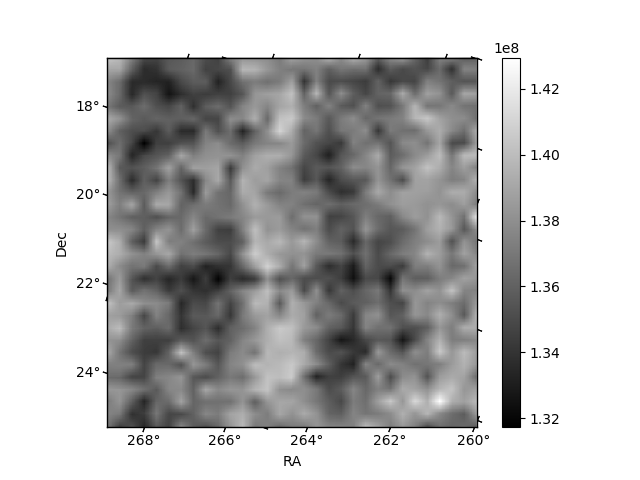
Histogram calculated using DETX and DETY for each event in the final _common_clean file
| Quadrant A | 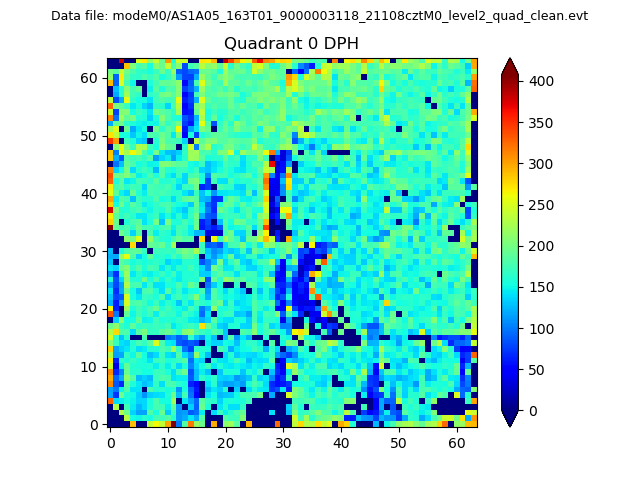 |
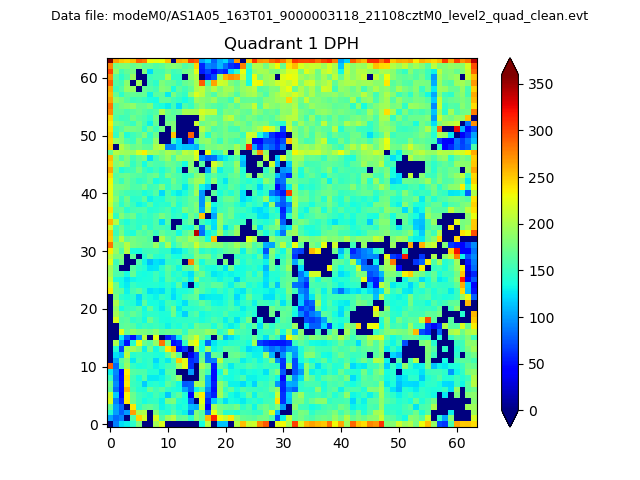 |
Quadrant B |
|---|---|---|---|
| Quadrant D | 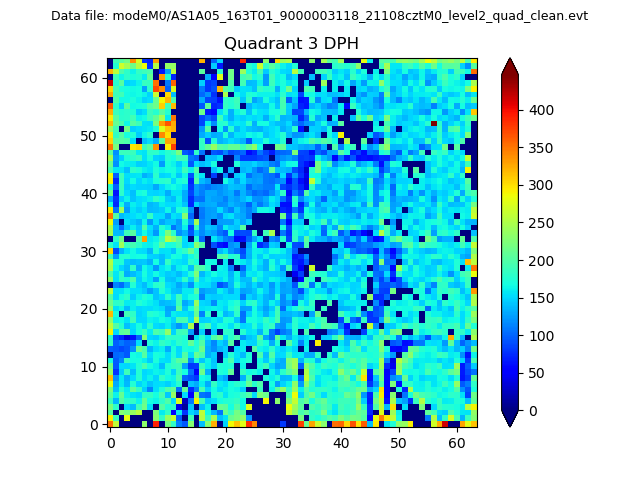 |
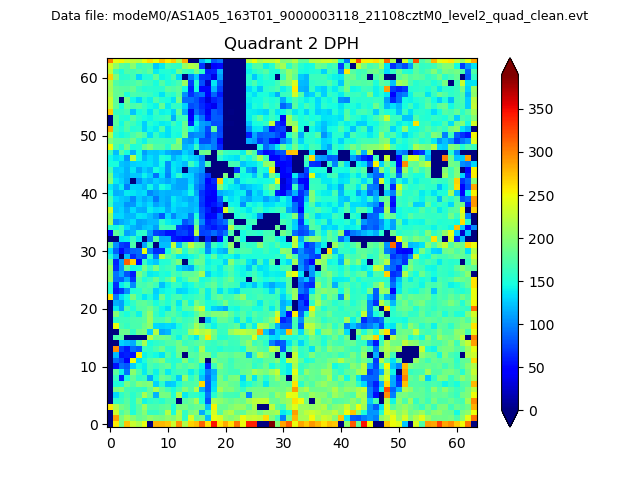 |
Quadrant C |
| Plot type | Count rate plots | Images |
|---|---|---|
| Comparison with Poisson distribution Blue bars denote a histogram of data divided into 1 sec bins. Red curve is a Poisson curve with rate = median count rate of data. |
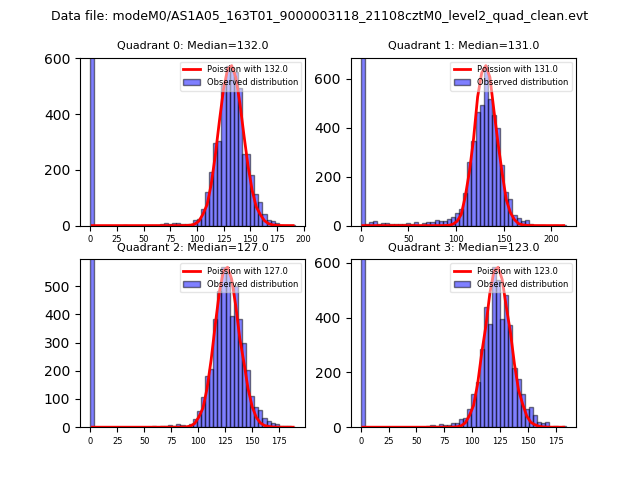 |
 |
| Quadrant-wise count rates Data is divided into 100 sec bins |
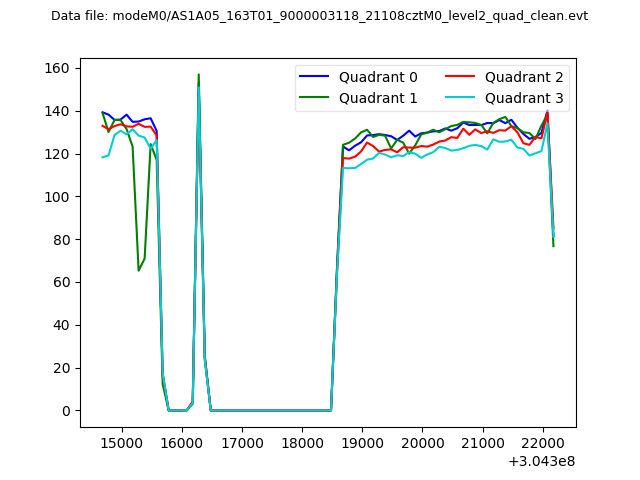 |
|
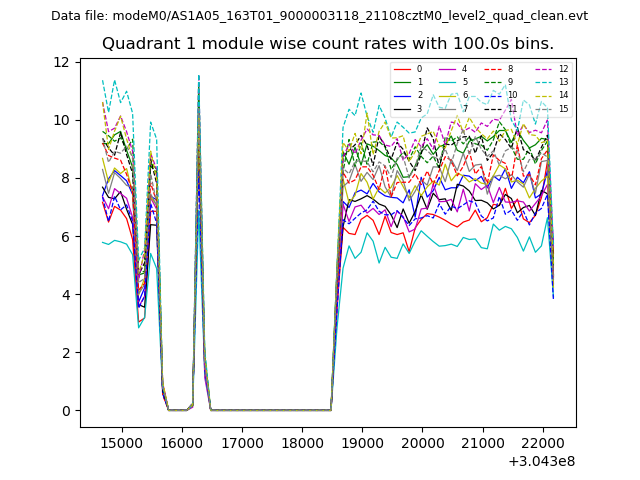
| Module-wise count rates for Quadrant A Data is divided into 100 sec bins |
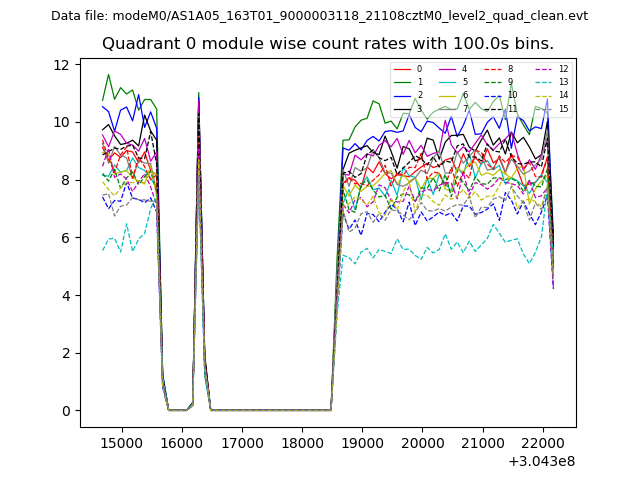 |
 |
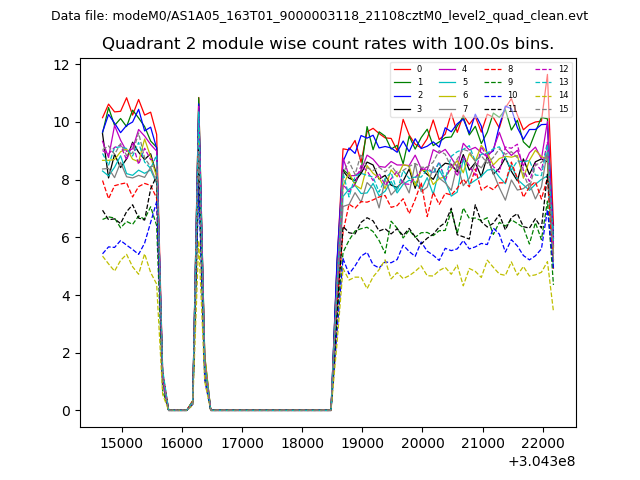
| Module-wise count rates for Quadrant B Data is divided into 100 sec bins |
 |
 |
| Module-wise count rates for Quadrant C Data is divided into 100 sec bins |
 |
 |
| Module-wise count rates for Quadrant D Data is divided into 100 sec bins |
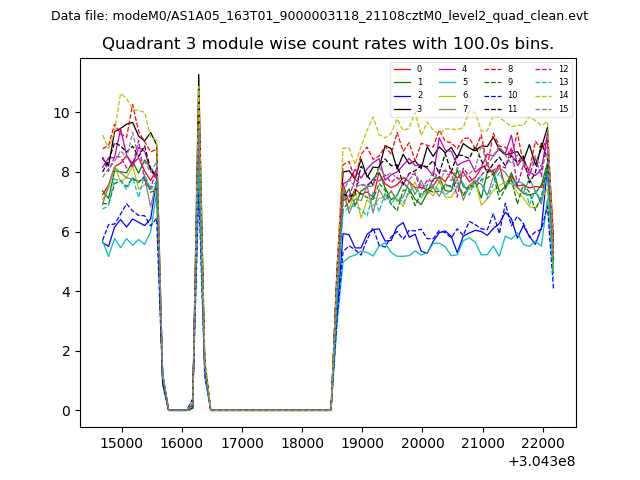 |
 |
| Parameter | Plot |
|---|---|
| CZT HV Monitor | 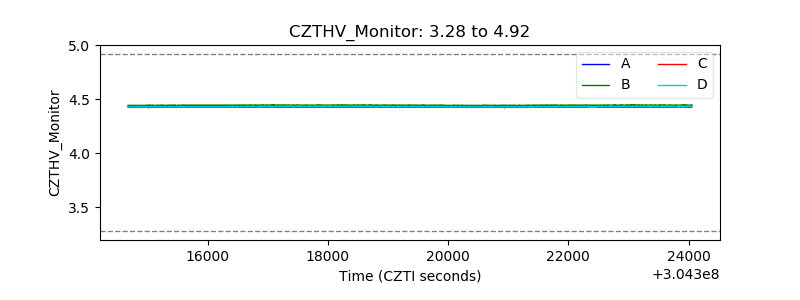 |
| D_VDD | 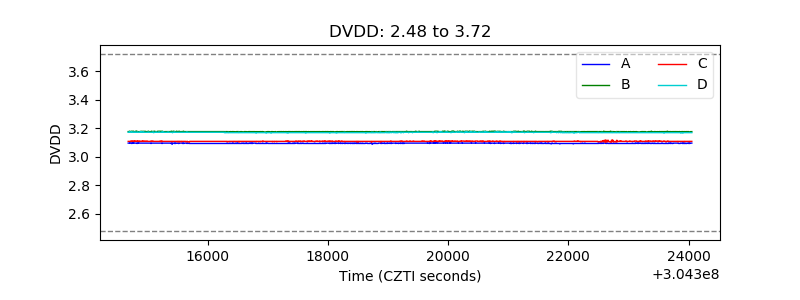 |
| Temperature 1 |  |
| Veto HV Monitor | 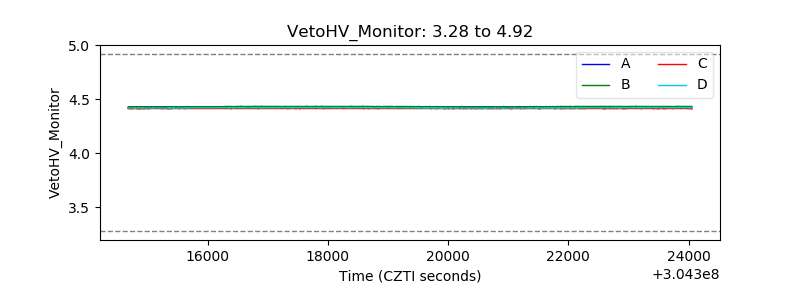 |
| Veto LLD | 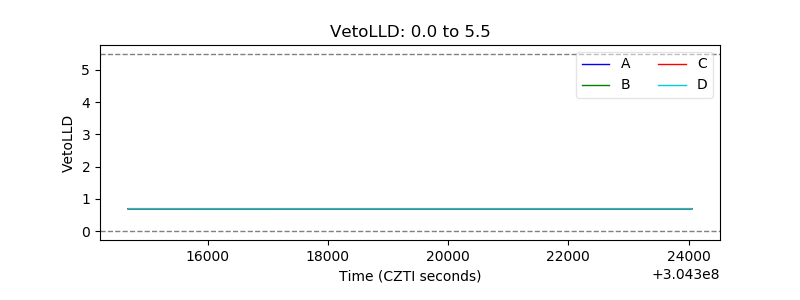 |
| Alpha Counter | 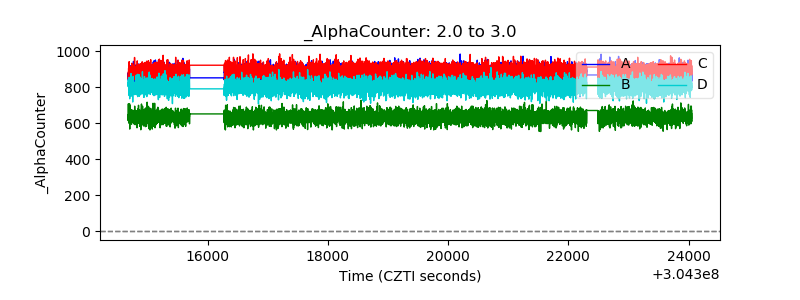 |
| _CPM_Rate | 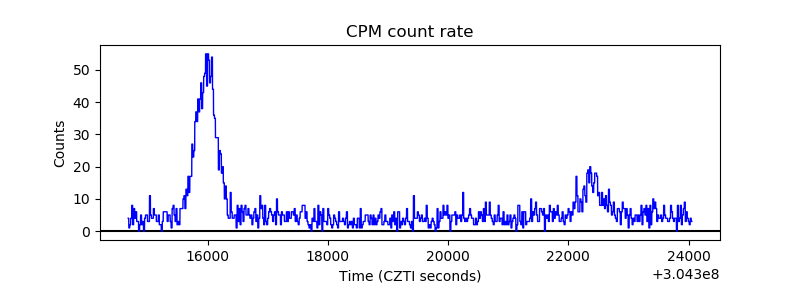 |
| CZT Counter | 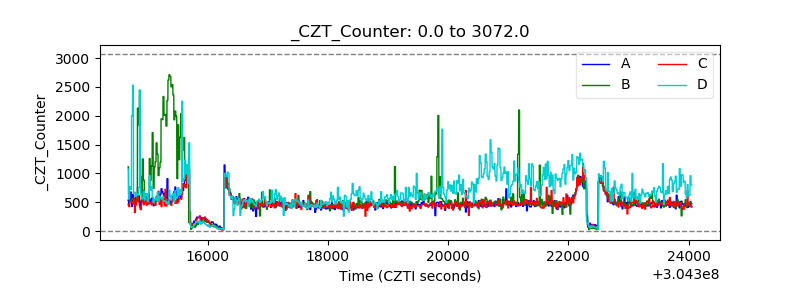 |
| +2.5 Volts monitor |  |
| +5 Volts monitor | 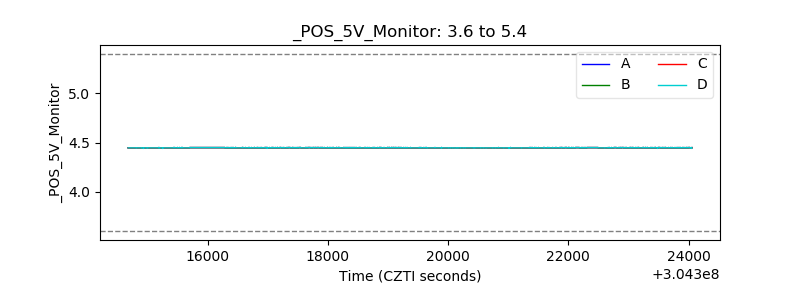 |
| _ROLL_ROT | 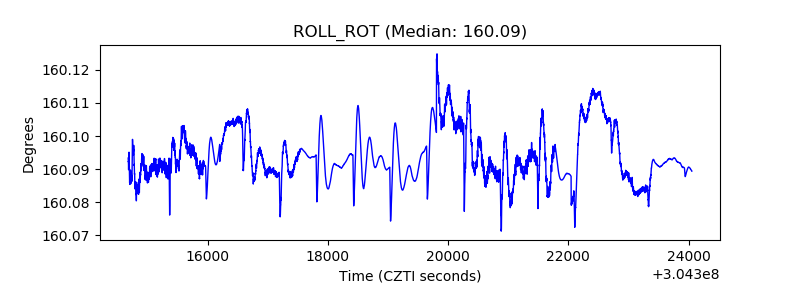 |
| _Roll_DEC | 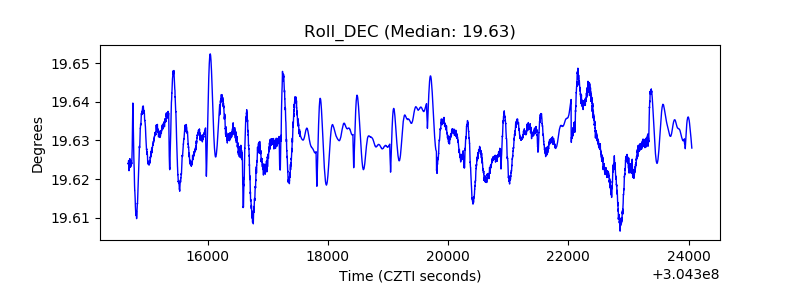 |
| _Roll_RA | 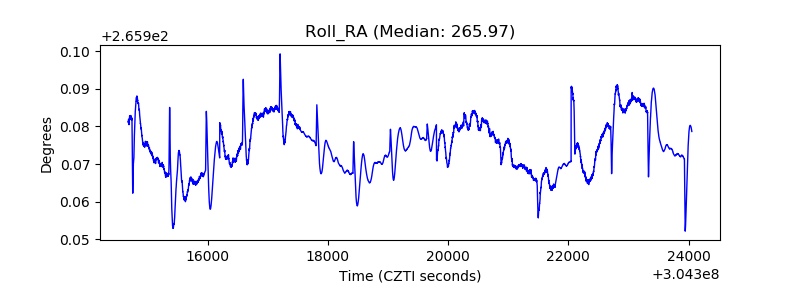 |
| Veto Counter | 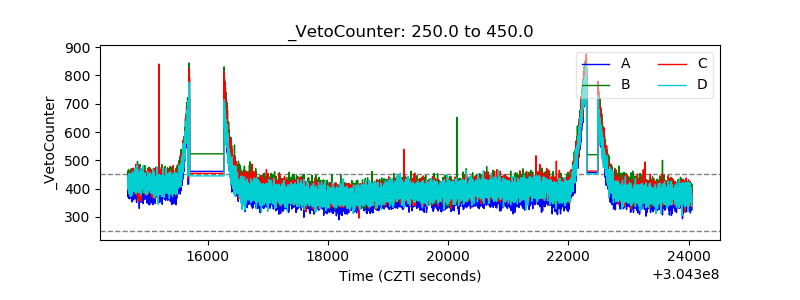 |