| Param | Original file | Final file |
|---|---|---|
| Filename | modeM0/AS1A05_163T01_9000003118_21109cztM0_level2.evt | modeM0/AS1A05_163T01_9000003118_21109cztM0_level2_quad_clean.evt |
| Size (bytes) | 707,152,320 | 98,084,160 |
| Size | 674.4 MB | 93.5 MB |
| Events in quadrant A | 4,359,629 | 606,309 |
| Events in quadrant B | 4,631,421 | 607,188 |
| Events in quadrant C | 4,288,347 | 588,066 |
| Events in quadrant D | 7,543,553 | 560,304 |
| Mode M9 | |||
|---|---|---|---|
| Quadrant | BADHDUFLAG | Total packets | Discarded packets |
| A | 0 | 4 | 0 |
| B | 0 | 4 | 0 |
| C | 0 | 4 | 0 |
| D | 0 | 4 | 0 |
| Mode M0 | |||
|---|---|---|---|
| Quadrant | BADHDUFLAG | Total packets | Discarded packets |
| A | 0 | 18559 | 2 |
| B | 0 | 19228 | 2 |
| C | 0 | 18305 | 3 |
| D | 0 | 28880 | 2 |
| Mode SS | |||
|---|---|---|---|
| Quadrant | BADHDUFLAG | Total packets | Discarded packets |
| A | 0 | 180 | 0 |
| B | 0 | 180 | 0 |
| C | 0 | 180 | 0 |
| D | 0 | 180 | 0 |
| Quadrant | Total seconds | Saturated seconds | Saturation percentage |
|---|---|---|---|
| A | 8759 | 361 | 4.121475% |
| B | 8760 | 469 | 5.353881% |
| C | 8759 | 372 | 4.247060% |
| D | 8759 | 372 | 4.247060% |
Noise dominated data is calculated using 1-second bins in cleaned event files. If a bin has >2000 counts, and if more than 50% of those come from <1% of pixels, then it is considered to be noise-dominated and hence unusable.
| Quadrant | # 1 sec bins | Bins with >0 counts | Bins with >2000 counts | High rate bins dominated by noise | Noise dominated (total time) | Noise dominated (detector-on time) | Marked lightcurve |
|---|---|---|---|---|---|---|---|
| A | 9179 | 8761 | 3 | 3 | 0.03% | 0.03% | 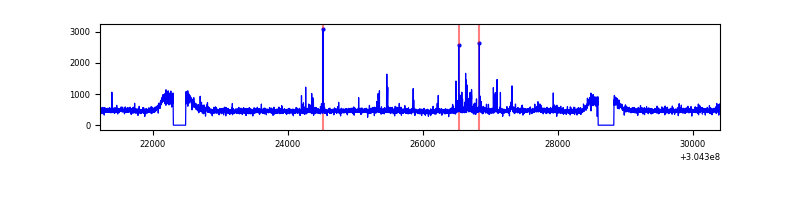 |
| B | 9180 | 8761 | 41 | 41 | 0.45% | 0.47% | 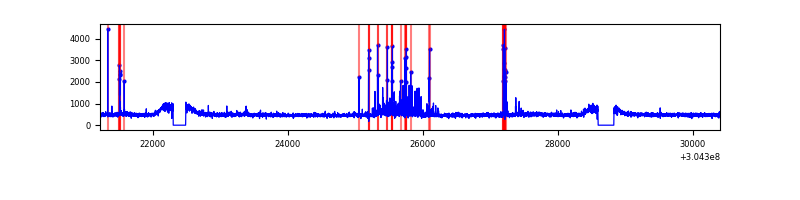 |
| C | 9179 | 8761 | 0 | 0 | 0.00% | 0.00% | 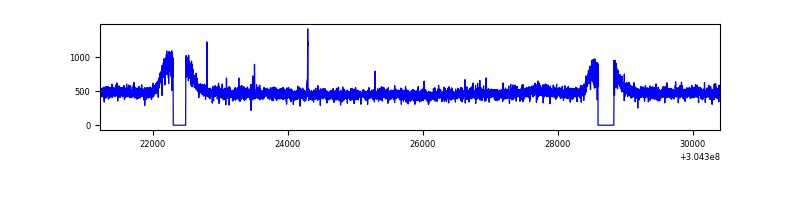 |
| D | 9179 | 8761 | 36 | 36 | 0.39% | 0.41% | 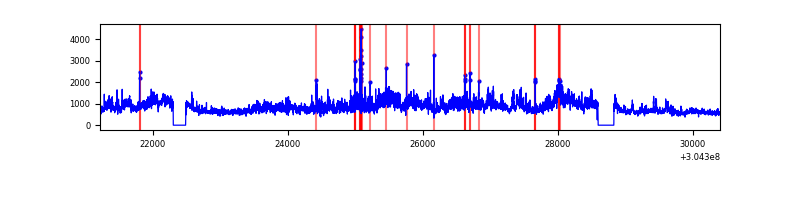 |
Top three noisy pixels from each quadrant. If the there are fewer than three noisy pixels in the level2.evt file, extra rows are filled as -1
| Pixel properties | Quadrant properties | ||||||
|---|---|---|---|---|---|---|---|
| Quadrant | DetID | PixID | Counts | Sigma | Mean | Median | Sigma |
| A | 15 | 192 | 125734 | 556.03 | 1097 | 1067 | 224.2 |
| A | 13 | 254 | 13971 | 57.55 | 1097 | 1067 | 224.2 |
| A | 3 | 137 | 9642 | 38.25 | 1097 | 1067 | 224.2 |
| B | 7 | 220 | 224151 | 1041.3 | 1089 | 1055 | 214.2 |
| B | 3 | 64 | 78658 | 362.21 | 1089 | 1055 | 214.2 |
| B | 12 | 111 | 26446 | 118.51 | 1089 | 1055 | 214.2 |
| C | 14 | 238 | 160002 | 638.64 | 1054 | 1062 | 248.9 |
| C | 7 | 221 | 13222 | 48.86 | 1054 | 1062 | 248.9 |
| C | 13 | 61 | 7533 | 26.0 | 1054 | 1062 | 248.9 |
| D | 1 | 20 | 3277335 | 12704.42 | 1060 | 1029 | 257.9 |
| D | 13 | 153 | 74107 | 283.37 | 1060 | 1029 | 257.9 |
| D | 9 | 1 | 55850 | 212.58 | 1060 | 1029 | 257.9 |
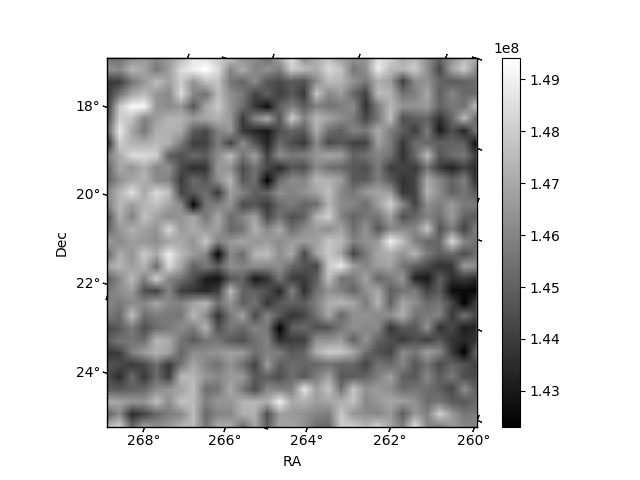
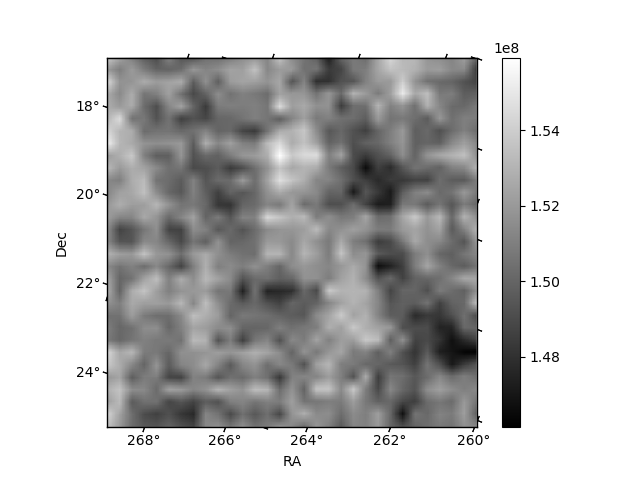
Histogram calculated using DETX and DETY for each event in the final _common_clean file
| Quadrant A | 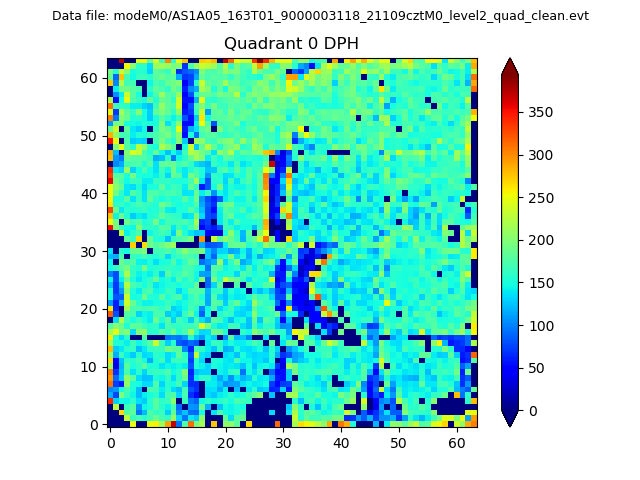 |
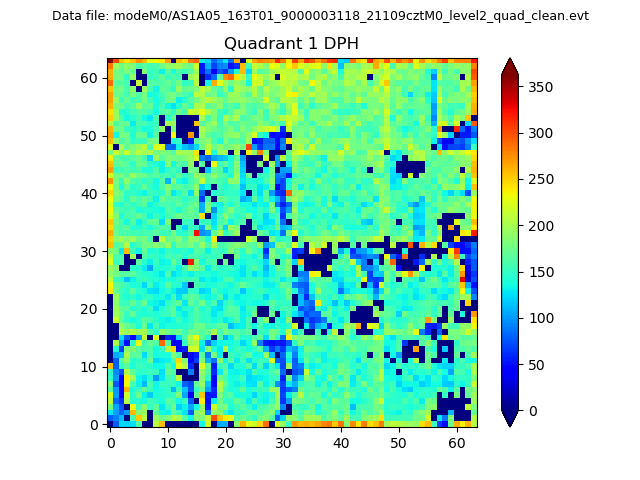 |
Quadrant B |
|---|---|---|---|
| Quadrant D | 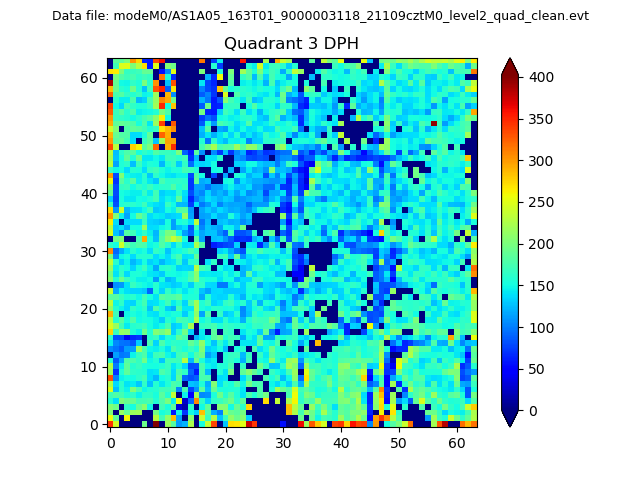 |
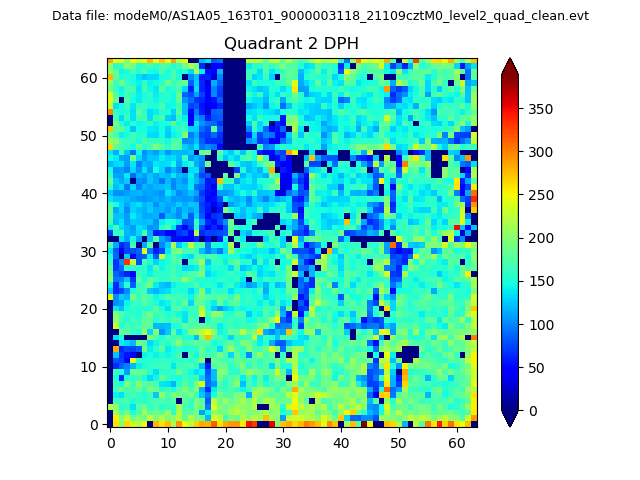 |
Quadrant C |
| Plot type | Count rate plots | Images |
|---|---|---|
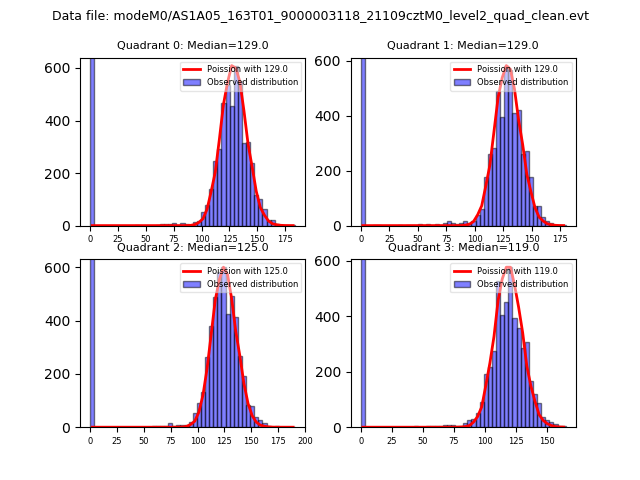
| Comparison with Poisson distribution Blue bars denote a histogram of data divided into 1 sec bins. Red curve is a Poisson curve with rate = median count rate of data. |
 |
 |
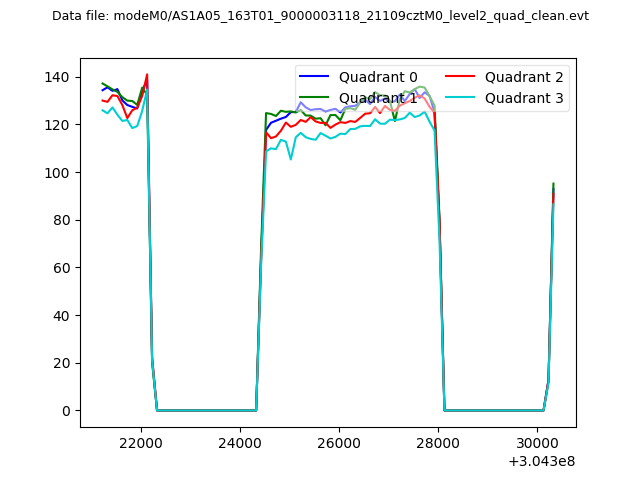
| Quadrant-wise count rates Data is divided into 100 sec bins |
 |
|
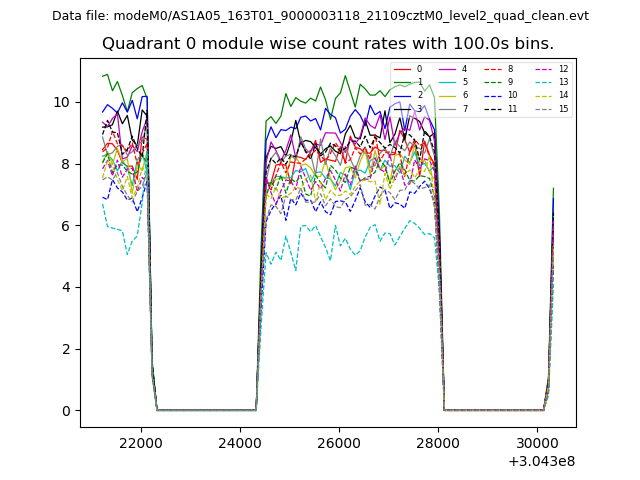
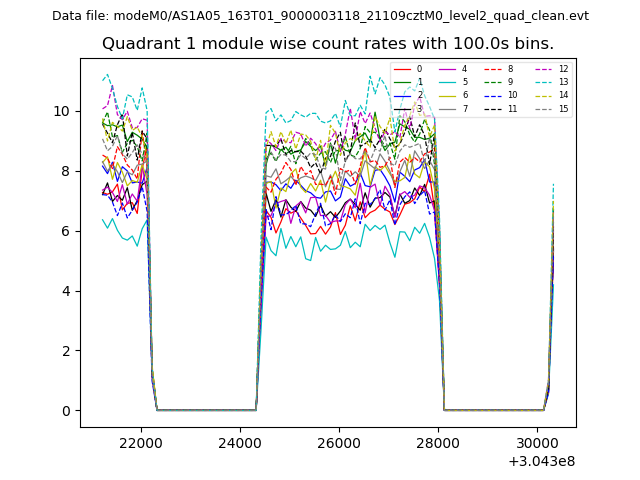
| Module-wise count rates for Quadrant A Data is divided into 100 sec bins |
 |
 |
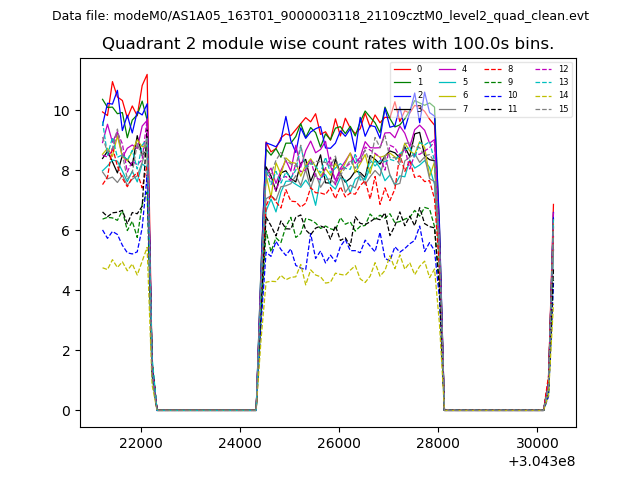
| Module-wise count rates for Quadrant B Data is divided into 100 sec bins |
 |
 |
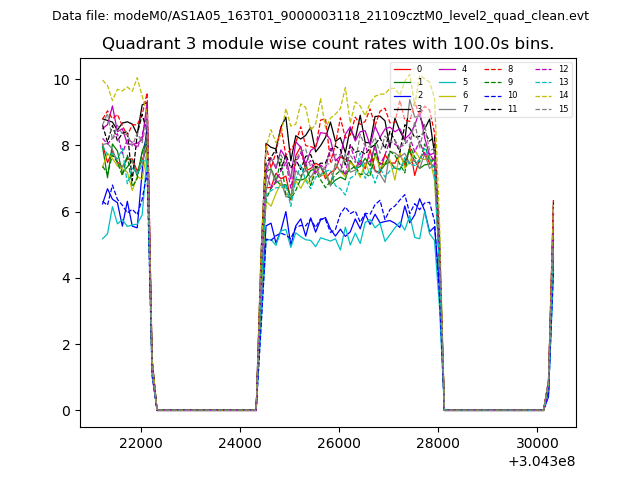
| Module-wise count rates for Quadrant C Data is divided into 100 sec bins |
 |
 |
| Module-wise count rates for Quadrant D Data is divided into 100 sec bins |
 |
 |
| Parameter | Plot |
|---|---|
| CZT HV Monitor | 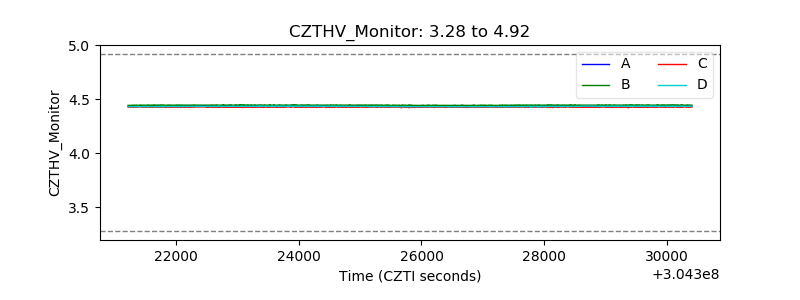 |
| D_VDD |  |
| Temperature 1 | 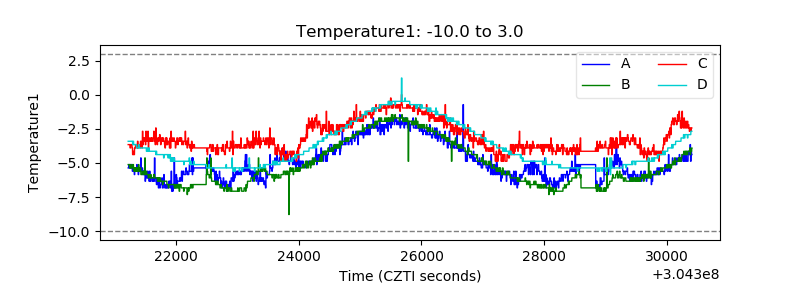 |
| Veto HV Monitor | 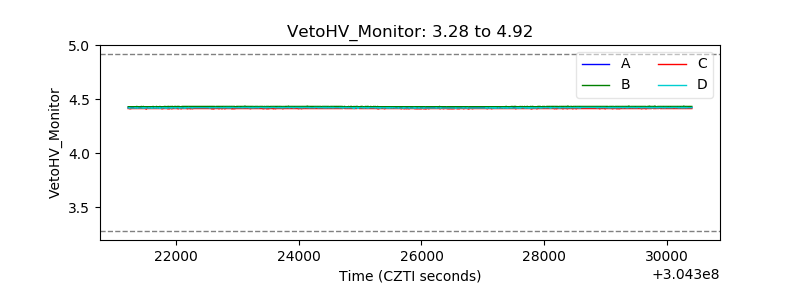 |
| Veto LLD |  |
| Alpha Counter | 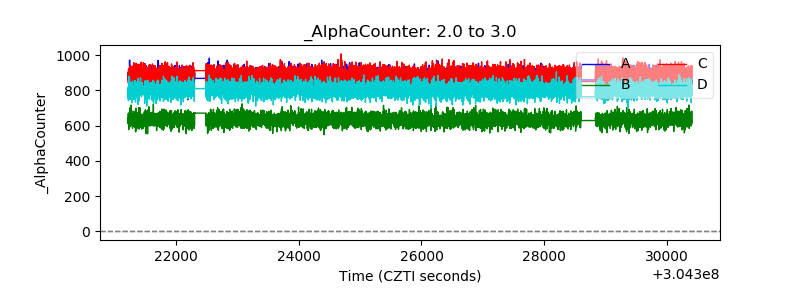 |
| _CPM_Rate | 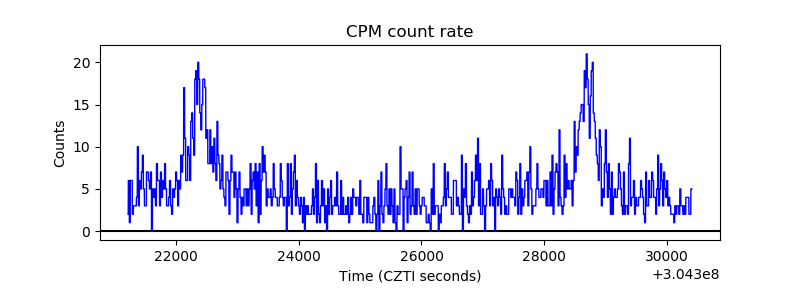 |
| CZT Counter | 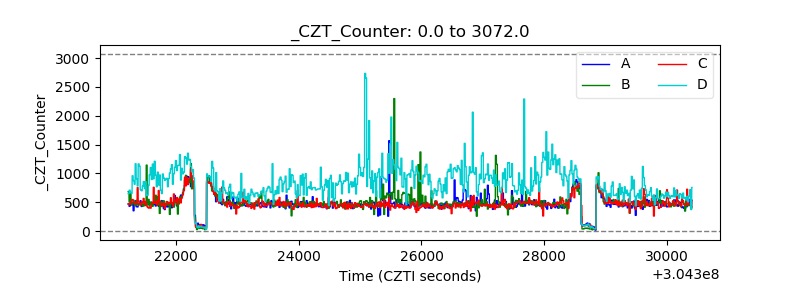 |
| +2.5 Volts monitor |  |
| +5 Volts monitor |  |
| _ROLL_ROT | 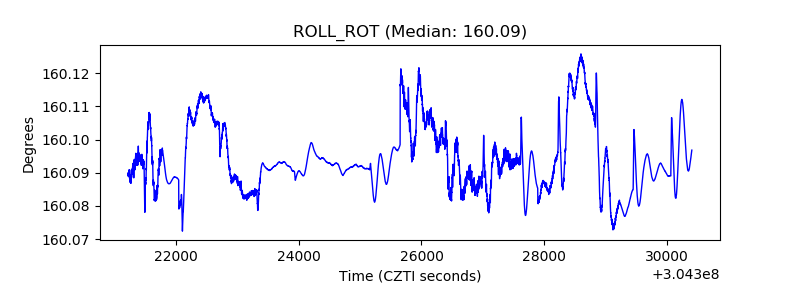 |
| _Roll_DEC | 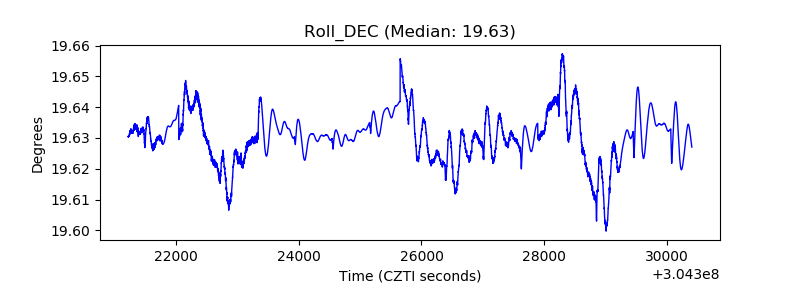 |
| _Roll_RA | 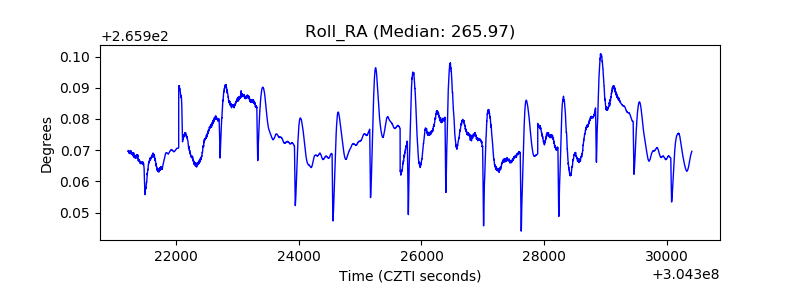 |
| Veto Counter |  |