| Param | Original file | Final file |
|---|---|---|
| Filename | modeM0/AS1A05_163T01_9000003118_21112cztM0_level2.evt | modeM0/AS1A05_163T01_9000003118_21112cztM0_level2_quad_clean.evt |
| Size (bytes) | 1,368,380,160 | 186,134,400 |
| Size | 1.3 GB | 177.5 MB |
| Events in quadrant A | 7,313,509 | 1,200,815 |
| Events in quadrant B | 12,822,902 | 1,106,957 |
| Events in quadrant C | 7,367,138 | 1,156,497 |
| Events in quadrant D | 12,890,113 | 1,100,075 |
| Mode M9 | |||
|---|---|---|---|
| Quadrant | BADHDUFLAG | Total packets | Discarded packets |
| A | 0 | 19 | 0 |
| B | 0 | 19 | 0 |
| C | 0 | 19 | 0 |
| D | 0 | 19 | 0 |
| Mode M0 | |||
|---|---|---|---|
| Quadrant | BADHDUFLAG | Total packets | Discarded packets |
| A | 0 | 33203 | 1423 |
| B | 0 | 50442 | 2630 |
| C | 0 | 33119 | 1387 |
| D | 0 | 51958 | 2424 |
| Mode SS | |||
|---|---|---|---|
| Quadrant | BADHDUFLAG | Total packets | Discarded packets |
| A | 0 | 331 | 13 |
| B | 0 | 329 | 11 |
| C | 0 | 332 | 14 |
| D | 0 | 331 | 15 |
| Quadrant | Total seconds | Saturated seconds | Saturation percentage |
|---|---|---|---|
| A | 15553 | 242 | 1.555970% |
| B | 15530 | 1808 | 11.641983% |
| C | 15548 | 293 | 1.884487% |
| D | 15527 | 454 | 2.923939% |
Noise dominated data is calculated using 1-second bins in cleaned event files. If a bin has >2000 counts, and if more than 50% of those come from <1% of pixels, then it is considered to be noise-dominated and hence unusable.
| Quadrant | # 1 sec bins | Bins with >0 counts | Bins with >2000 counts | High rate bins dominated by noise | Noise dominated (total time) | Noise dominated (detector-on time) | Marked lightcurve |
|---|---|---|---|---|---|---|---|
| A | 20148 | 15586 | 0 | 0 | 0.00% | 0.00% | 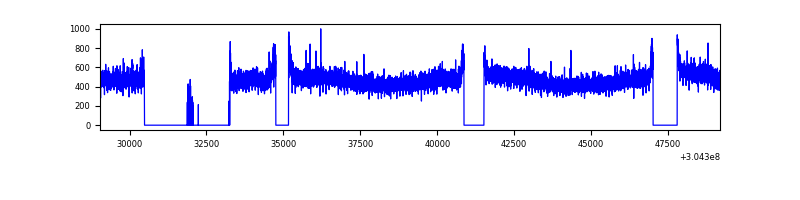 |
| B | 20137 | 15556 | 1236 | 1236 | 6.14% | 7.95% | 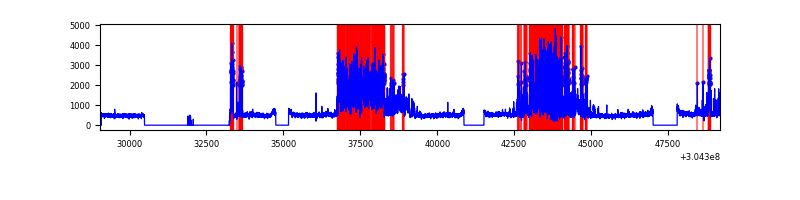 |
| C | 20140 | 15589 | 0 | 0 | 0.00% | 0.00% | 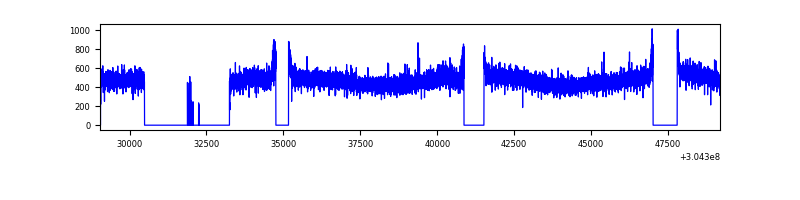 |
| D | 20141 | 15554 | 213 | 213 | 1.06% | 1.37% | 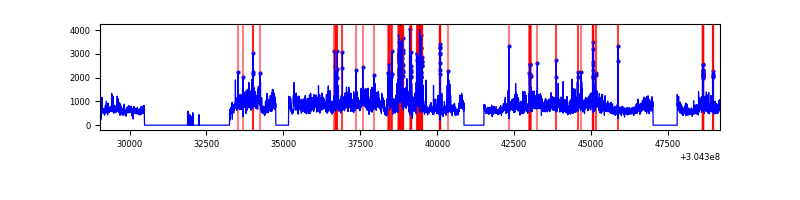 |
Top three noisy pixels from each quadrant. If the there are fewer than three noisy pixels in the level2.evt file, extra rows are filled as -1
| Pixel properties | Quadrant properties | ||||||
|---|---|---|---|---|---|---|---|
| Quadrant | DetID | PixID | Counts | Sigma | Mean | Median | Sigma |
| A | 15 | 192 | 24630 | 59.93 | 1890 | 1845 | 380.2 |
| A | 13 | 254 | 23207 | 56.19 | 1890 | 1845 | 380.2 |
| A | 0 | 226 | 16387 | 38.25 | 1890 | 1845 | 380.2 |
| B | 0 | 182 | 5134462 | 14870.28 | 1820 | 1775 | 345.2 |
| B | 7 | 220 | 257872 | 741.96 | 1820 | 1775 | 345.2 |
| B | 15 | 201 | 88584 | 251.5 | 1820 | 1775 | 345.2 |
| C | 14 | 238 | 280868 | 651.5 | 1817 | 1825 | 428.3 |
| C | 13 | 61 | 12696 | 25.38 | 1817 | 1825 | 428.3 |
| C | 8 | 128 | 5777 | 9.23 | 1817 | 1825 | 428.3 |
| D | 1 | 20 | 4950467 | 11296.58 | 1816 | 1766 | 438.1 |
| D | 9 | 1 | 359582 | 816.8 | 1816 | 1766 | 438.1 |
| D | 1 | 239 | 323457 | 734.34 | 1816 | 1766 | 438.1 |
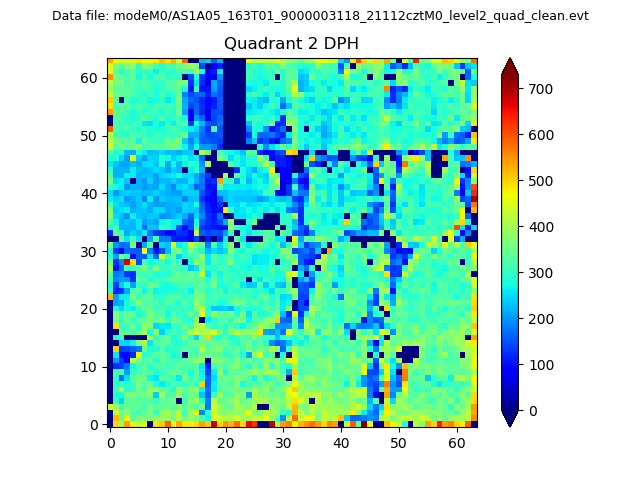
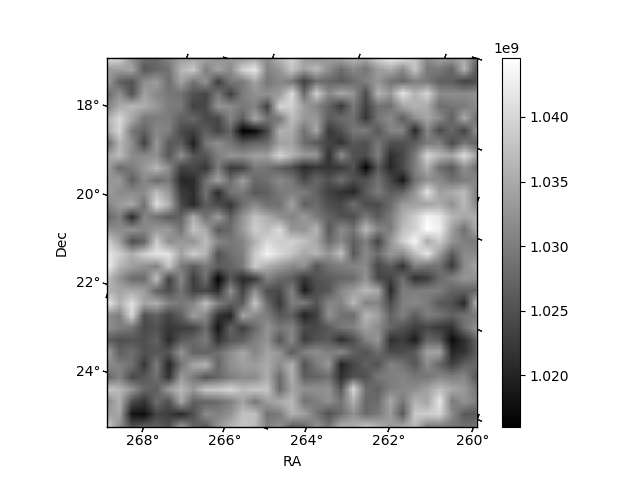
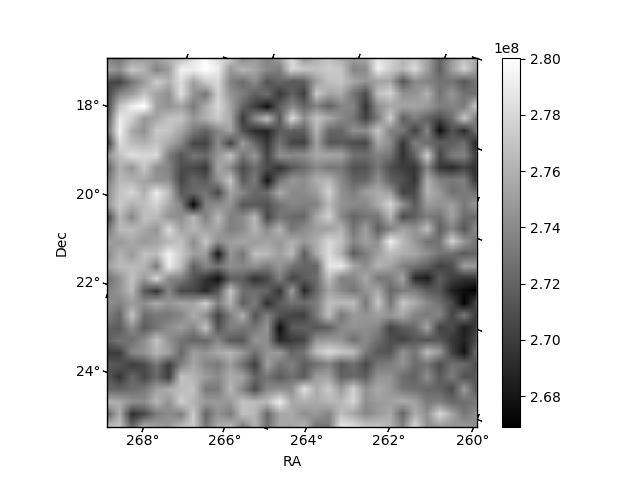
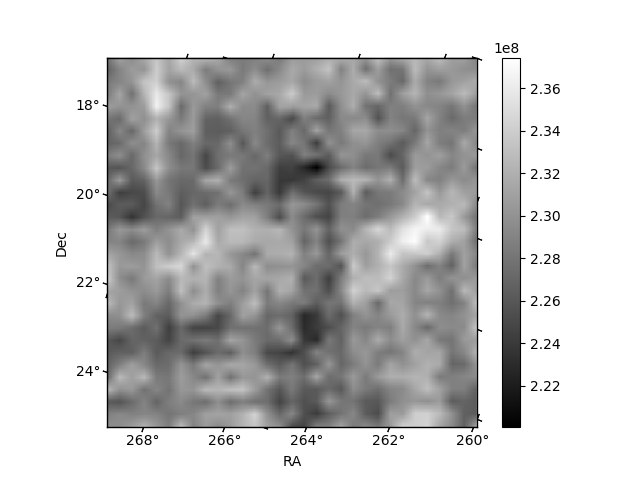
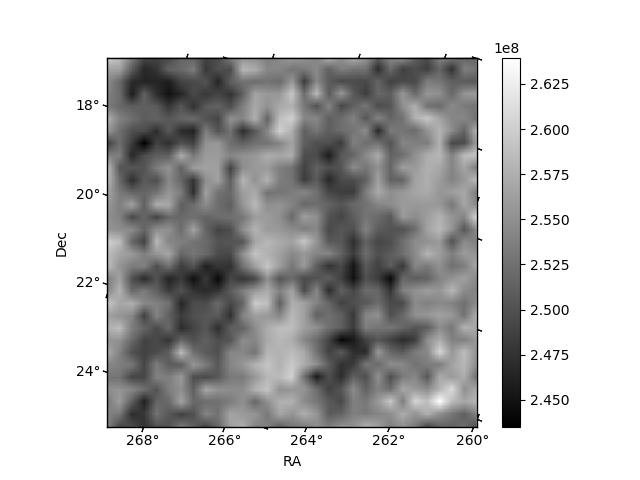
Histogram calculated using DETX and DETY for each event in the final _common_clean file
| Quadrant A | 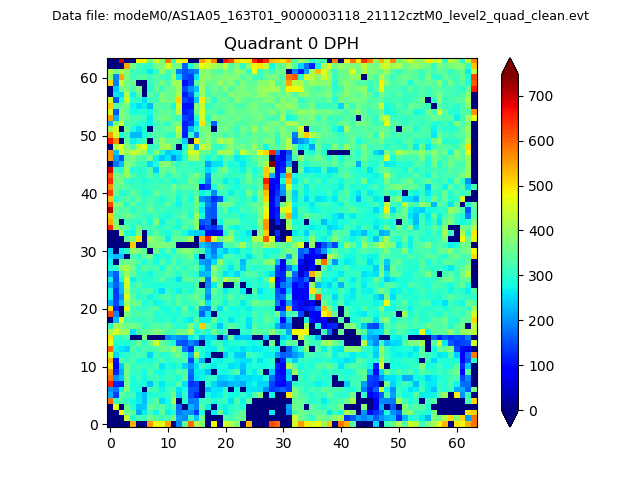 |
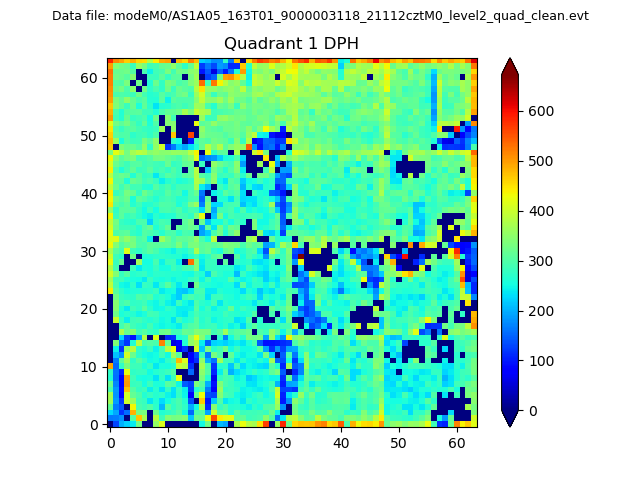 |
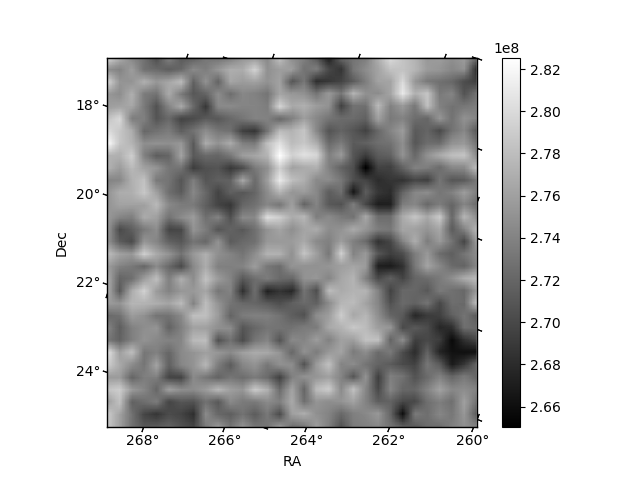
Quadrant B |
|---|---|---|---|
| Quadrant D | 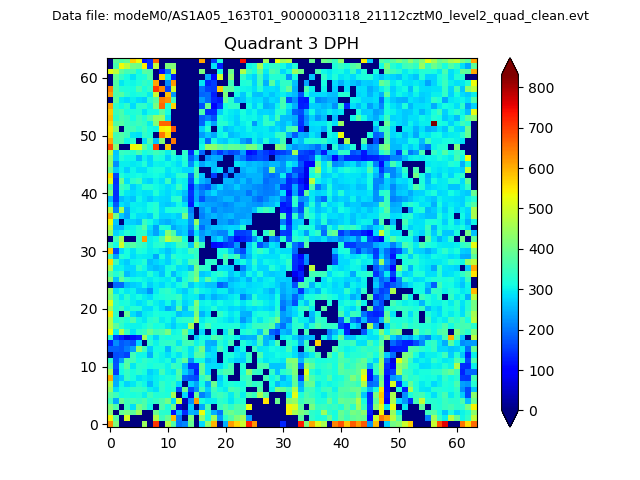 |
 |
Quadrant C |
| Plot type | Count rate plots | Images |
|---|---|---|
| Comparison with Poisson distribution Blue bars denote a histogram of data divided into 1 sec bins. Red curve is a Poisson curve with rate = median count rate of data. |
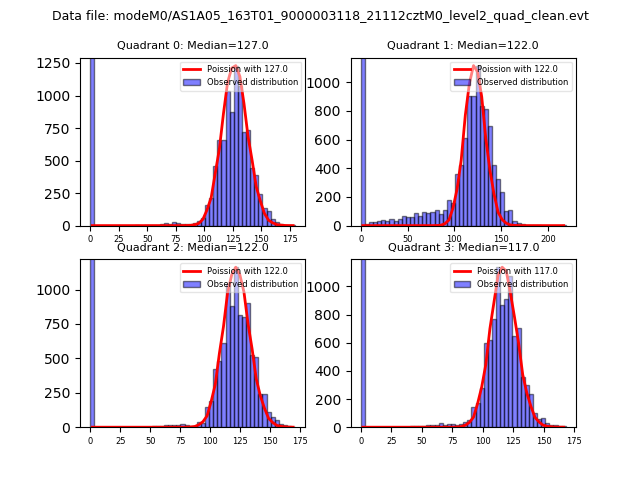 |
 |
| Quadrant-wise count rates Data is divided into 100 sec bins |
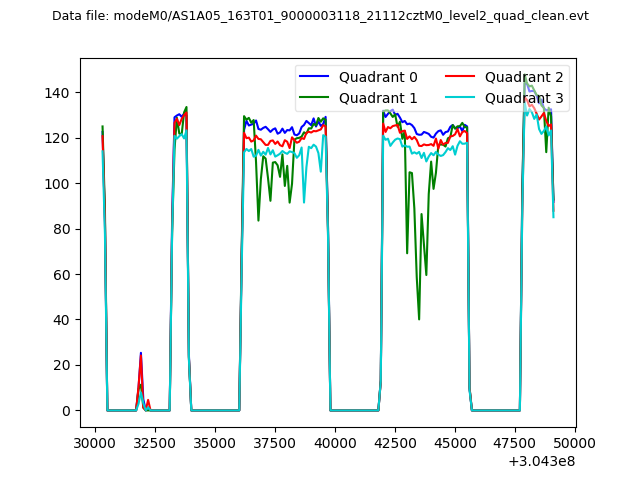 |
|
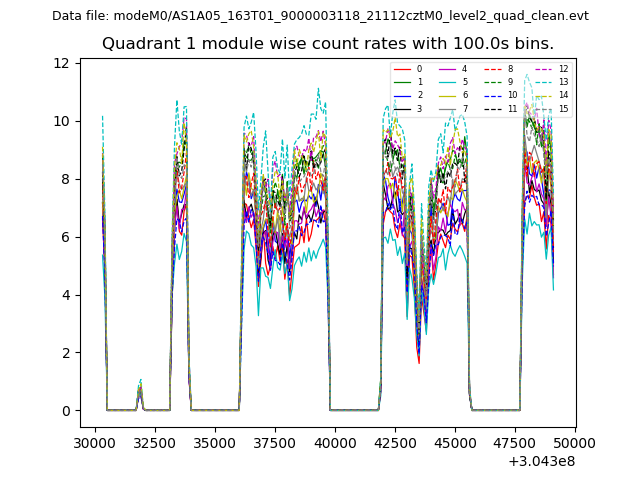
| Module-wise count rates for Quadrant A Data is divided into 100 sec bins |
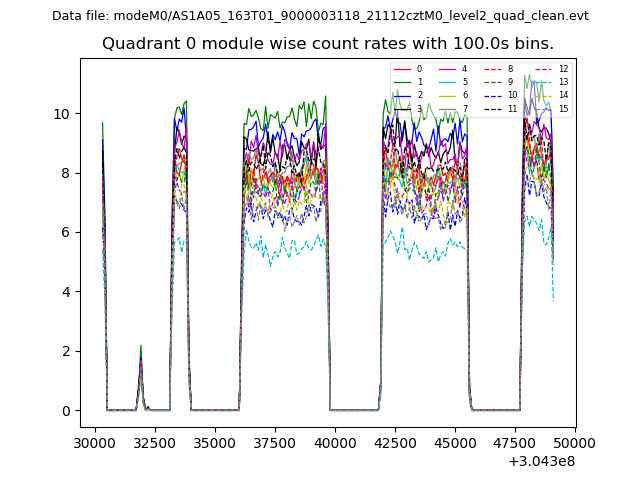 |
 |
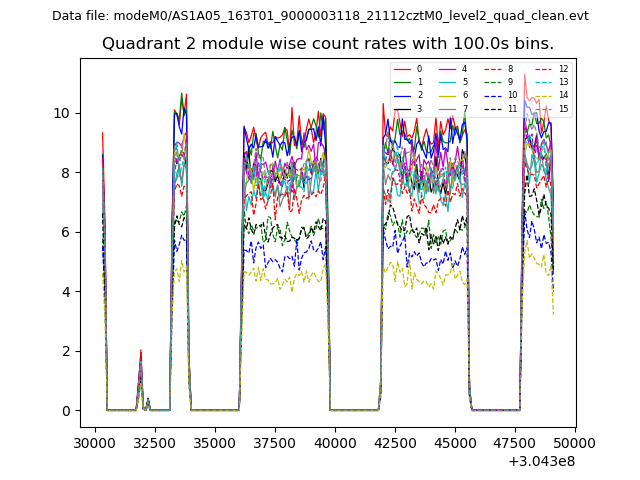
| Module-wise count rates for Quadrant B Data is divided into 100 sec bins |
 |
 |
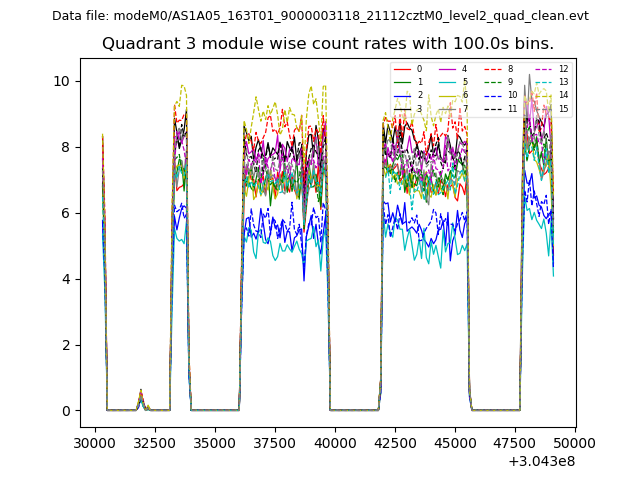
| Module-wise count rates for Quadrant C Data is divided into 100 sec bins |
 |
 |
| Module-wise count rates for Quadrant D Data is divided into 100 sec bins |
 |
 |
| Parameter | Plot |
|---|---|
| CZT HV Monitor | 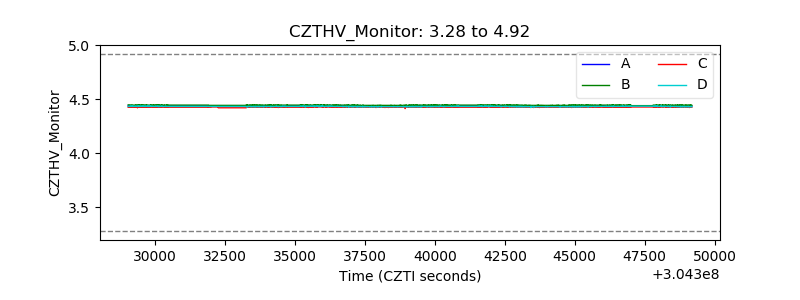 |
| D_VDD | 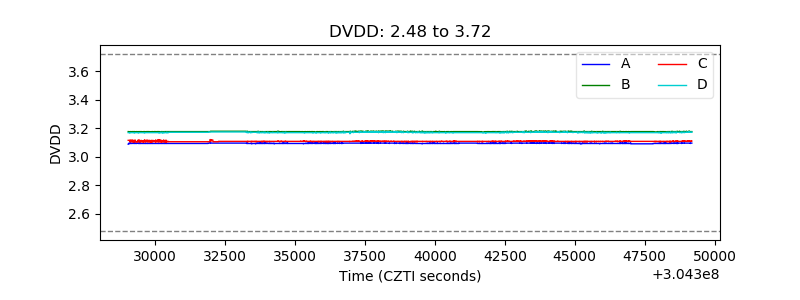 |
| Temperature 1 | 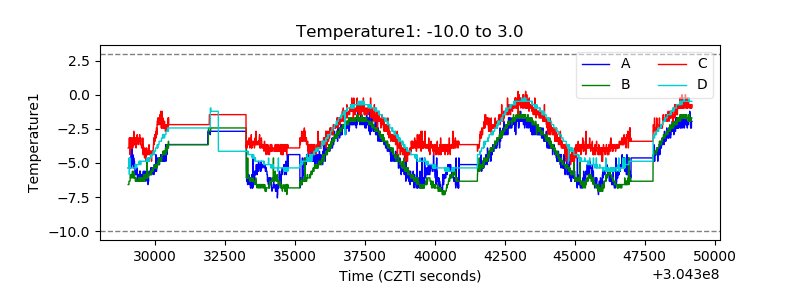 |
| Veto HV Monitor |  |
| Veto LLD | 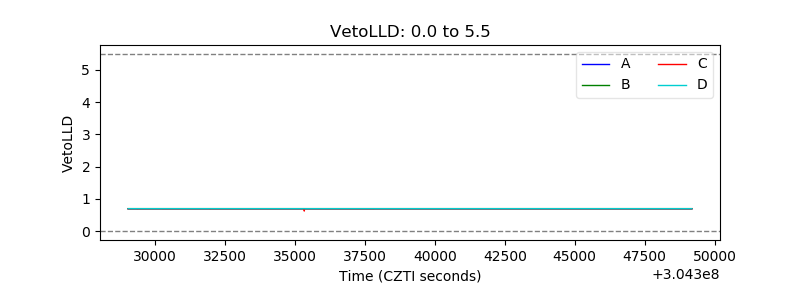 |
| Alpha Counter | 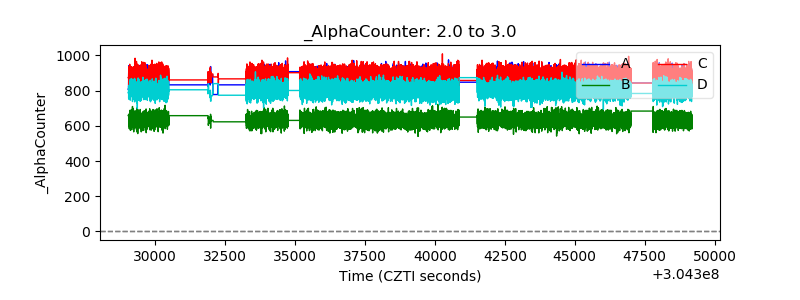 |
| _CPM_Rate | 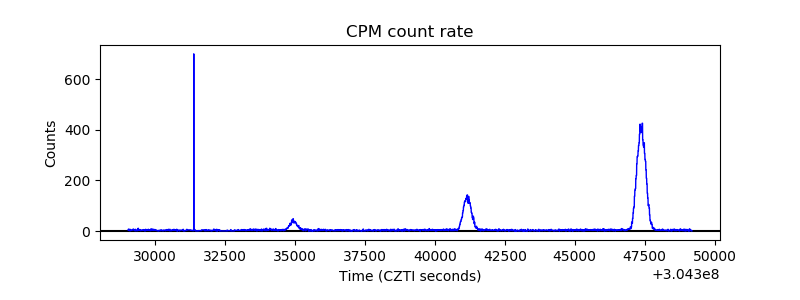 |
| CZT Counter | 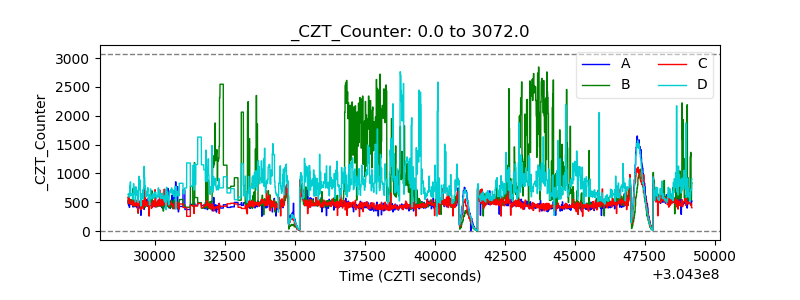 |
| +2.5 Volts monitor |  |
| +5 Volts monitor |  |
| _ROLL_ROT | 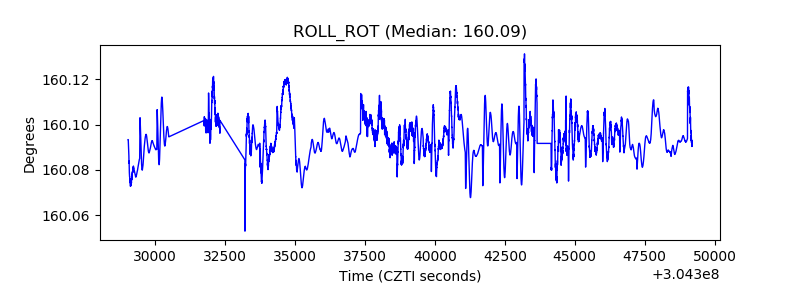 |
| _Roll_DEC | 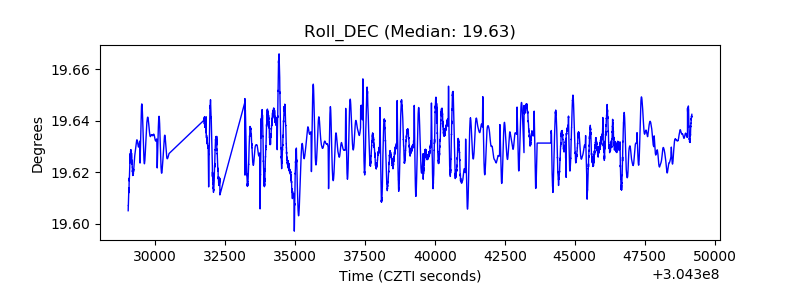 |
| _Roll_RA | 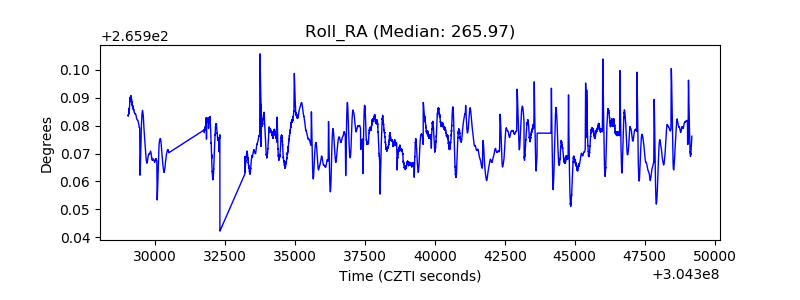 |
| Veto Counter | 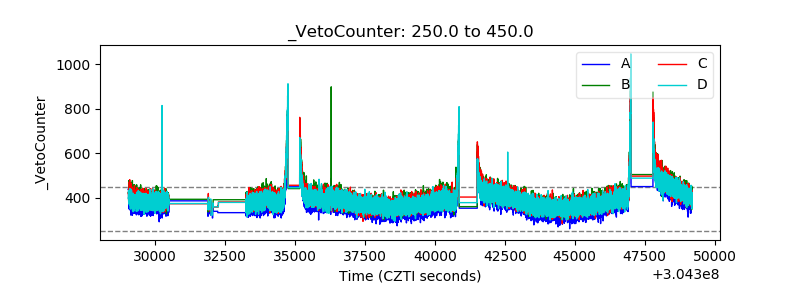 |