| Param | Original file | Final file |
|---|---|---|
| Filename | modeM0/AS1A05_163T01_9000003118_21115cztM0_level2.evt | modeM0/AS1A05_163T01_9000003118_21115cztM0_level2_quad_clean.evt |
| Size (bytes) | 516,191,040 | 89,029,440 |
| Size | 492.3 MB | 84.9 MB |
| Events in quadrant A | 3,032,877 | 599,984 |
| Events in quadrant B | 4,755,173 | 549,795 |
| Events in quadrant C | 3,031,023 | 572,464 |
| Events in quadrant D | 4,397,277 | 544,976 |
| Mode M9 | |||
|---|---|---|---|
| Quadrant | BADHDUFLAG | Total packets | Discarded packets |
| A | 0 | 13 | 0 |
| B | 0 | 14 | 0 |
| C | 0 | 14 | 0 |
| D | 0 | 14 | 0 |
| Mode M0 | |||
|---|---|---|---|
| Quadrant | BADHDUFLAG | Total packets | Discarded packets |
| A | 0 | 13153 | 2 |
| B | 0 | 18205 | 2 |
| C | 0 | 13013 | 2 |
| D | 0 | 17486 | 2 |
| Mode SS | |||
|---|---|---|---|
| Quadrant | BADHDUFLAG | Total packets | Discarded packets |
| A | 0 | 124 | 0 |
| B | 0 | 124 | 0 |
| C | 0 | 124 | 0 |
| D | 0 | 124 | 0 |
| Quadrant | Total seconds | Saturated seconds | Saturation percentage |
|---|---|---|---|
| A | 6143 | 53 | 0.862771% |
| B | 6143 | 718 | 11.688100% |
| C | 6143 | 72 | 1.172066% |
| D | 6143 | 149 | 2.425525% |
Noise dominated data is calculated using 1-second bins in cleaned event files. If a bin has >2000 counts, and if more than 50% of those come from <1% of pixels, then it is considered to be noise-dominated and hence unusable.
| Quadrant | # 1 sec bins | Bins with >0 counts | Bins with >2000 counts | High rate bins dominated by noise | Noise dominated (total time) | Noise dominated (detector-on time) | Marked lightcurve |
|---|---|---|---|---|---|---|---|
| A | 7248 | 6144 | 4 | 4 | 0.06% | 0.07% | 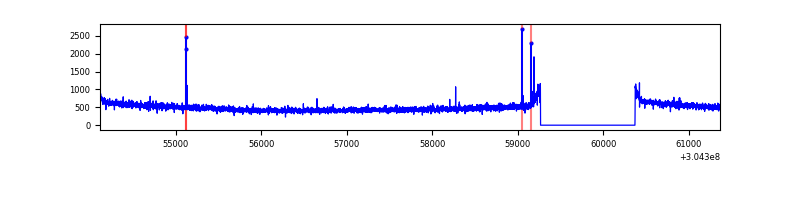 |
| B | 7247 | 6143 | 398 | 398 | 5.49% | 6.48% | 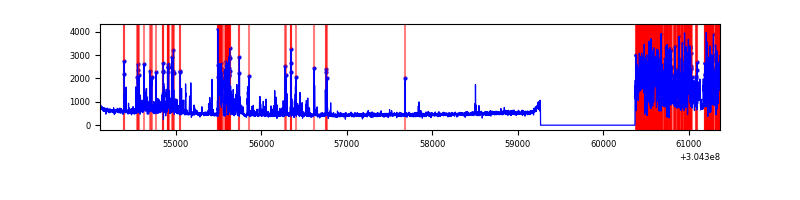 |
| C | 7248 | 6144 | 0 | 0 | 0.00% | 0.00% | 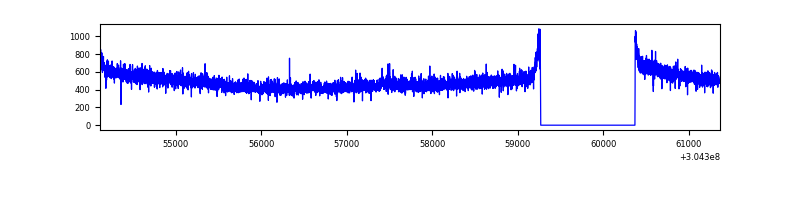 |
| D | 7248 | 6144 | 73 | 73 | 1.01% | 1.19% | 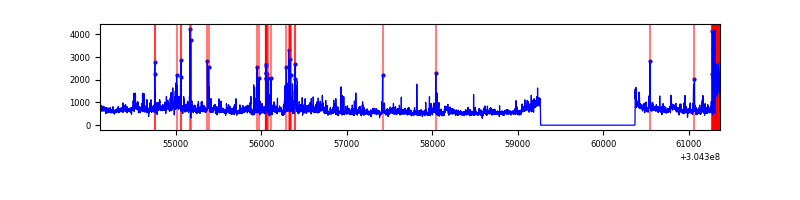 |
Top three noisy pixels from each quadrant. If the there are fewer than three noisy pixels in the level2.evt file, extra rows are filled as -1
| Pixel properties | Quadrant properties | ||||||
|---|---|---|---|---|---|---|---|
| Quadrant | DetID | PixID | Counts | Sigma | Mean | Median | Sigma |
| A | 15 | 174 | 22874 | 142.26 | 778 | 761 | 155.4 |
| A | 15 | 192 | 13355 | 81.02 | 778 | 761 | 155.4 |
| A | 13 | 254 | 8436 | 49.38 | 778 | 761 | 155.4 |
| B | 0 | 182 | 1456970 | 10379.95 | 736 | 717 | 140.3 |
| B | 7 | 220 | 267421 | 1901.03 | 736 | 717 | 140.3 |
| B | 0 | 190 | 76205 | 538.07 | 736 | 717 | 140.3 |
| C | 14 | 238 | 117650 | 668.69 | 746 | 750 | 174.8 |
| C | 10 | 91 | 5745 | 28.57 | 746 | 750 | 174.8 |
| C | 13 | 61 | 5340 | 26.26 | 746 | 750 | 174.8 |
| D | 1 | 20 | 958009 | 5312.71 | 747 | 726 | 180.2 |
| D | 1 | 239 | 285814 | 1582.18 | 747 | 726 | 180.2 |
| D | 5 | 222 | 177800 | 982.72 | 747 | 726 | 180.2 |
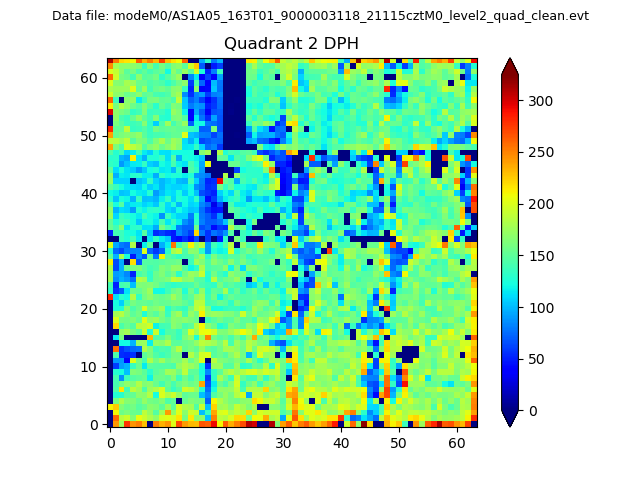
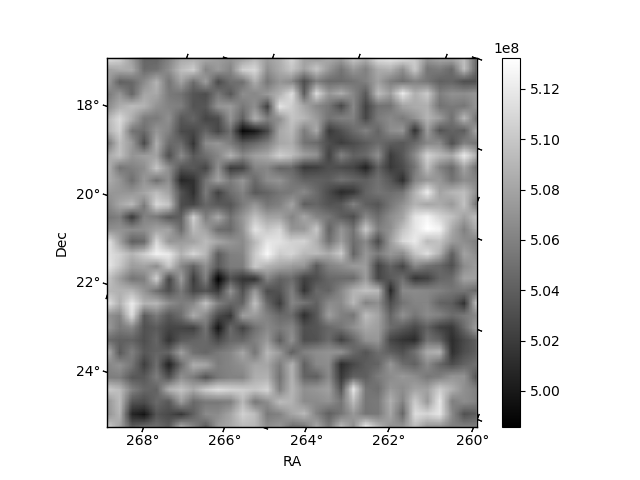
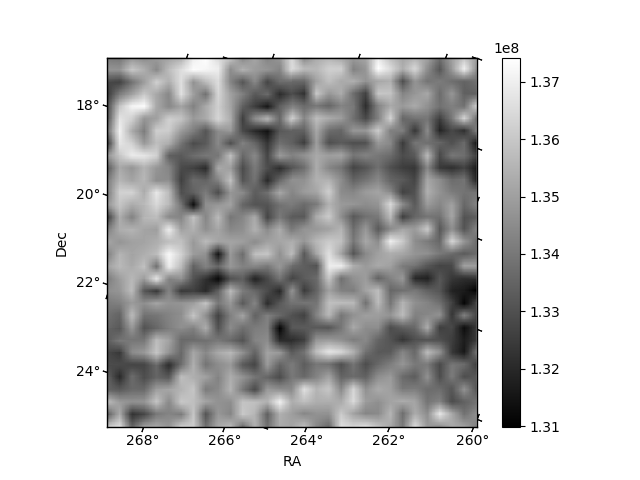
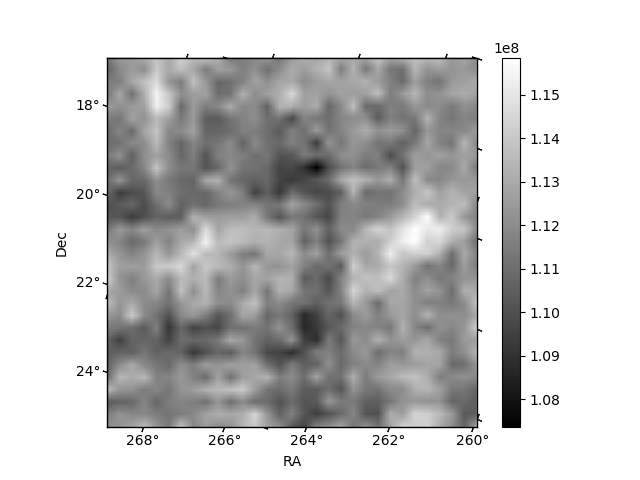
Histogram calculated using DETX and DETY for each event in the final _common_clean file
| Quadrant A | 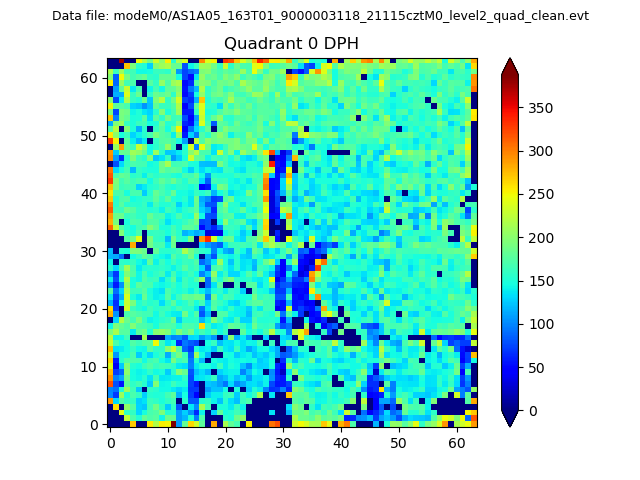 |
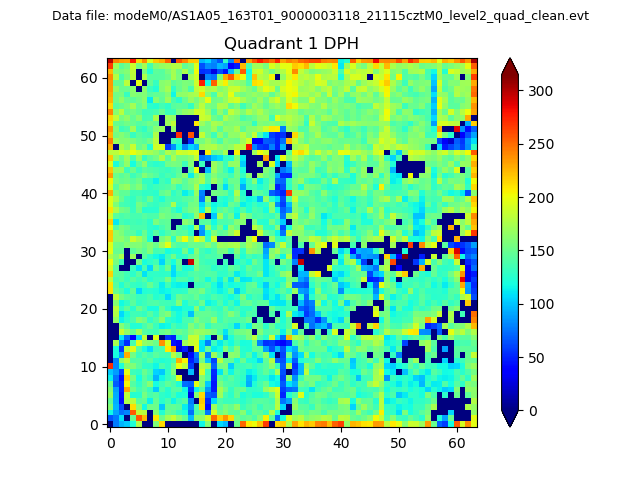 |
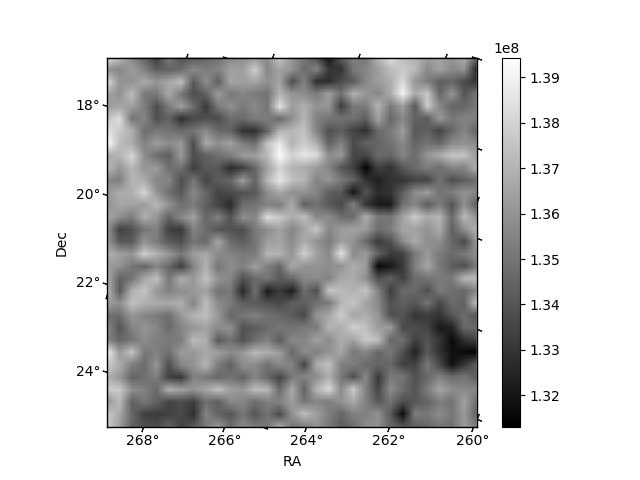
Quadrant B |
|---|---|---|---|
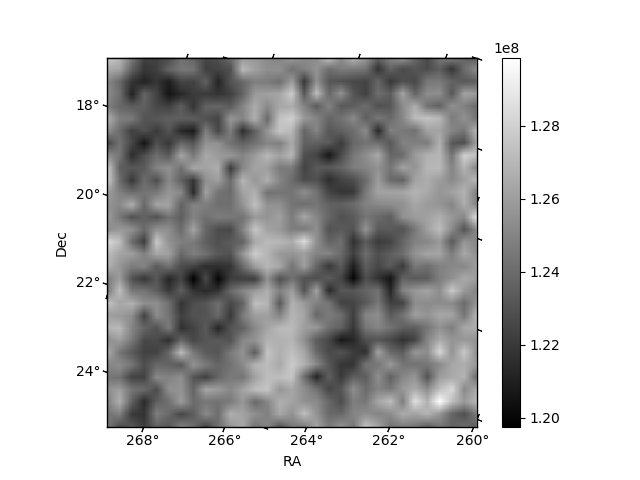
| Quadrant D | 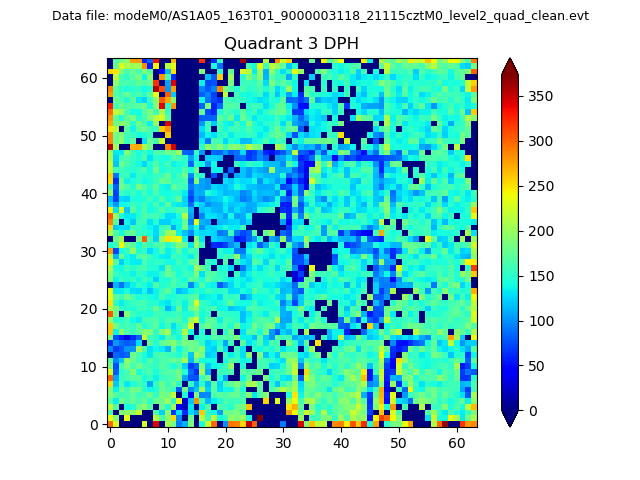 |
 |
Quadrant C |
| Plot type | Count rate plots | Images |
|---|---|---|
| Comparison with Poisson distribution Blue bars denote a histogram of data divided into 1 sec bins. Red curve is a Poisson curve with rate = median count rate of data. |
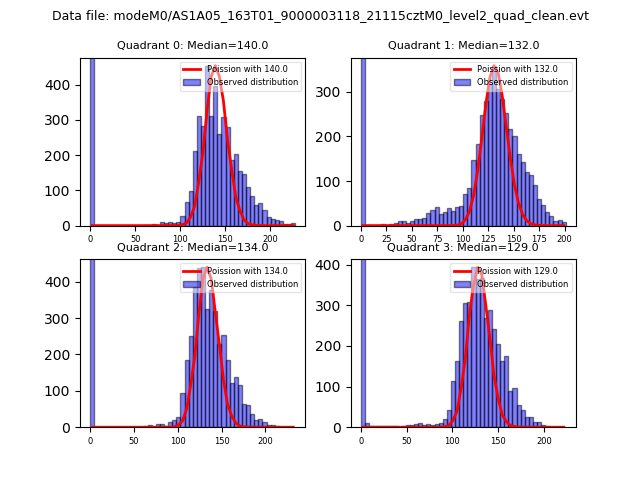 |
 |
| Quadrant-wise count rates Data is divided into 100 sec bins |
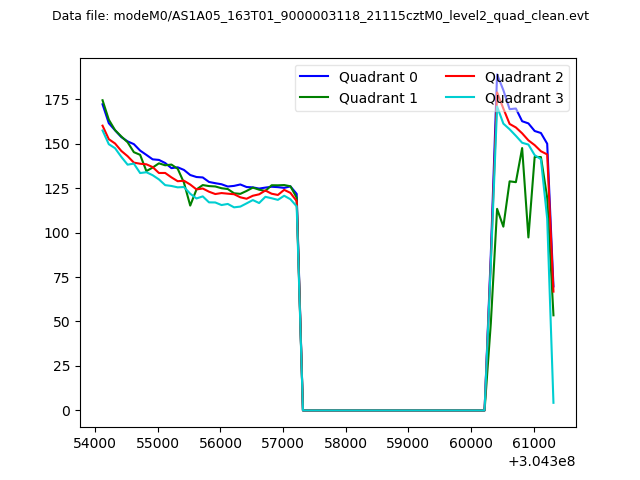 |
|
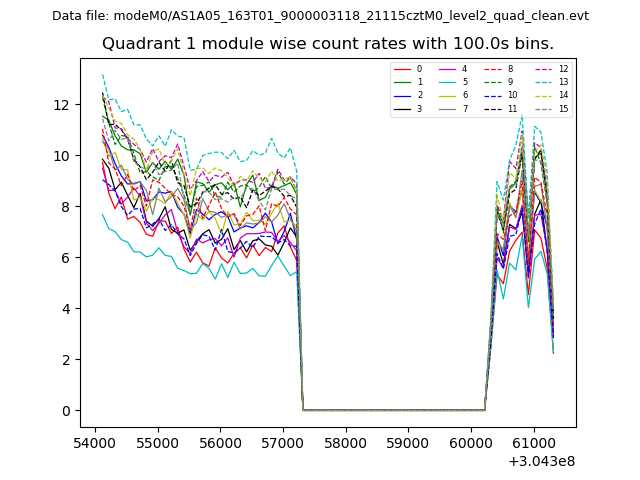
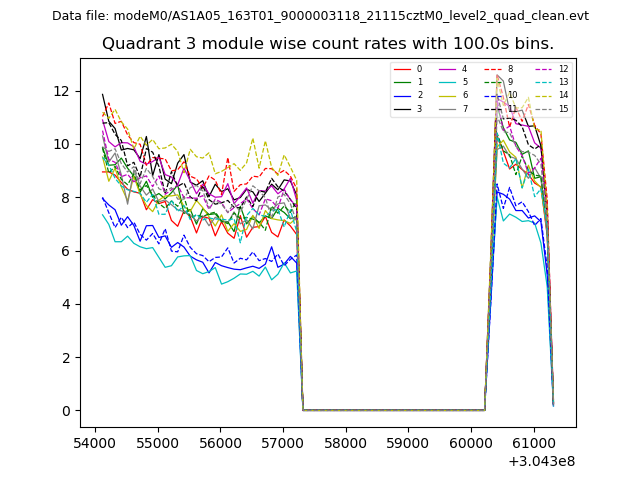
| Module-wise count rates for Quadrant A Data is divided into 100 sec bins |
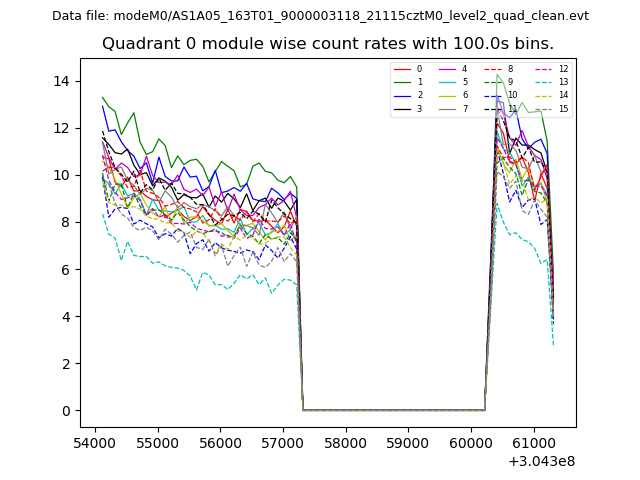 |
 |
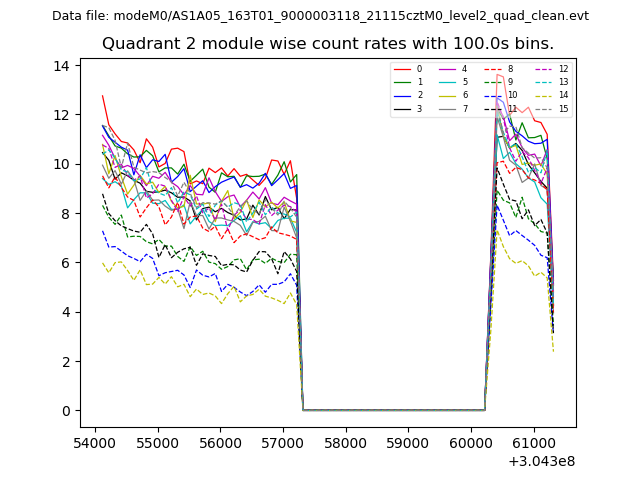
| Module-wise count rates for Quadrant B Data is divided into 100 sec bins |
 |
 |
| Module-wise count rates for Quadrant C Data is divided into 100 sec bins |
 |
 |
| Module-wise count rates for Quadrant D Data is divided into 100 sec bins |
 |
 |
| Parameter | Plot |
|---|---|
| CZT HV Monitor | 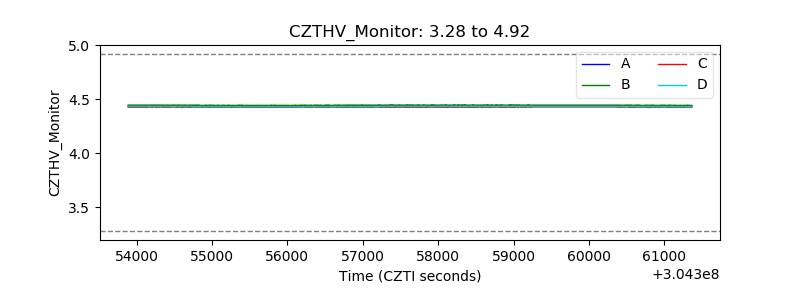 |
| D_VDD | 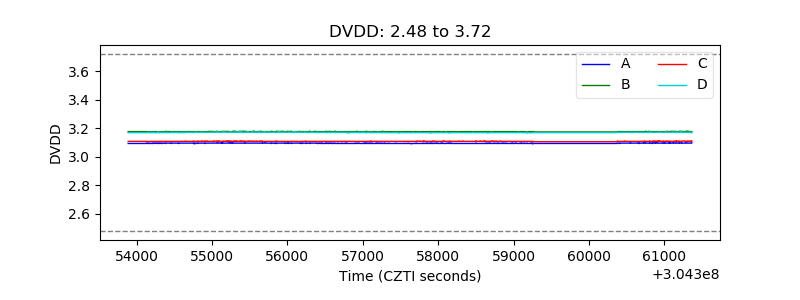 |
| Temperature 1 | 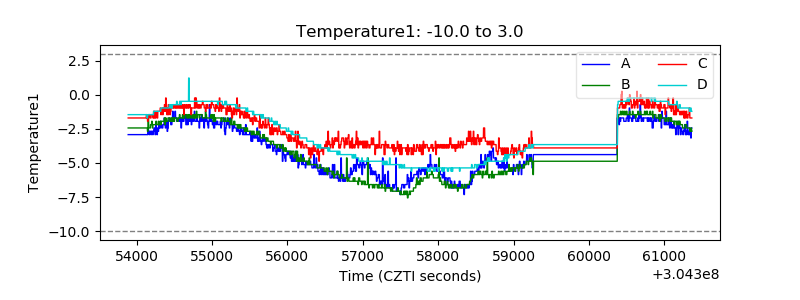 |
| Veto HV Monitor | 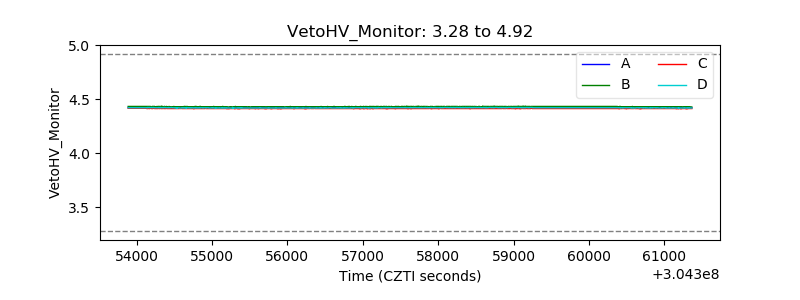 |
| Veto LLD | 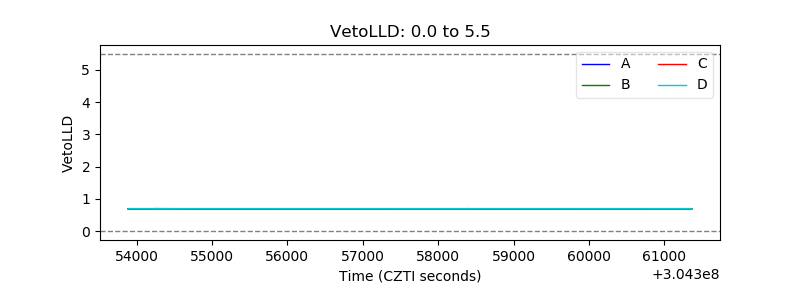 |
| Alpha Counter | 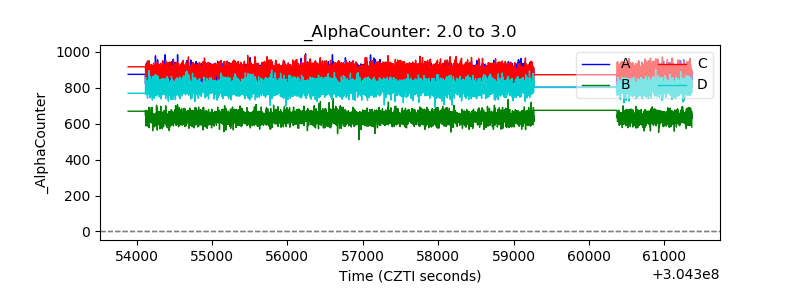 |
| _CPM_Rate | 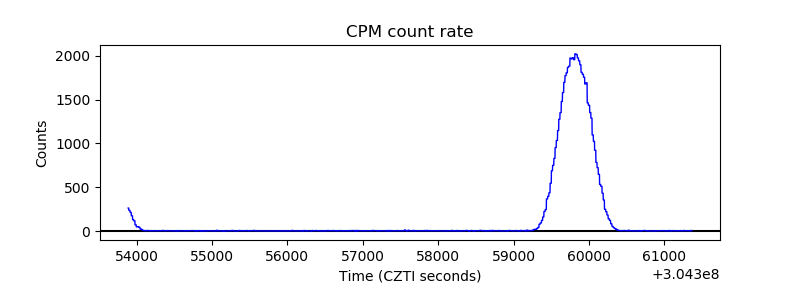 |
| CZT Counter | 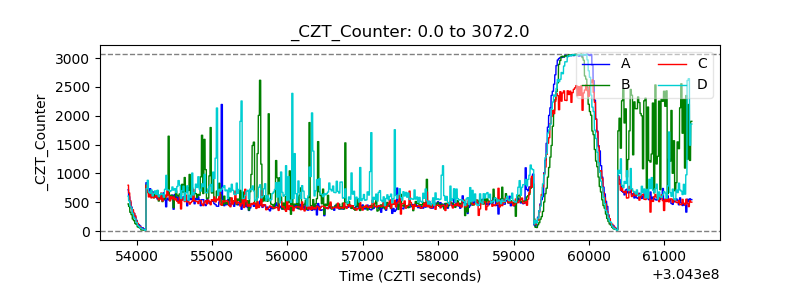 |
| +2.5 Volts monitor |  |
| +5 Volts monitor |  |
| _ROLL_ROT | 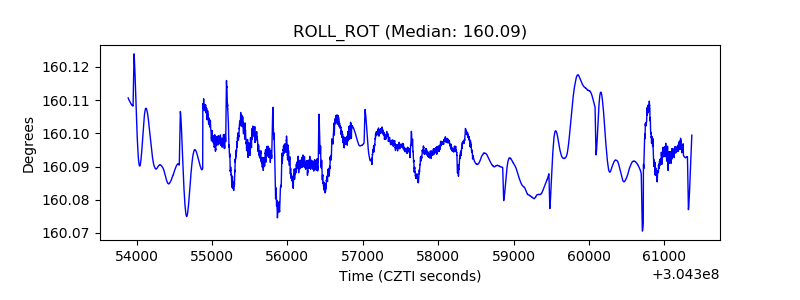 |
| _Roll_DEC | 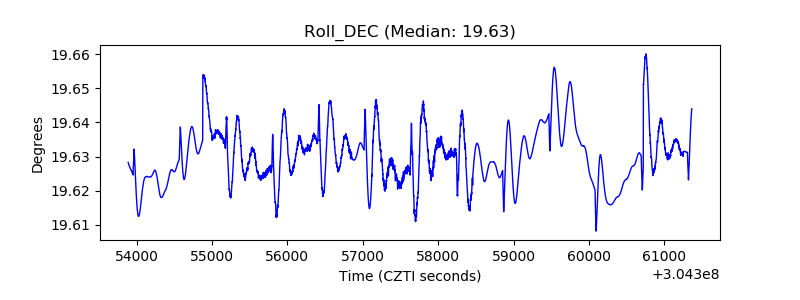 |
| _Roll_RA | 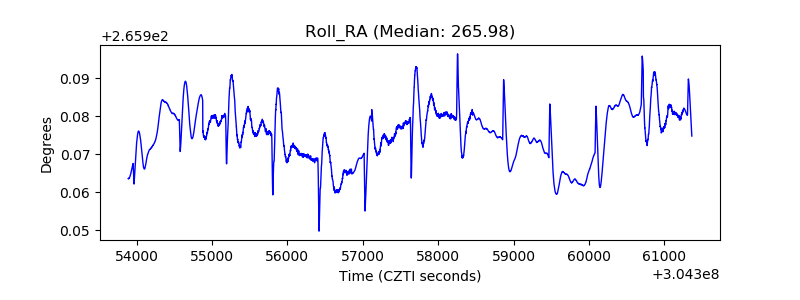 |
| Veto Counter | 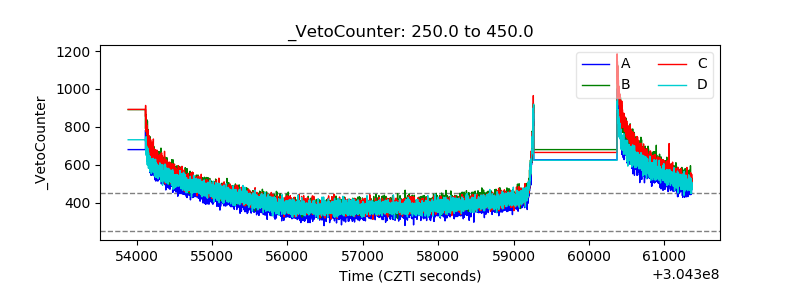 |