| Param | Original file | Final file |
|---|---|---|
| Filename | modeM0/AS1A05_163T01_9000003118_21268cztM0_level2.evt | modeM0/AS1A05_163T01_9000003118_21268cztM0_level2_quad_clean.evt |
| Size (bytes) | 58,383,360 | 14,034,240 |
| Size | 55.7 MB | 13.4 MB |
| Events in quadrant A | 349,799 | 98,523 |
| Events in quadrant B | 365,371 | 99,157 |
| Events in quadrant C | 349,534 | 94,350 |
| Events in quadrant D | 646,993 | 70,426 |
| Mode M9 | |||
|---|---|---|---|
| Quadrant | BADHDUFLAG | Total packets | Discarded packets |
| A | 0 | 1 | 1 |
| B | 1 | 1 | 1 |
| C | 1 | -1 | -1 |
| D | 1 | -1 | -1 |
| Mode M0 | |||
|---|---|---|---|
| Quadrant | BADHDUFLAG | Total packets | Discarded packets |
| A | 0 | 2518 | 872 |
| B | 0 | 2540 | 896 |
| C | 0 | 2514 | 909 |
| D | 0 | 5533 | 3138 |
| Mode SS | |||
|---|---|---|---|
| Quadrant | BADHDUFLAG | Total packets | Discarded packets |
| A | 0 | 24 | 6 |
| B | 0 | 27 | 7 |
| C | 0 | 25 | 8 |
| D | 0 | 26 | 10 |
| Quadrant | Total seconds | Saturated seconds | Saturation percentage |
|---|---|---|---|
| A | 821 | 0 | 0.000000% |
| B | 812 | 0 | 0.000000% |
| C | 802 | 2 | 0.249377% |
| D | 661 | 77 | 11.649017% |
Noise dominated data is calculated using 1-second bins in cleaned event files. If a bin has >2000 counts, and if more than 50% of those come from <1% of pixels, then it is considered to be noise-dominated and hence unusable.
| Quadrant | # 1 sec bins | Bins with >0 counts | Bins with >2000 counts | High rate bins dominated by noise | Noise dominated (total time) | Noise dominated (detector-on time) | Marked lightcurve |
|---|---|---|---|---|---|---|---|
| A | 1260 | 979 | 0 | 0 | 0.00% | 0.00% | 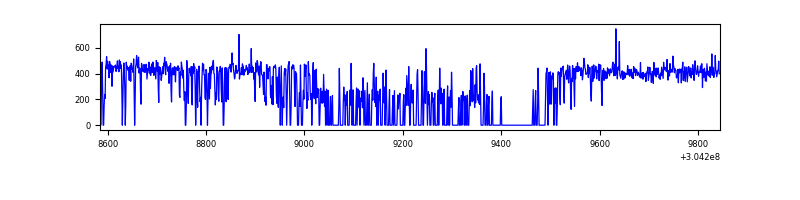 |
| B | 1260 | 963 | 0 | 0 | 0.00% | 0.00% | 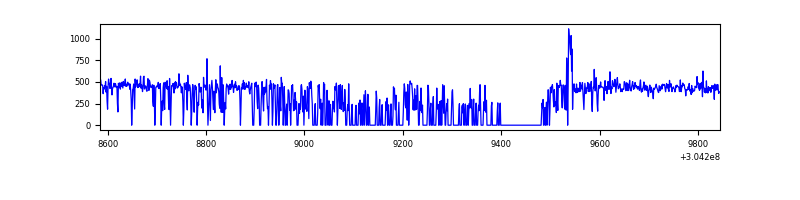 |
| C | 1260 | 965 | 0 | 0 | 0.00% | 0.00% | 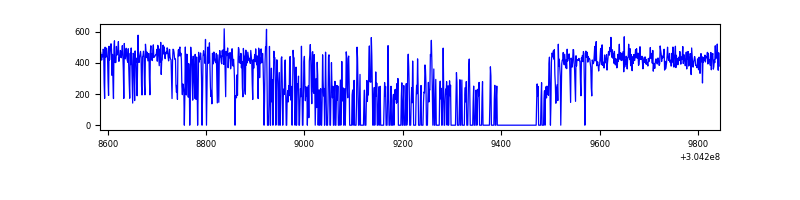 |
| D | 1260 | 775 | 53 | 53 | 4.21% | 6.84% | 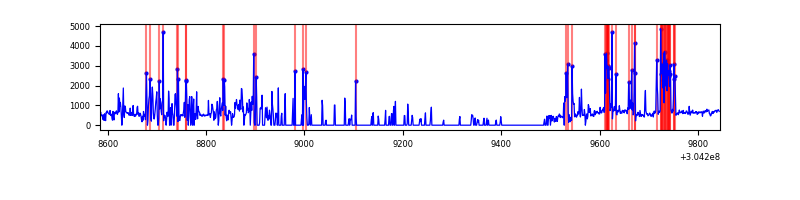 |
Top three noisy pixels from each quadrant. If the there are fewer than three noisy pixels in the level2.evt file, extra rows are filled as -1
| Pixel properties | Quadrant properties | ||||||
|---|---|---|---|---|---|---|---|
| Quadrant | DetID | PixID | Counts | Sigma | Mean | Median | Sigma |
| A | 13 | 254 | 1296 | 58.48 | 90 | 88 | 20.7 |
| A | 0 | 226 | 760 | 32.53 | 90 | 88 | 20.7 |
| A | 3 | 137 | 756 | 32.34 | 90 | 88 | 20.7 |
| B | 3 | 64 | 6293 | 312.11 | 91 | 89 | 19.9 |
| B | 12 | 111 | 2040 | 98.15 | 91 | 89 | 19.9 |
| B | 0 | 230 | 1847 | 88.44 | 91 | 89 | 19.9 |
| C | 14 | 238 | 13688 | 619.15 | 86 | 86 | 22.0 |
| C | 13 | 61 | 571 | 22.08 | 86 | 86 | 22.0 |
| C | 3 | 202 | 211 | 5.69 | 86 | 86 | 22.0 |
| D | 1 | 52 | 318948 | 17511.65 | 66 | 64 | 18.2 |
| D | 13 | 174 | 54012 | 2962.58 | 66 | 64 | 18.2 |
| D | 2 | 120 | 4589 | 248.49 | 66 | 64 | 18.2 |
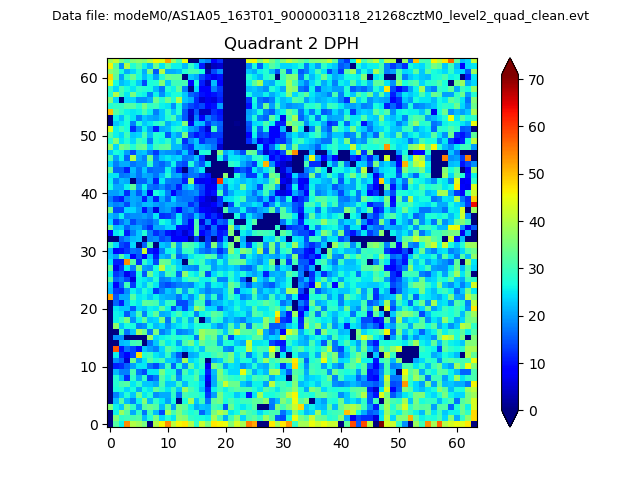
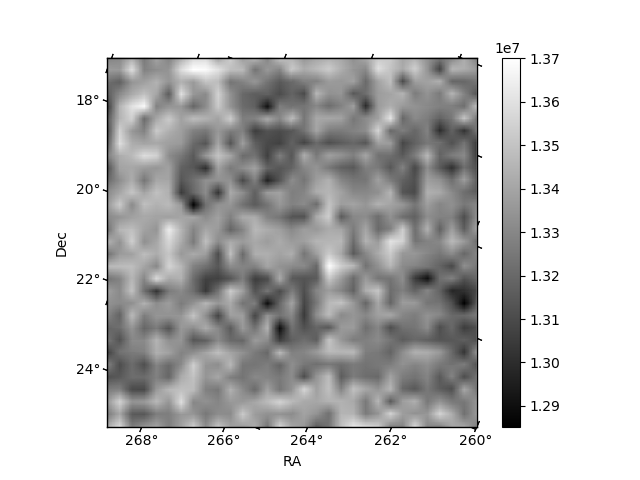
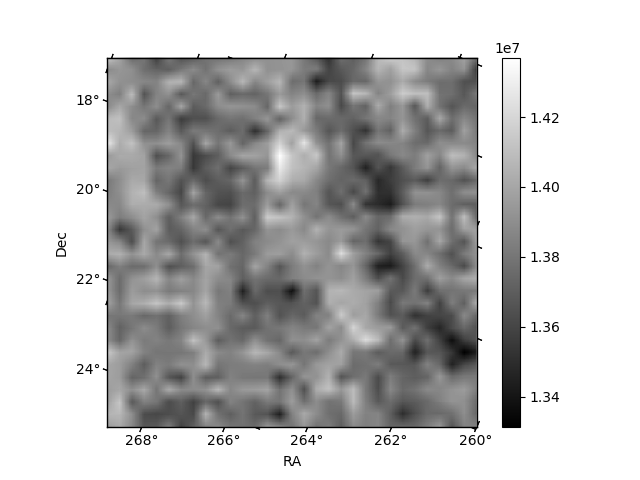
Histogram calculated using DETX and DETY for each event in the final _common_clean file
| Quadrant A | 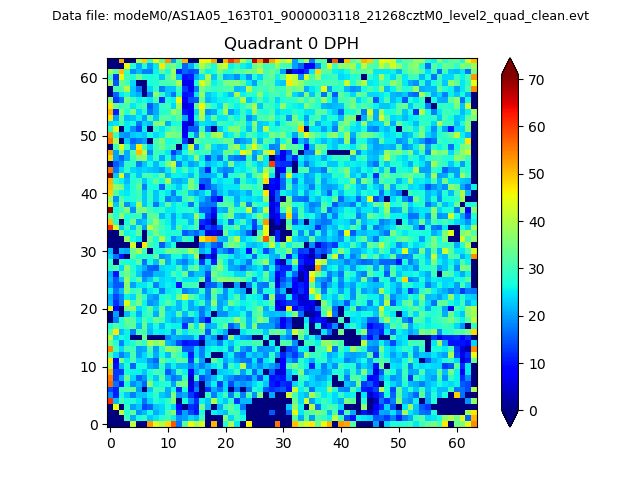 |
 |
Quadrant B |
|---|---|---|---|
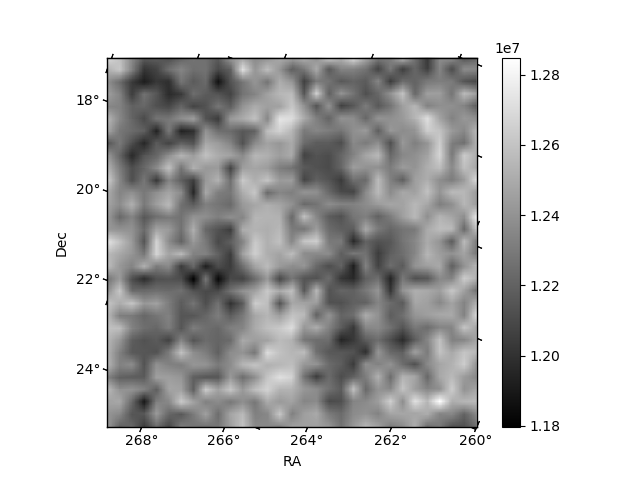
| Quadrant D |  |
 |
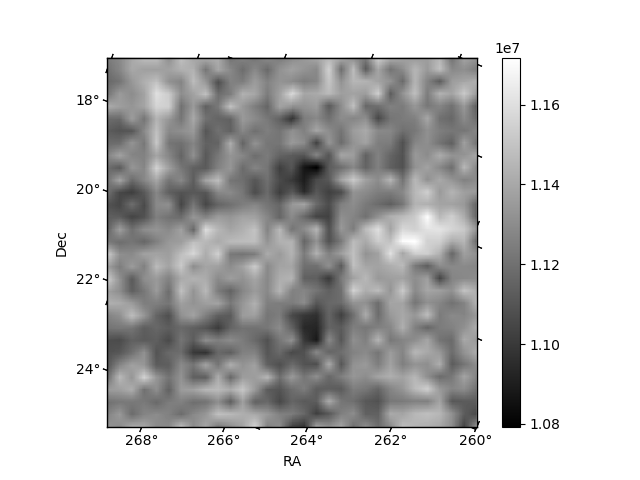
Quadrant C |
| Plot type | Count rate plots | Images |
|---|---|---|
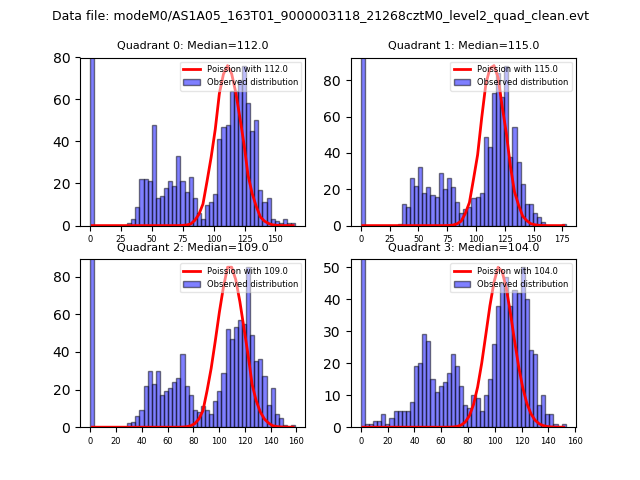
| Comparison with Poisson distribution Blue bars denote a histogram of data divided into 1 sec bins. Red curve is a Poisson curve with rate = median count rate of data. |
 |
 |
| Quadrant-wise count rates Data is divided into 100 sec bins |
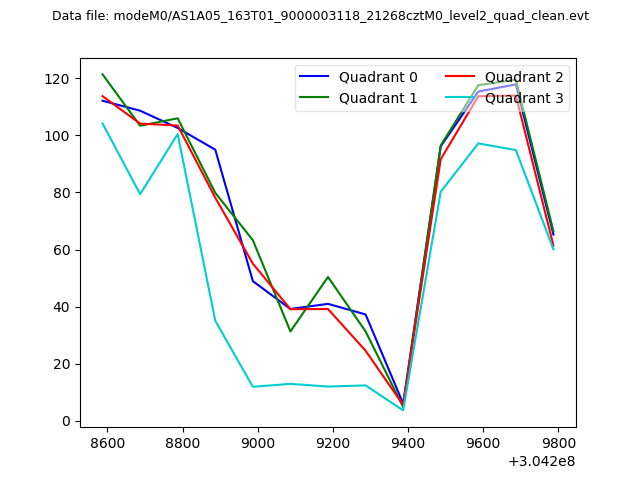 |
|
| Module-wise count rates for Quadrant A Data is divided into 100 sec bins |
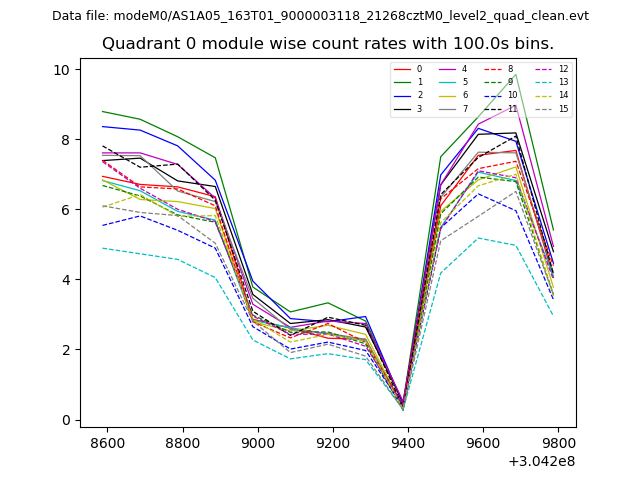 |
 |
| Module-wise count rates for Quadrant B Data is divided into 100 sec bins |
 |
 |
| Module-wise count rates for Quadrant C Data is divided into 100 sec bins |
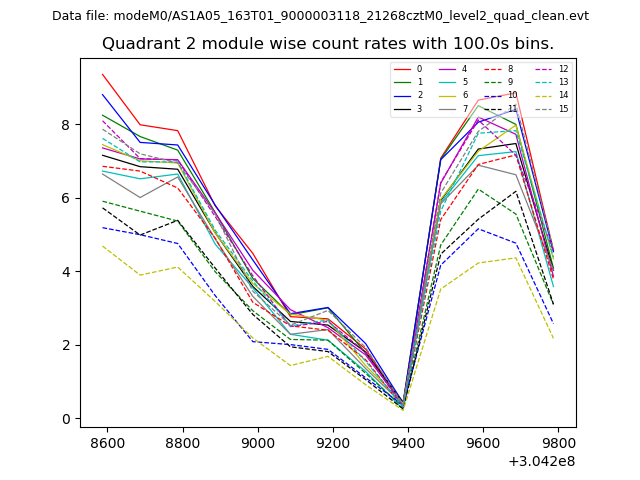 |
 |
| Module-wise count rates for Quadrant D Data is divided into 100 sec bins |
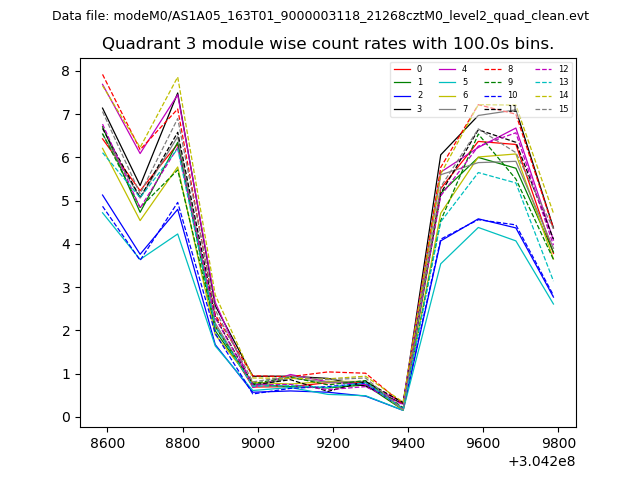 |
 |
| Parameter | Plot |
|---|---|
| CZT HV Monitor |  |
| D_VDD | 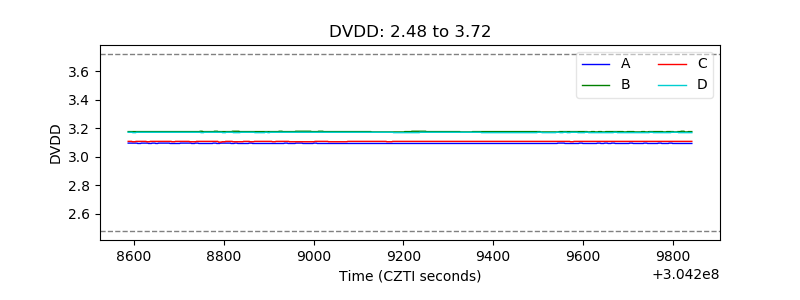 |
| Temperature 1 | 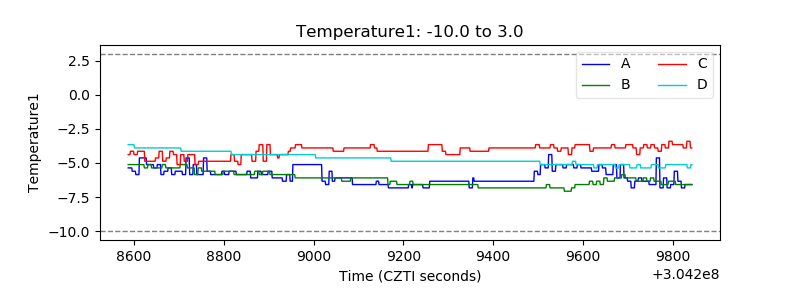 |
| Veto HV Monitor | 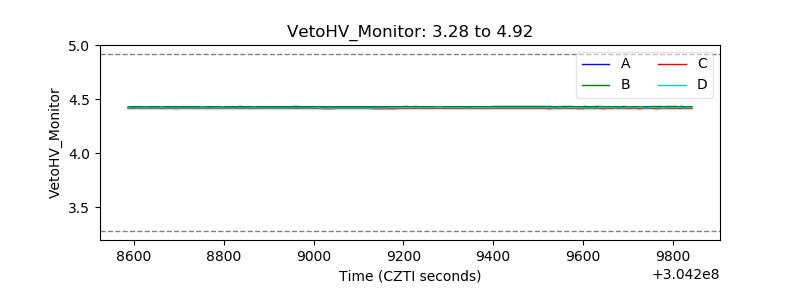 |
| Veto LLD | 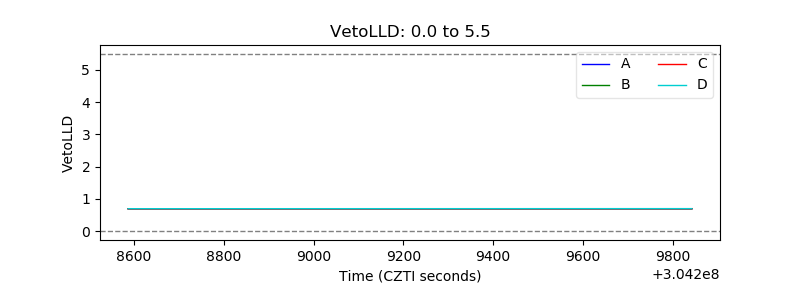 |
| Alpha Counter | 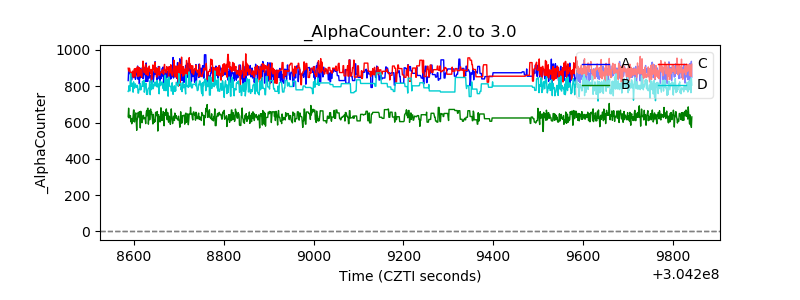 |
| _CPM_Rate | 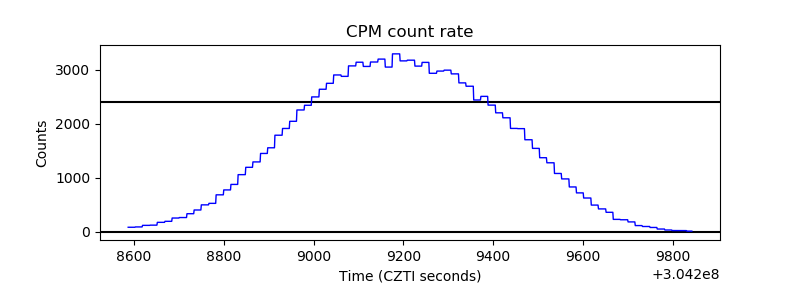 |
| CZT Counter | 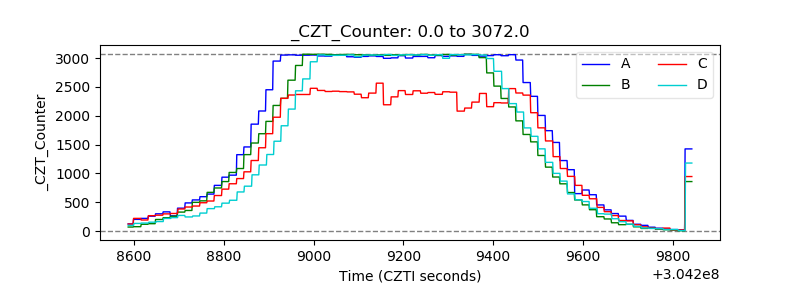 |
| +2.5 Volts monitor |  |
| +5 Volts monitor | 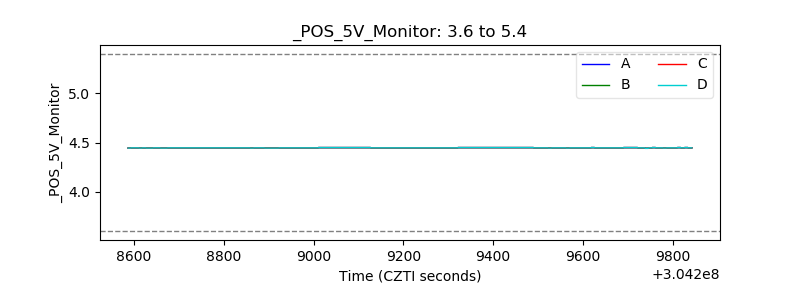 |
| _ROLL_ROT | 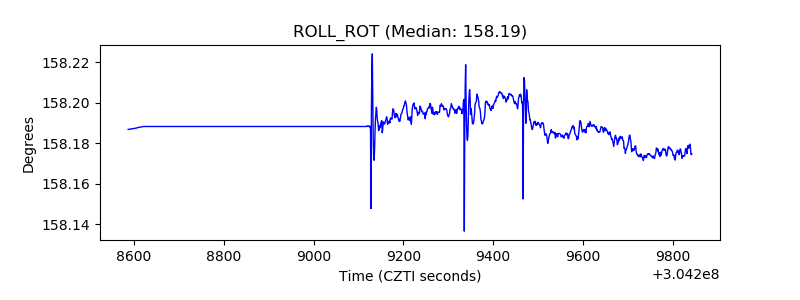 |
| _Roll_DEC | 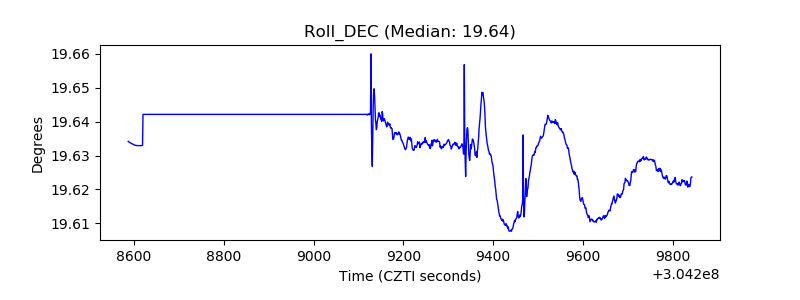 |
| _Roll_RA | 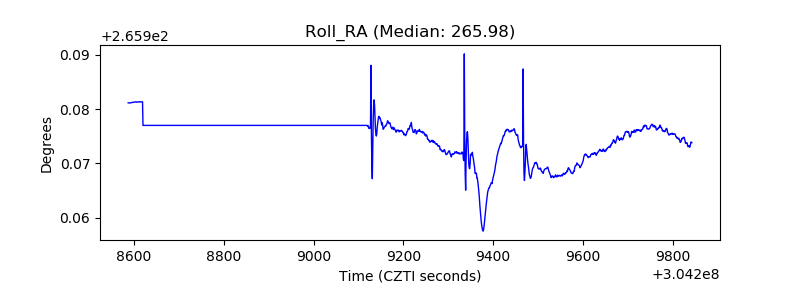 |
| Veto Counter | 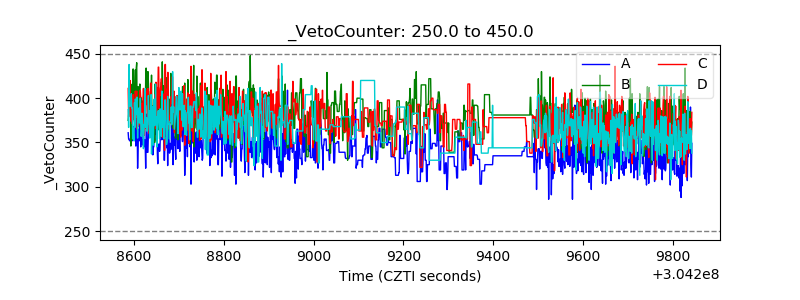 |