| Param | Original file | Final file |
|---|---|---|
| Filename | modeM0/AS1A05_163T01_9000003118_21273cztM0_level2.evt | modeM0/AS1A05_163T01_9000003118_21273cztM0_level2_quad_clean.evt |
| Size (bytes) | 113,420,160 | 17,231,040 |
| Size | 108.2 MB | 16.4 MB |
| Events in quadrant A | 723,197 | 110,426 |
| Events in quadrant B | 725,905 | 114,615 |
| Events in quadrant C | 713,489 | 101,961 |
| Events in quadrant D | 1,186,223 | 101,733 |
| Mode M9 | |||
|---|---|---|---|
| Quadrant | BADHDUFLAG | Total packets | Discarded packets |
| A | 0 | 10 | 0 |
| B | 0 | 10 | 0 |
| C | 0 | 10 | 0 |
| D | 0 | 10 | 0 |
| Mode M0 | |||
|---|---|---|---|
| Quadrant | BADHDUFLAG | Total packets | Discarded packets |
| A | 0 | 3413 | 501 |
| B | 0 | 3412 | 491 |
| C | 0 | 3396 | 516 |
| D | 0 | 5493 | 1211 |
| Mode SS | |||
|---|---|---|---|
| Quadrant | BADHDUFLAG | Total packets | Discarded packets |
| A | 0 | 32 | 6 |
| B | 0 | 32 | 4 |
| C | 0 | 32 | 6 |
| D | 0 | 31 | 4 |
| Quadrant | Total seconds | Saturated seconds | Saturation percentage |
|---|---|---|---|
| A | 1230 | 43 | 3.495935% |
| B | 1232 | 45 | 3.652597% |
| C | 1222 | 41 | 3.355155% |
| D | 1216 | 233 | 19.161184% |
Noise dominated data is calculated using 1-second bins in cleaned event files. If a bin has >2000 counts, and if more than 50% of those come from <1% of pixels, then it is considered to be noise-dominated and hence unusable.
| Quadrant | # 1 sec bins | Bins with >0 counts | Bins with >2000 counts | High rate bins dominated by noise | Noise dominated (total time) | Noise dominated (detector-on time) | Marked lightcurve |
|---|---|---|---|---|---|---|---|
| A | 2469 | 1262 | 0 | 0 | 0.00% | 0.00% | 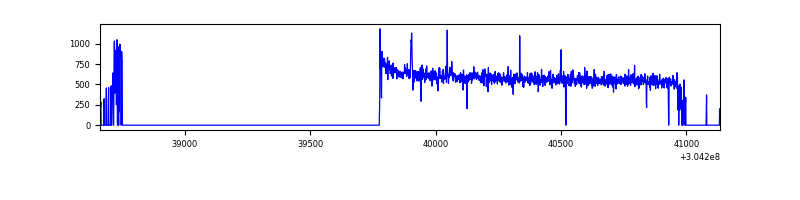 |
| B | 2359 | 1271 | 1 | 1 | 0.04% | 0.08% | 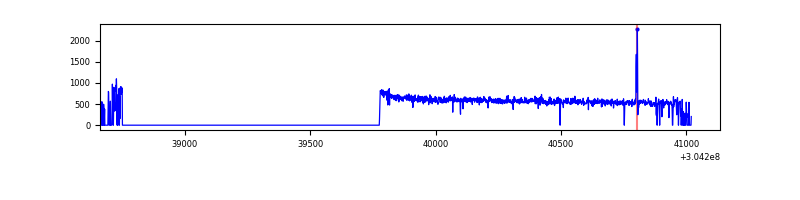 |
| C | 2456 | 1258 | 0 | 0 | 0.00% | 0.00% | 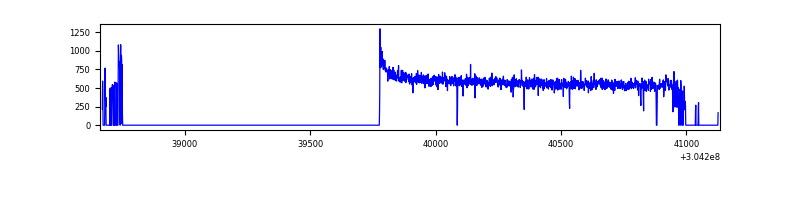 |
| D | 2445 | 1239 | 153 | 153 | 6.26% | 12.35% | 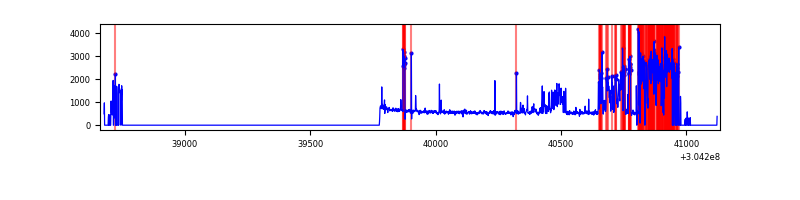 |
Top three noisy pixels from each quadrant. If the there are fewer than three noisy pixels in the level2.evt file, extra rows are filled as -1
| Pixel properties | Quadrant properties | ||||||
|---|---|---|---|---|---|---|---|
| Quadrant | DetID | PixID | Counts | Sigma | Mean | Median | Sigma |
| A | 15 | 236 | 3019 | 72.56 | 186 | 183 | 39.1 |
| A | 12 | 96 | 2397 | 56.64 | 186 | 183 | 39.1 |
| A | 13 | 254 | 1945 | 45.08 | 186 | 183 | 39.1 |
| B | 3 | 64 | 6658 | 174.12 | 184 | 179 | 37.2 |
| B | 12 | 111 | 4316 | 111.18 | 184 | 179 | 37.2 |
| B | 11 | 111 | 3719 | 95.13 | 184 | 179 | 37.2 |
| C | 14 | 238 | 27794 | 664.48 | 173 | 174 | 41.6 |
| C | 3 | 233 | 6222 | 145.5 | 173 | 174 | 41.6 |
| C | 0 | 10 | 3114 | 70.73 | 173 | 174 | 41.6 |
| D | 13 | 174 | 503058 | 11849.92 | 165 | 159 | 42.4 |
| D | 13 | 104 | 40644 | 953.96 | 165 | 159 | 42.4 |
| D | 1 | 52 | 10953 | 254.34 | 165 | 159 | 42.4 |
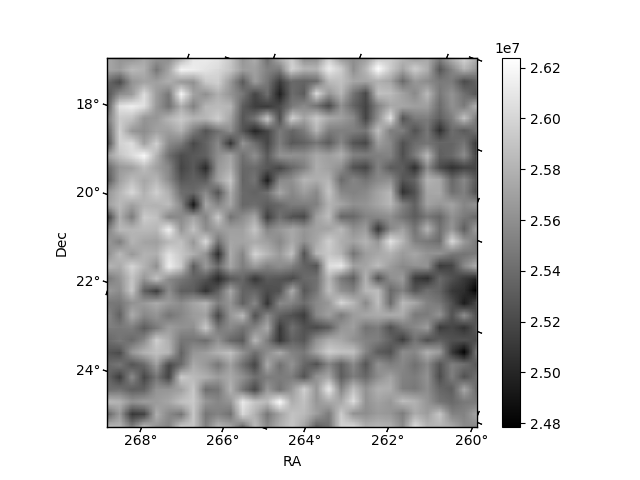
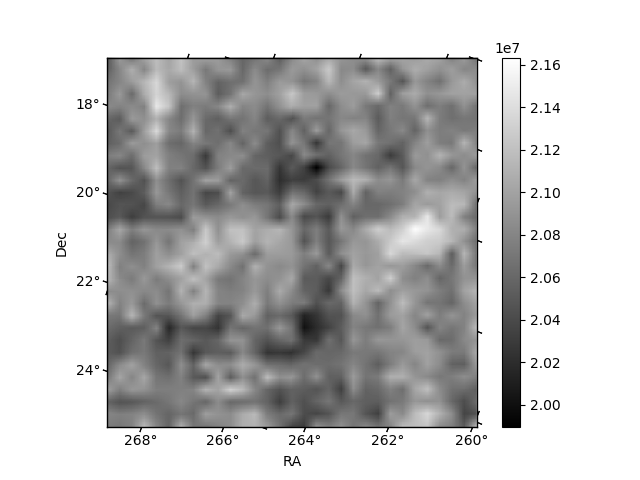
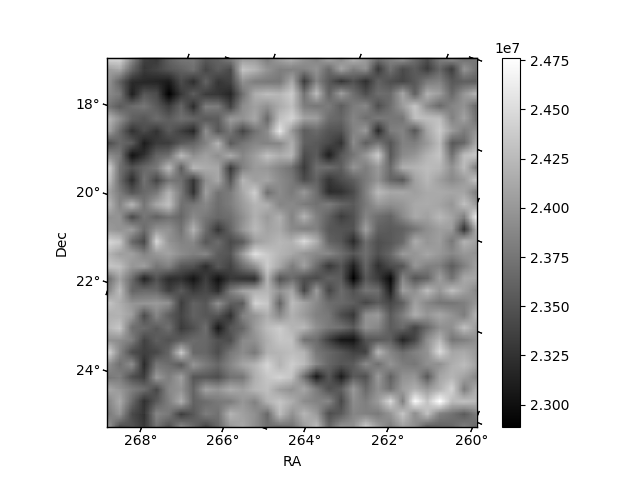
Histogram calculated using DETX and DETY for each event in the final _common_clean file
| Quadrant A | 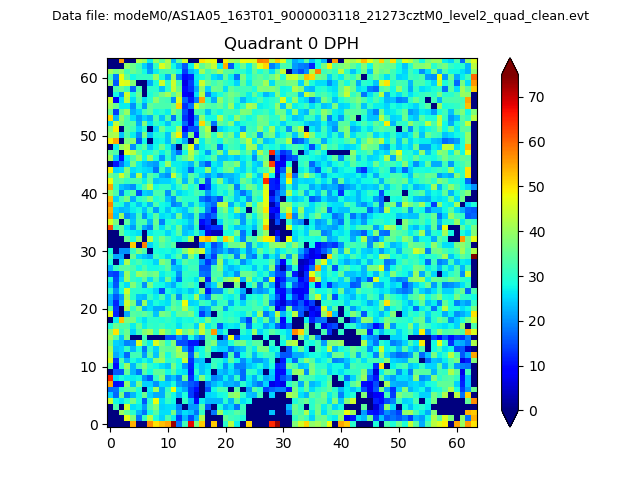 |
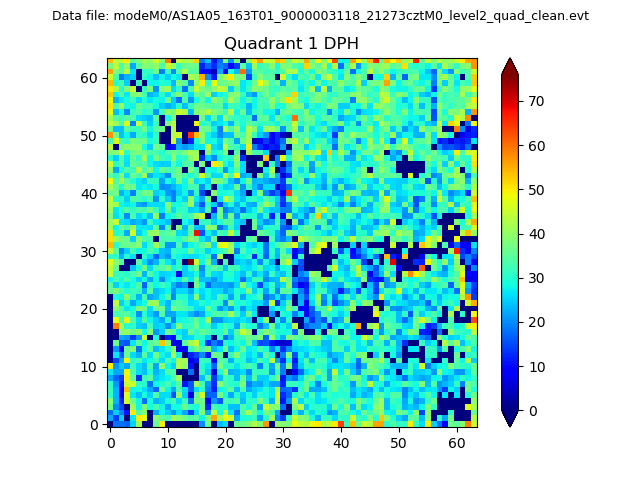 |
Quadrant B |
|---|---|---|---|
| Quadrant D | 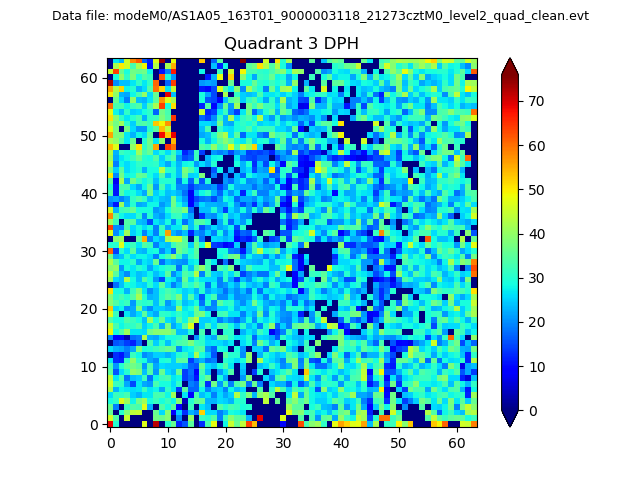 |
 |
Quadrant C |
| Plot type | Count rate plots | Images |
|---|---|---|
| Comparison with Poisson distribution Blue bars denote a histogram of data divided into 1 sec bins. Red curve is a Poisson curve with rate = median count rate of data. |
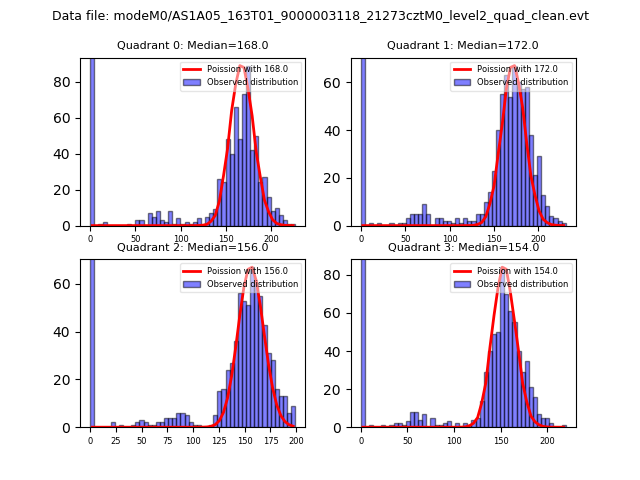 |
 |
| Quadrant-wise count rates Data is divided into 100 sec bins |
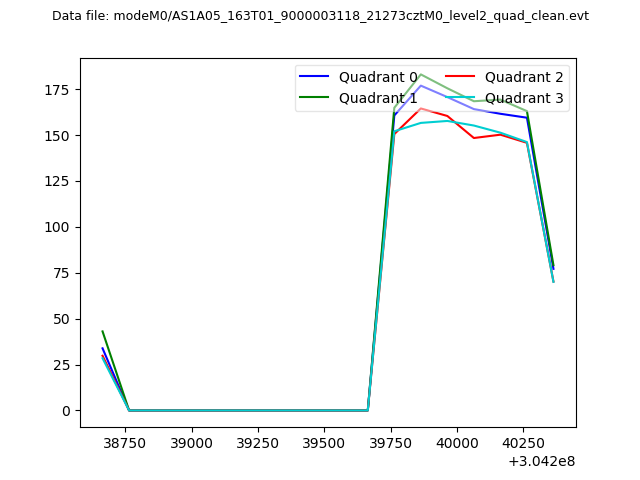 |
|
| Module-wise count rates for Quadrant A Data is divided into 100 sec bins |
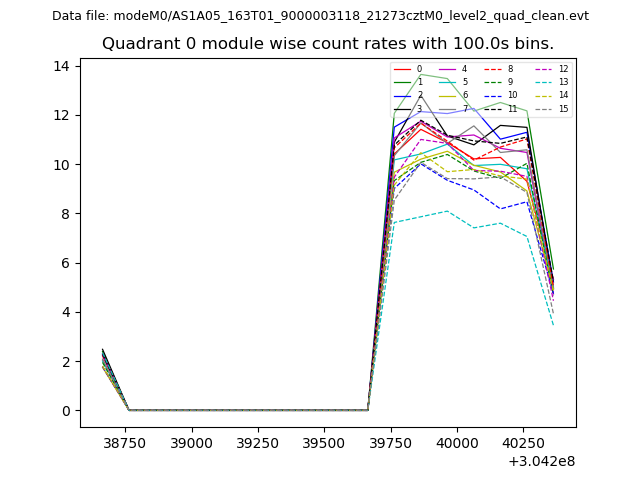 |
 |
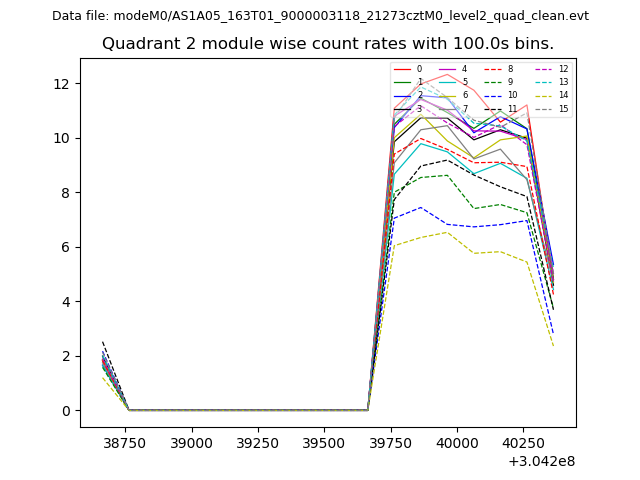
| Module-wise count rates for Quadrant B Data is divided into 100 sec bins |
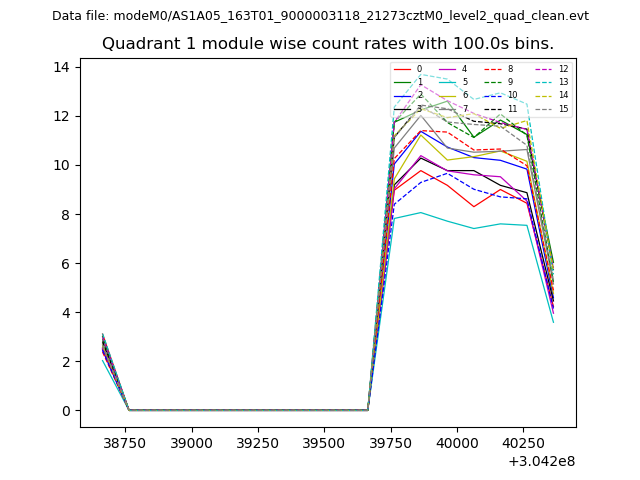 |
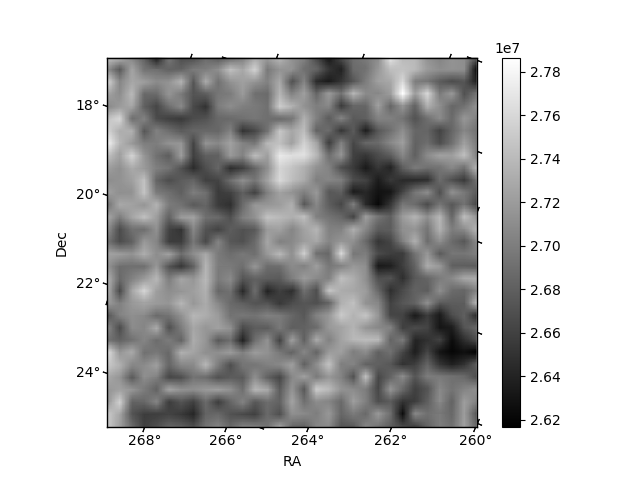 |
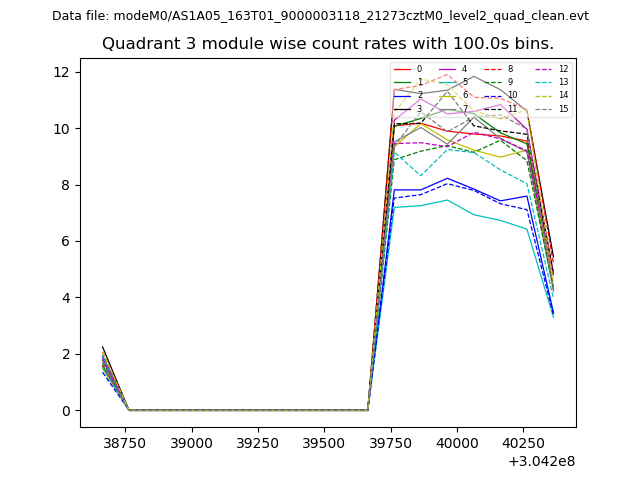
| Module-wise count rates for Quadrant C Data is divided into 100 sec bins |
 |
 |
| Module-wise count rates for Quadrant D Data is divided into 100 sec bins |
 |
 |
| Parameter | Plot |
|---|---|
| CZT HV Monitor | 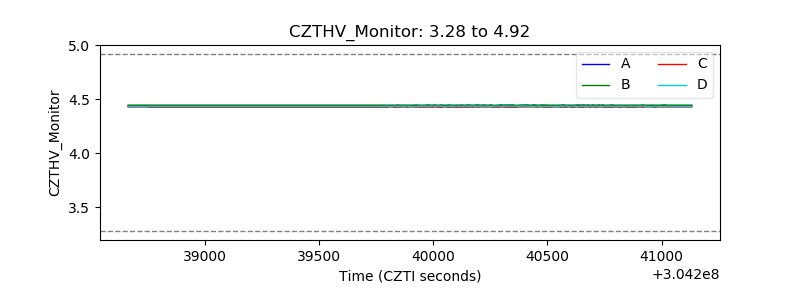 |
| D_VDD | 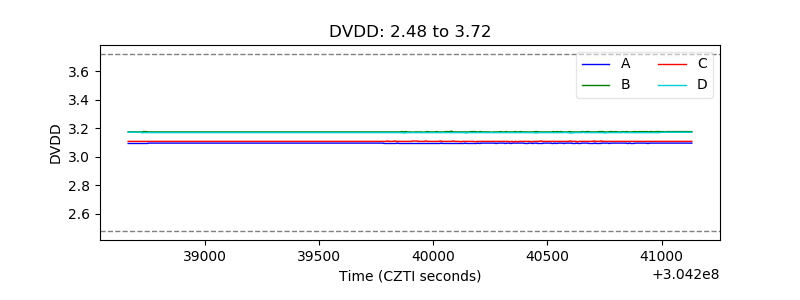 |
| Temperature 1 | 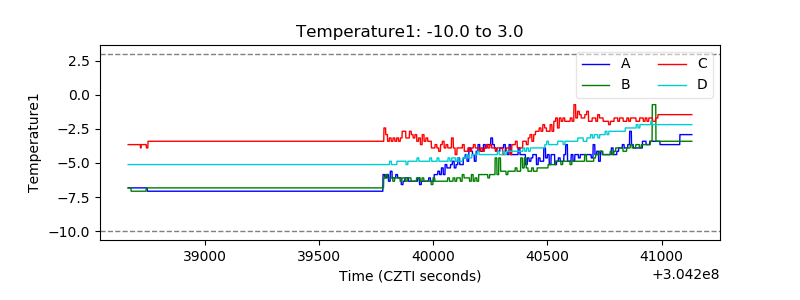 |
| Veto HV Monitor | 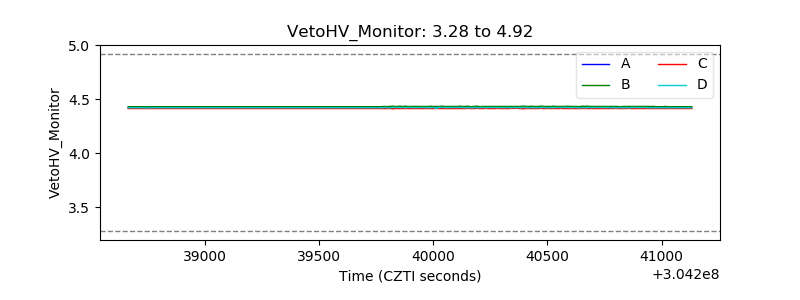 |
| Veto LLD | 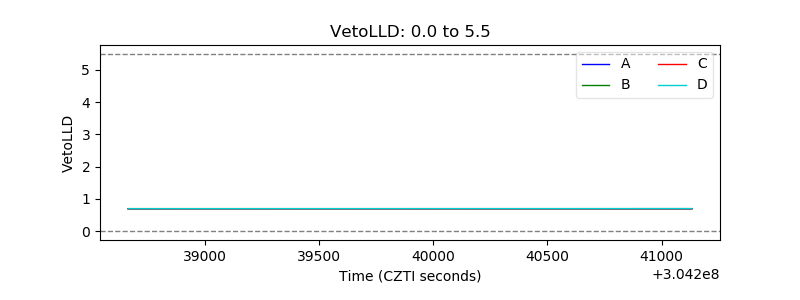 |
| Alpha Counter | 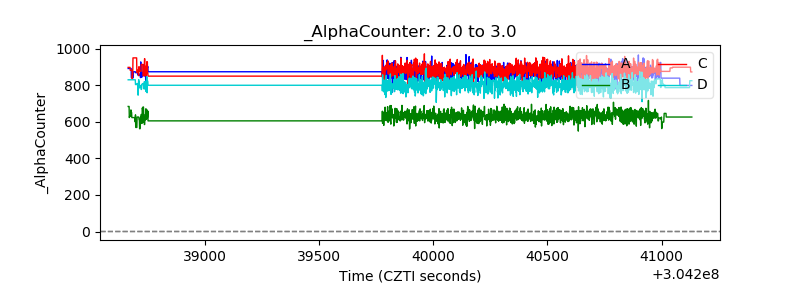 |
| _CPM_Rate | 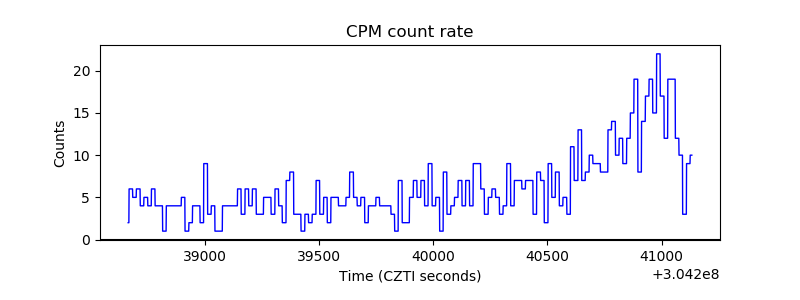 |
| CZT Counter |  |
| +2.5 Volts monitor |  |
| +5 Volts monitor | 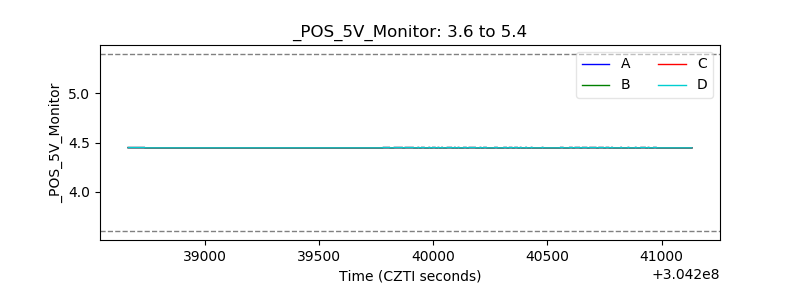 |
| _ROLL_ROT | 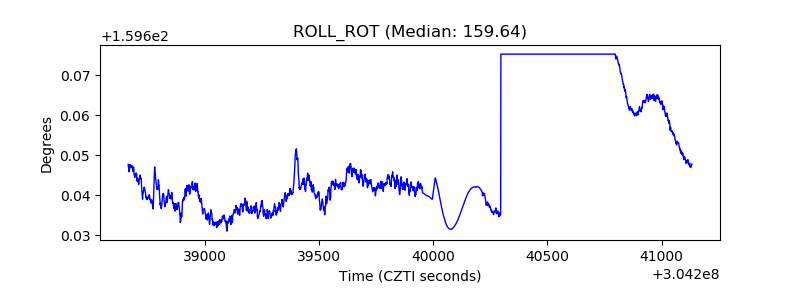 |
| _Roll_DEC | 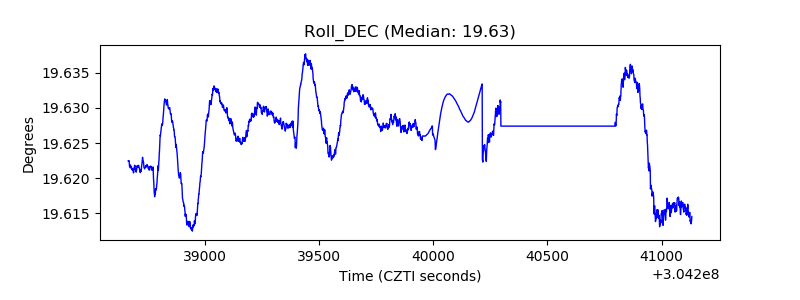 |
| _Roll_RA | 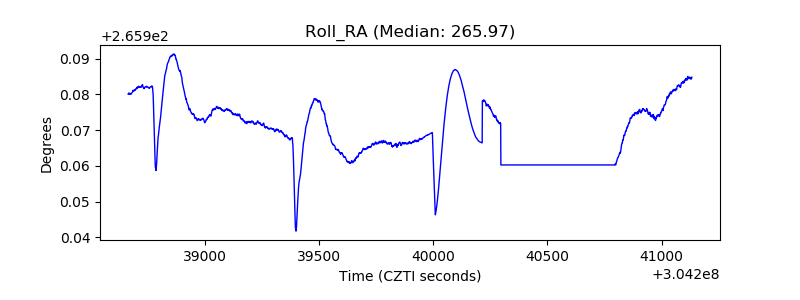 |
| Veto Counter | 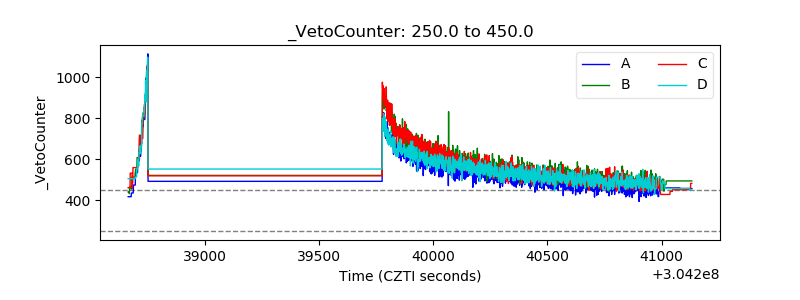 |