| Param | Original file | Final file |
|---|---|---|
| Filename | modeM0/AS1A05_104T05_9000003120_21116cztM0_level2.evt | modeM0/AS1A05_104T05_9000003120_21116cztM0_level2_quad_clean.evt |
| Size (bytes) | 457,842,240 | 60,940,800 |
| Size | 436.6 MB | 58.1 MB |
| Events in quadrant A | 2,428,553 | 406,200 |
| Events in quadrant B | 4,854,168 | 354,063 |
| Events in quadrant C | 2,390,105 | 384,440 |
| Events in quadrant D | 3,863,651 | 359,574 |
| Mode SS | |||
|---|---|---|---|
| Quadrant | BADHDUFLAG | Total packets | Discarded packets |
| A | 0 | 98 | 0 |
| B | 0 | 98 | 0 |
| C | 0 | 98 | 0 |
| D | 0 | 98 | 0 |
| Mode M9 | |||
|---|---|---|---|
| Quadrant | BADHDUFLAG | Total packets | Discarded packets |
| A | 0 | 12 | 0 |
| B | 0 | 12 | 0 |
| C | 0 | 12 | 0 |
| D | 0 | 12 | 0 |
| Mode M0 | |||
|---|---|---|---|
| Quadrant | BADHDUFLAG | Total packets | Discarded packets |
| A | 0 | 10393 | 1 |
| B | 0 | 17569 | 3 |
| C | 0 | 10155 | 1 |
| D | 0 | 14947 | 1 |
| Quadrant | Total seconds | Saturated seconds | Saturation percentage |
|---|---|---|---|
| A | 4852 | 14 | 0.288541% |
| B | 4851 | 1006 | 20.737992% |
| C | 4851 | 34 | 0.700886% |
| D | 4851 | 184 | 3.793032% |
Noise dominated data is calculated using 1-second bins in cleaned event files. If a bin has >2000 counts, and if more than 50% of those come from <1% of pixels, then it is considered to be noise-dominated and hence unusable.
| Quadrant | # 1 sec bins | Bins with >0 counts | Bins with >2000 counts | High rate bins dominated by noise | Noise dominated (total time) | Noise dominated (detector-on time) | Marked lightcurve |
|---|---|---|---|---|---|---|---|
| A | 6092 | 4853 | 0 | 0 | 0.00% | 0.00% | 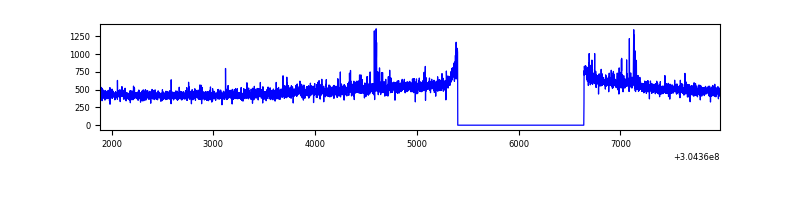 |
| B | 6091 | 4852 | 702 | 702 | 11.53% | 14.47% | 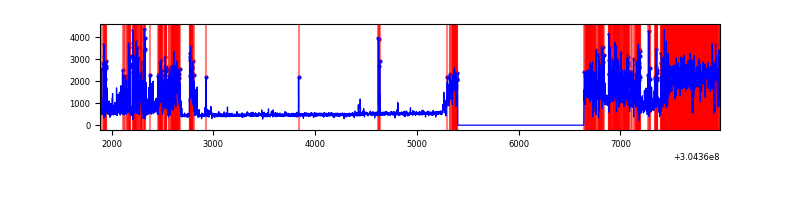 |
| C | 6091 | 4852 | 0 | 0 | 0.00% | 0.00% | 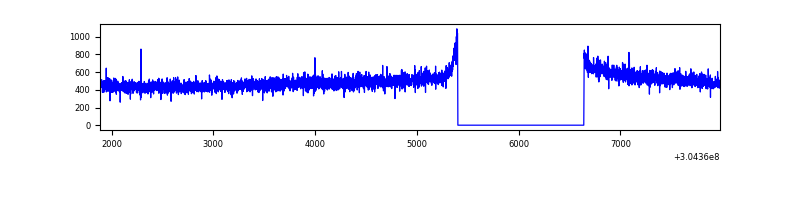 |
| D | 6091 | 4852 | 160 | 160 | 2.63% | 3.30% | 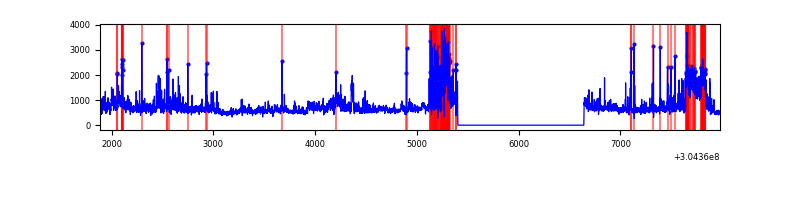 |
Top three noisy pixels from each quadrant. If the there are fewer than three noisy pixels in the level2.evt file, extra rows are filled as -1
| Pixel properties | Quadrant properties | ||||||
|---|---|---|---|---|---|---|---|
| Quadrant | DetID | PixID | Counts | Sigma | Mean | Median | Sigma |
| A | 6 | 16 | 72355 | 577.29 | 610 | 598 | 124.3 |
| A | 13 | 254 | 6322 | 46.05 | 610 | 598 | 124.3 |
| A | 0 | 226 | 5205 | 37.06 | 610 | 598 | 124.3 |
| B | 0 | 182 | 2337028 | 21512.9 | 573 | 559 | 108.6 |
| B | 3 | 64 | 112649 | 1032.06 | 573 | 559 | 108.6 |
| B | 7 | 220 | 71369 | 651.98 | 573 | 559 | 108.6 |
| C | 14 | 238 | 92591 | 665.65 | 586 | 590 | 138.2 |
| C | 8 | 128 | 7011 | 46.46 | 586 | 590 | 138.2 |
| C | 13 | 61 | 4270 | 26.63 | 586 | 590 | 138.2 |
| D | 1 | 20 | 906981 | 6489.0 | 578 | 564 | 139.7 |
| D | 5 | 222 | 374384 | 2676.16 | 578 | 564 | 139.7 |
| D | 1 | 239 | 151074 | 1077.49 | 578 | 564 | 139.7 |
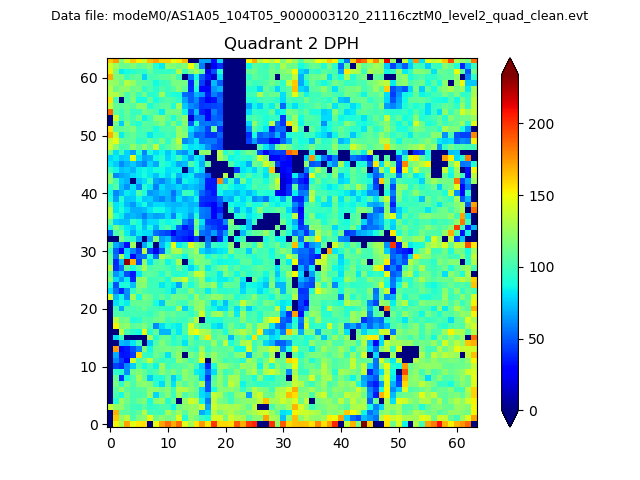
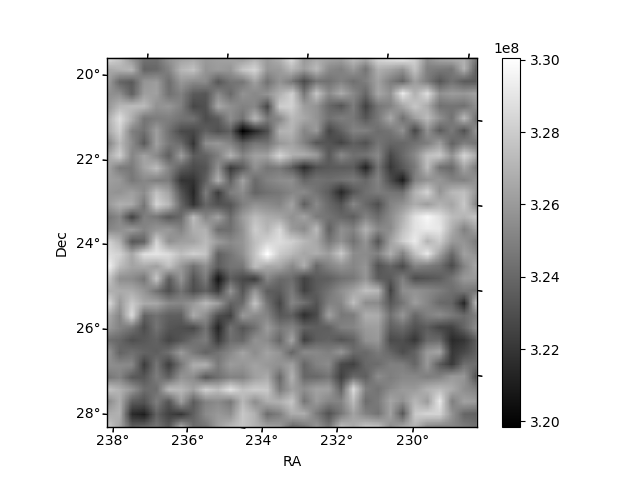
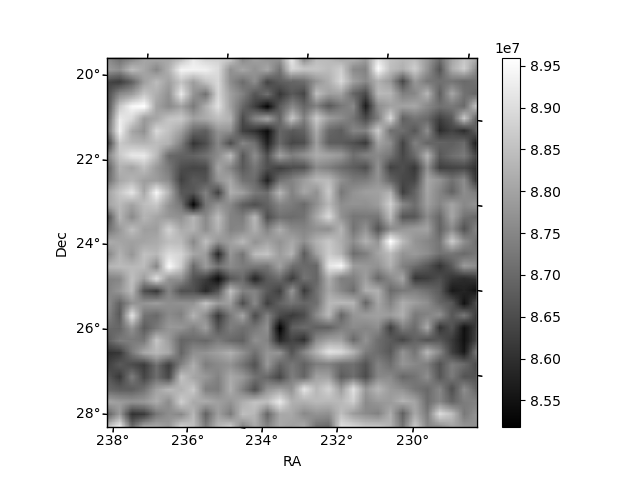
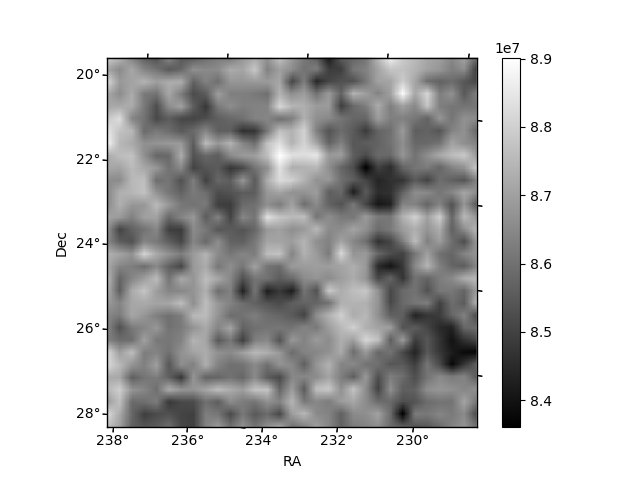
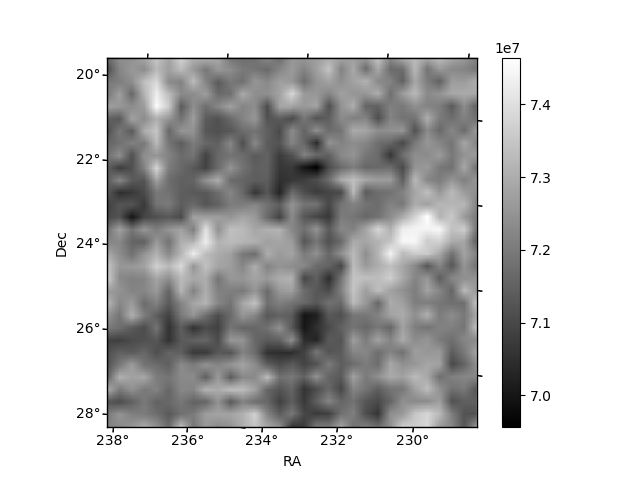
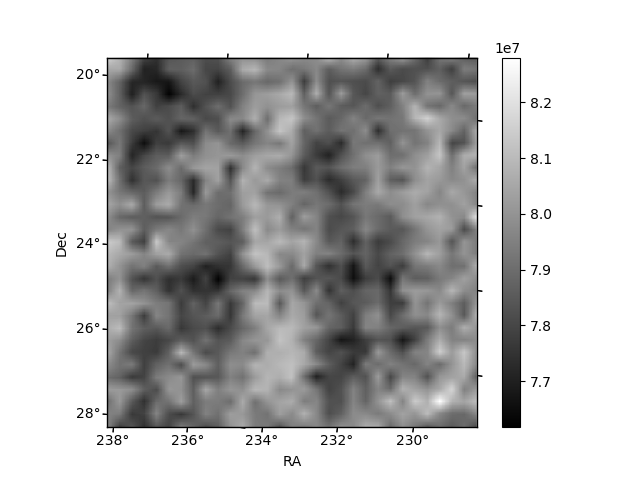
Histogram calculated using DETX and DETY for each event in the final _common_clean file
| Quadrant A | 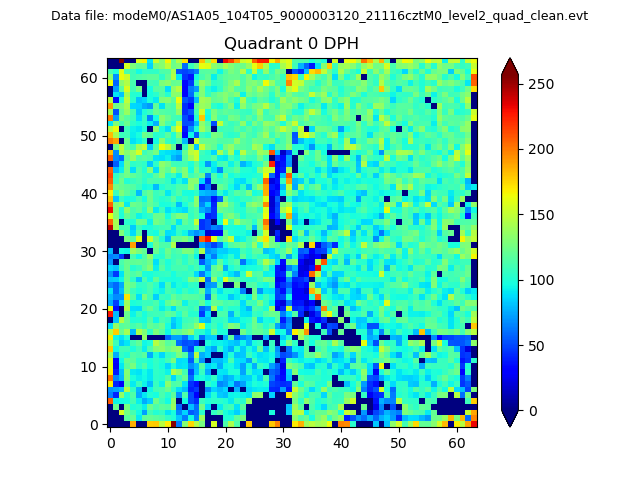 |
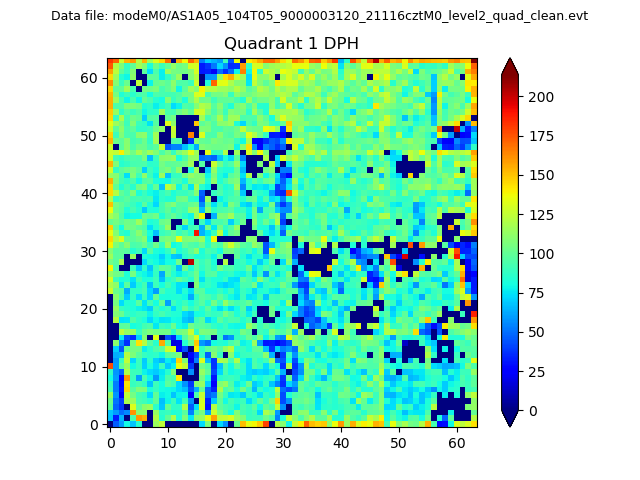 |
Quadrant B |
|---|---|---|---|
| Quadrant D | 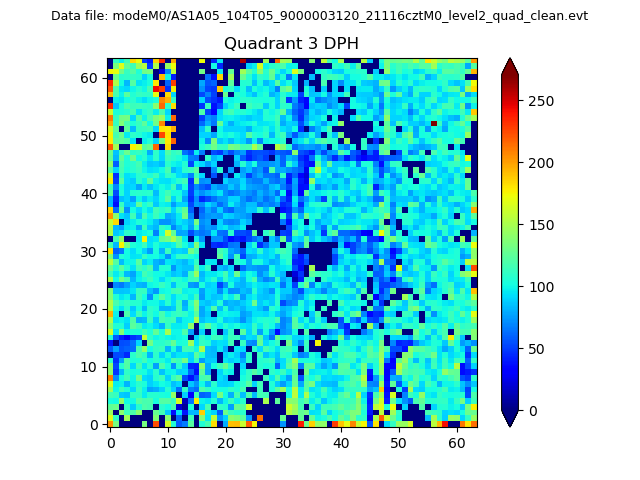 |
 |
Quadrant C |
| Plot type | Count rate plots | Images |
|---|---|---|
| Comparison with Poisson distribution Blue bars denote a histogram of data divided into 1 sec bins. Red curve is a Poisson curve with rate = median count rate of data. |
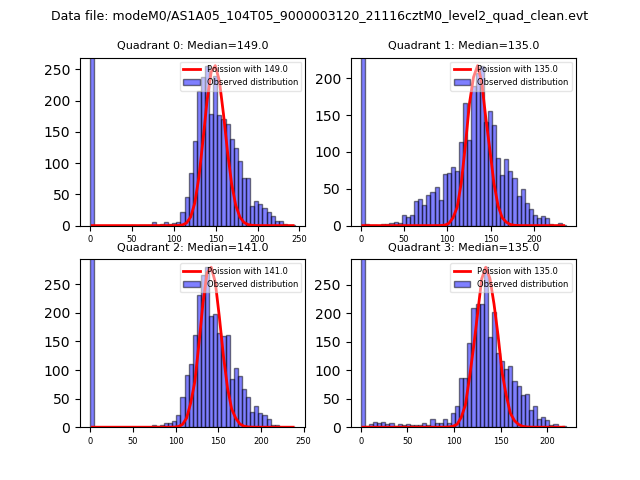 |
 |
| Quadrant-wise count rates Data is divided into 100 sec bins |
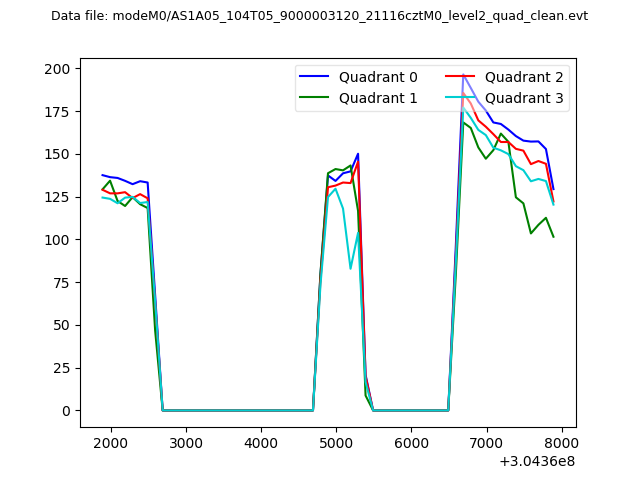 |
|
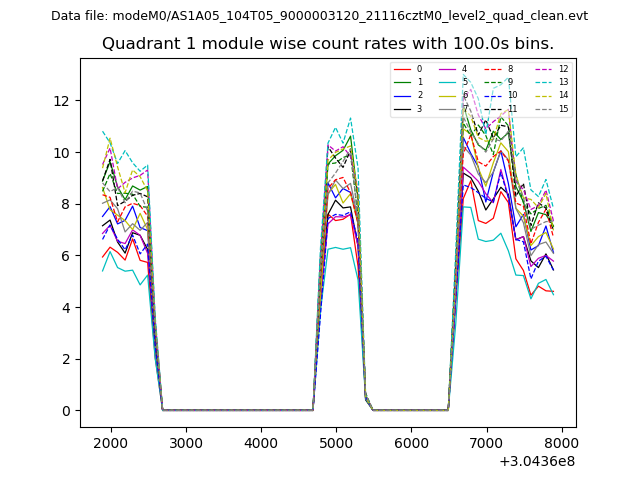
| Module-wise count rates for Quadrant A Data is divided into 100 sec bins |
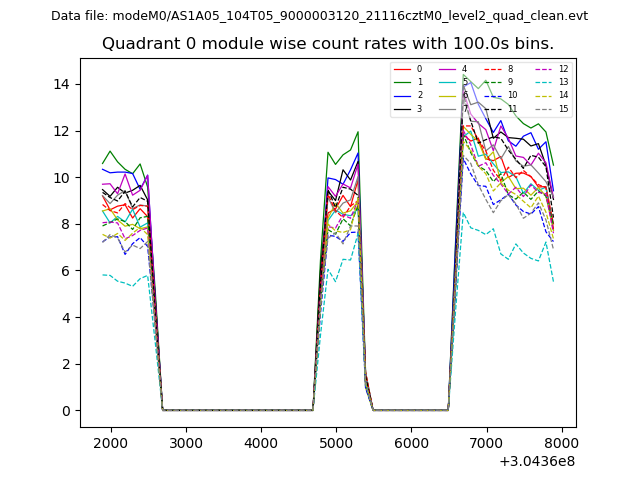 |
 |
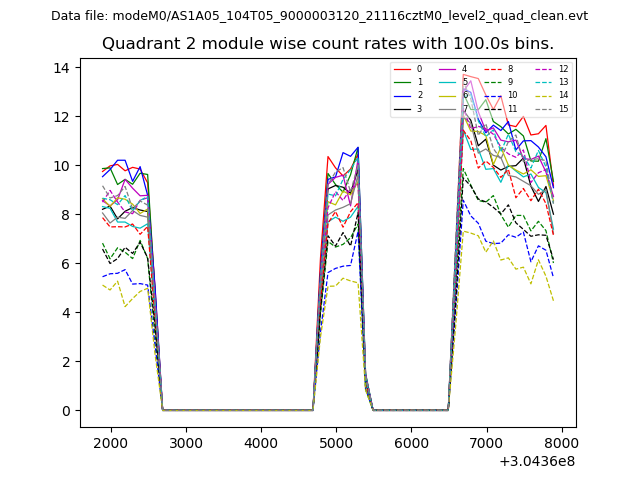
| Module-wise count rates for Quadrant B Data is divided into 100 sec bins |
 |
 |
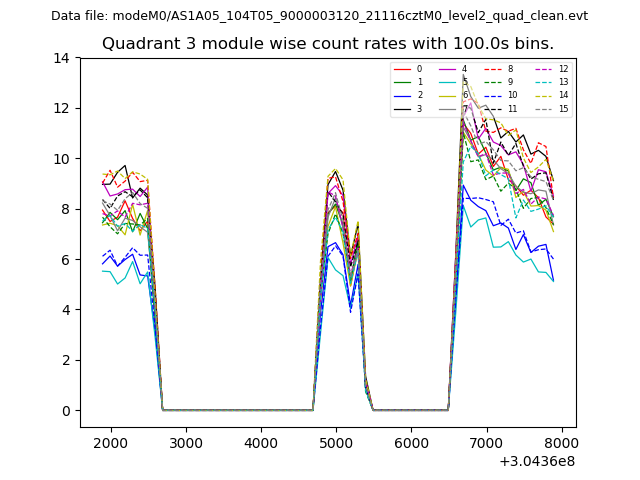
| Module-wise count rates for Quadrant C Data is divided into 100 sec bins |
 |
 |
| Module-wise count rates for Quadrant D Data is divided into 100 sec bins |
 |
 |
| Parameter | Plot |
|---|---|
| CZT HV Monitor | 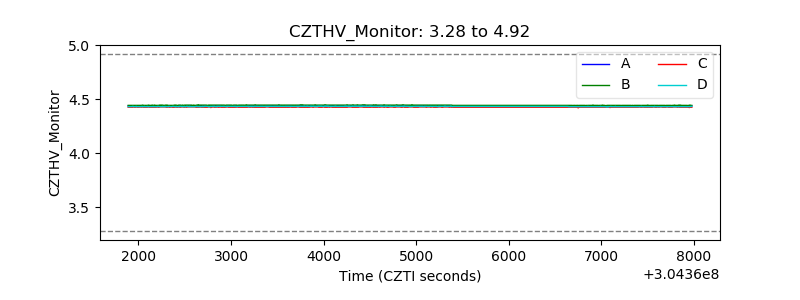 |
| D_VDD | 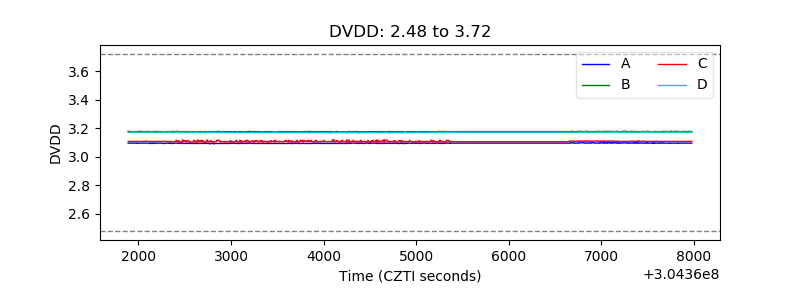 |
| Temperature 1 | 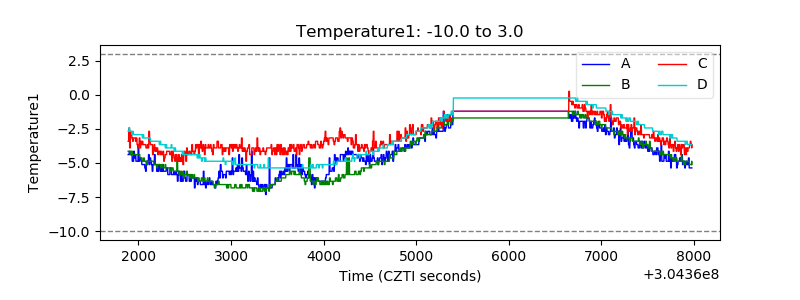 |
| Veto HV Monitor | 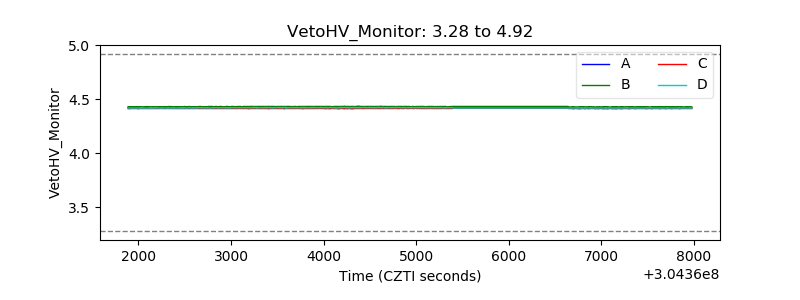 |
| Veto LLD | 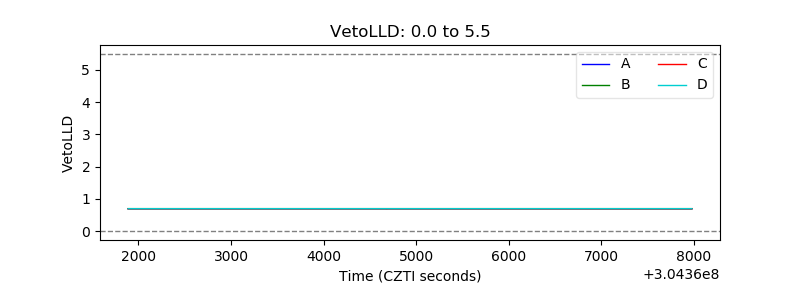 |
| Alpha Counter | 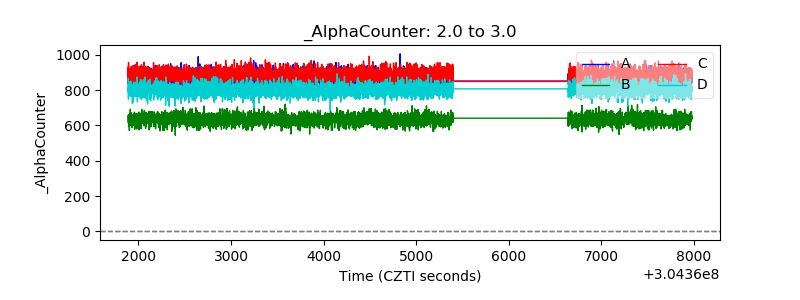 |
| _CPM_Rate | 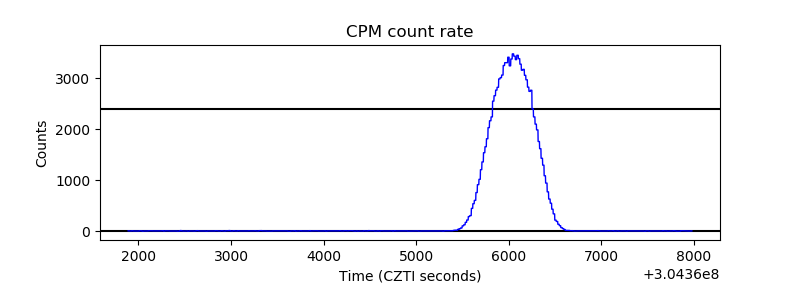 |
| CZT Counter | 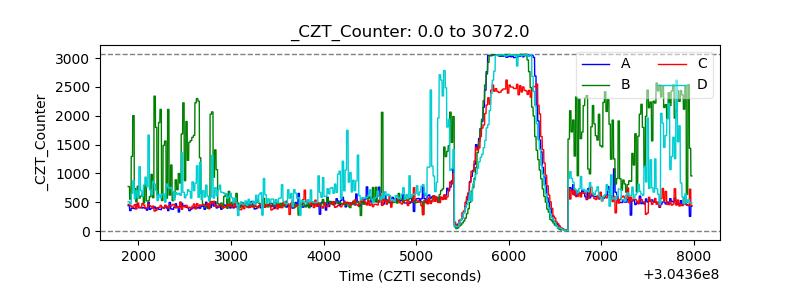 |
| +2.5 Volts monitor | 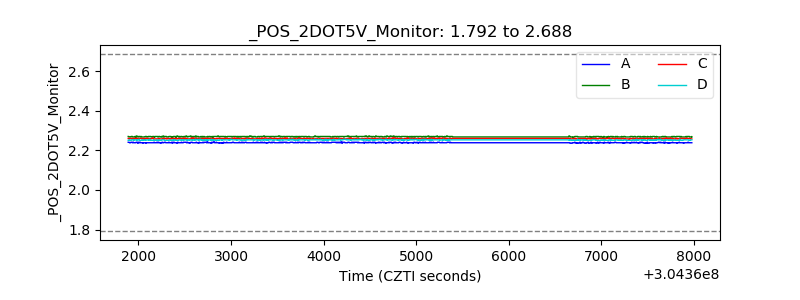 |
| +5 Volts monitor | 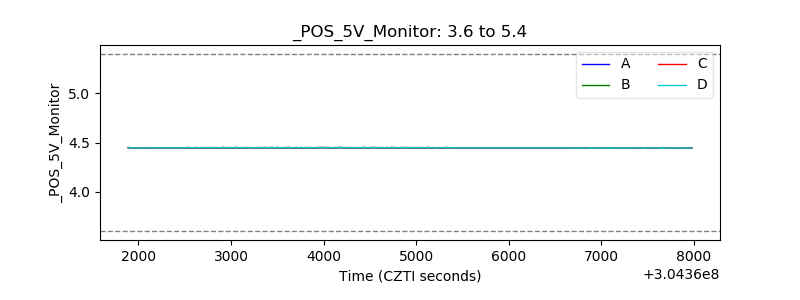 |
| _ROLL_ROT | 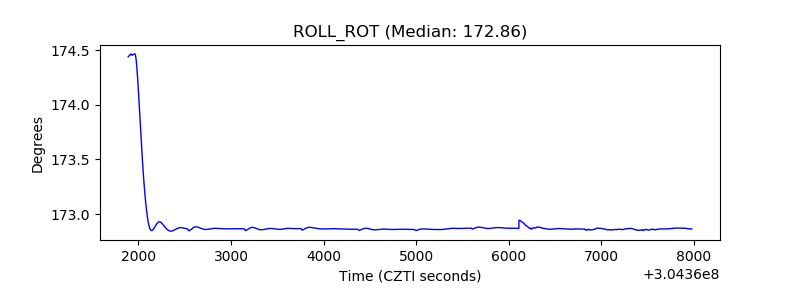 |
| _Roll_DEC | 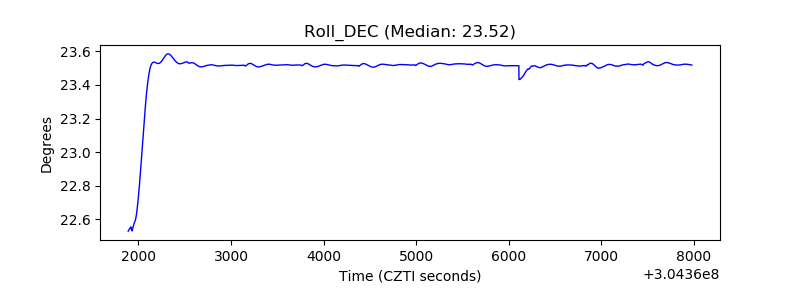 |
| _Roll_RA | 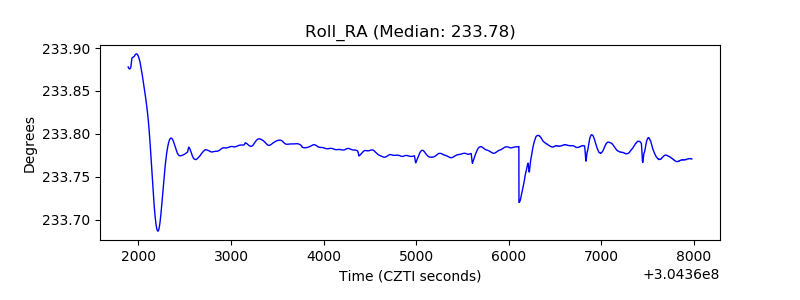 |
| Veto Counter | 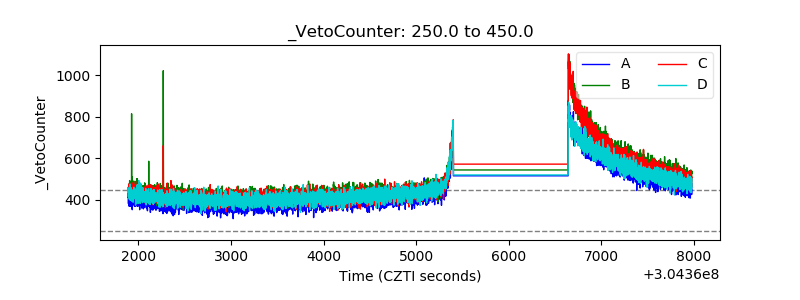 |