| Param | Original file | Final file |
|---|---|---|
| Filename | modeM0/AS1A05_104T05_9000003120_21117cztM0_level2.evt | modeM0/AS1A05_104T05_9000003120_21117cztM0_level2_quad_clean.evt |
| Size (bytes) | 603,164,160 | 93,490,560 |
| Size | 575.2 MB | 89.2 MB |
| Events in quadrant A | 3,178,346 | 642,264 |
| Events in quadrant B | 6,472,539 | 575,319 |
| Events in quadrant C | 3,173,453 | 611,265 |
| Events in quadrant D | 5,023,050 | 569,201 |
| Mode SS | |||
|---|---|---|---|
| Quadrant | BADHDUFLAG | Total packets | Discarded packets |
| A | 0 | 124 | 0 |
| B | 0 | 124 | 0 |
| C | 0 | 124 | 0 |
| D | 0 | 124 | 0 |
| Mode M9 | |||
|---|---|---|---|
| Quadrant | BADHDUFLAG | Total packets | Discarded packets |
| A | 0 | 14 | 0 |
| B | 0 | 14 | 0 |
| C | 0 | 14 | 0 |
| D | 0 | 14 | 0 |
| Mode M0 | |||
|---|---|---|---|
| Quadrant | BADHDUFLAG | Total packets | Discarded packets |
| A | 0 | 13287 | 0 |
| B | 0 | 23200 | 0 |
| C | 0 | 13173 | 0 |
| D | 0 | 19289 | 0 |
| Quadrant | Total seconds | Saturated seconds | Saturation percentage |
|---|---|---|---|
| A | 6201 | 24 | 0.387034% |
| B | 6202 | 1414 | 22.799097% |
| C | 6202 | 48 | 0.773944% |
| D | 6201 | 231 | 3.725206% |
Noise dominated data is calculated using 1-second bins in cleaned event files. If a bin has >2000 counts, and if more than 50% of those come from <1% of pixels, then it is considered to be noise-dominated and hence unusable.
| Quadrant | # 1 sec bins | Bins with >0 counts | Bins with >2000 counts | High rate bins dominated by noise | Noise dominated (total time) | Noise dominated (detector-on time) | Marked lightcurve |
|---|---|---|---|---|---|---|---|
| A | 7521 | 6202 | 0 | 0 | 0.00% | 0.00% | 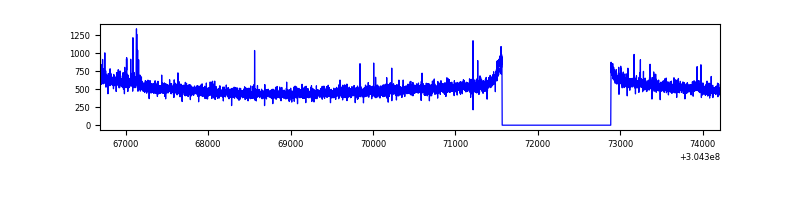 |
| B | 7522 | 6203 | 1091 | 1091 | 14.50% | 17.59% | 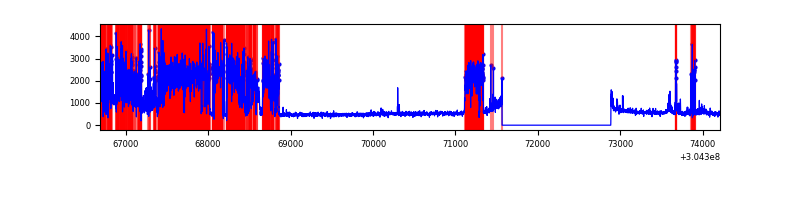 |
| C | 7522 | 6203 | 1 | 1 | 0.01% | 0.02% | 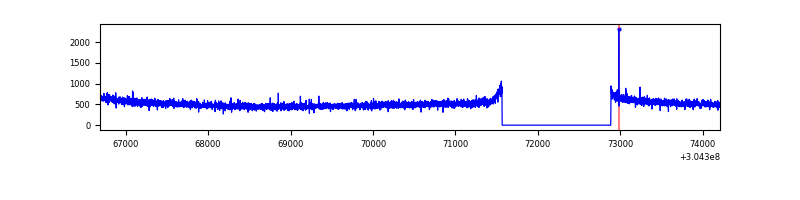 |
| D | 7521 | 6202 | 221 | 221 | 2.94% | 3.56% | 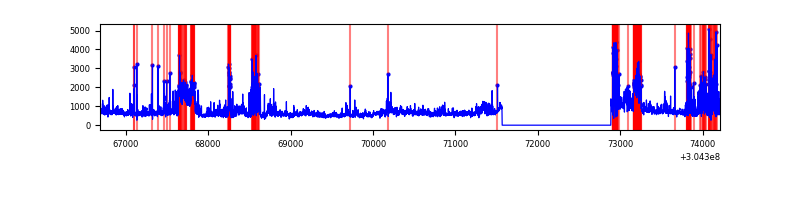 |
Top three noisy pixels from each quadrant. If the there are fewer than three noisy pixels in the level2.evt file, extra rows are filled as -1
| Pixel properties | Quadrant properties | ||||||
|---|---|---|---|---|---|---|---|
| Quadrant | DetID | PixID | Counts | Sigma | Mean | Median | Sigma |
| A | 6 | 16 | 19642 | 116.7 | 814 | 801 | 161.4 |
| A | 15 | 192 | 15776 | 92.76 | 814 | 801 | 161.4 |
| A | 13 | 254 | 8571 | 48.13 | 814 | 801 | 161.4 |
| B | 0 | 182 | 3164983 | 22474.25 | 759 | 743 | 140.8 |
| B | 7 | 220 | 140704 | 994.08 | 759 | 743 | 140.8 |
| B | 3 | 64 | 97749 | 688.99 | 759 | 743 | 140.8 |
| C | 14 | 238 | 122829 | 676.44 | 781 | 788 | 180.4 |
| C | 13 | 61 | 5574 | 26.53 | 781 | 788 | 180.4 |
| C | 0 | 207 | 4364 | 19.82 | 781 | 788 | 180.4 |
| D | 1 | 20 | 767095 | 4128.69 | 772 | 751 | 185.6 |
| D | 5 | 222 | 664791 | 3577.53 | 772 | 751 | 185.6 |
| D | 1 | 239 | 267832 | 1438.9 | 772 | 751 | 185.6 |
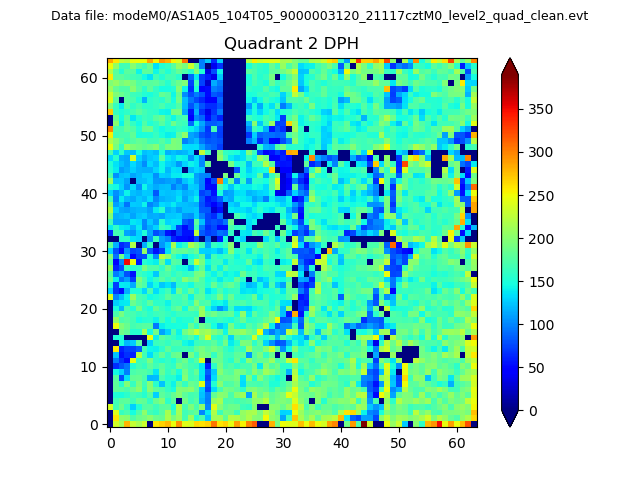
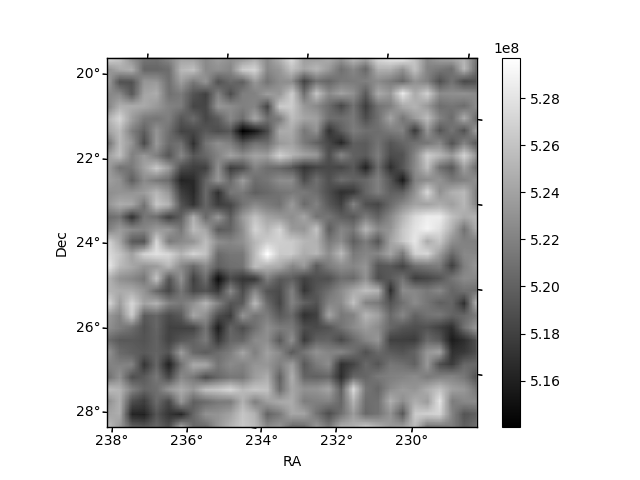
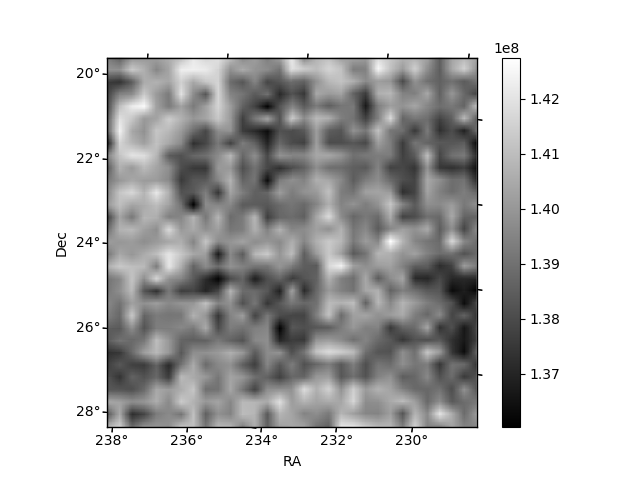
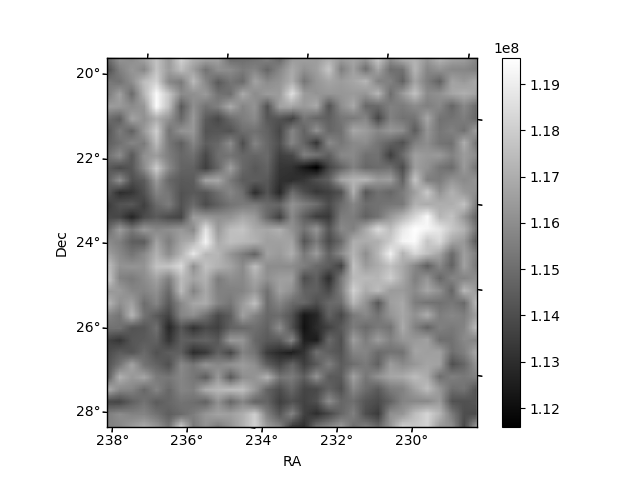
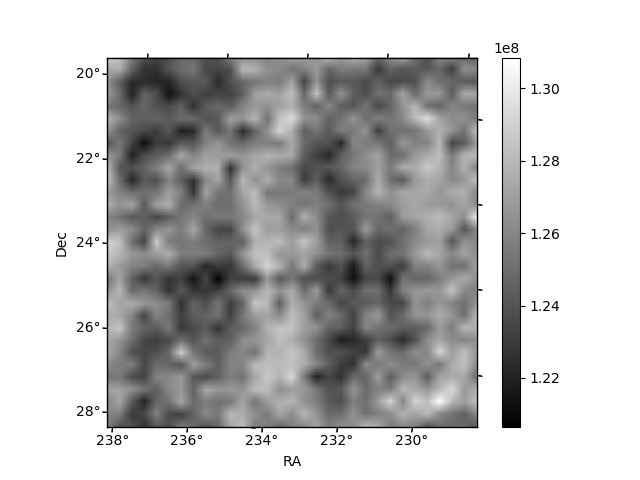
Histogram calculated using DETX and DETY for each event in the final _common_clean file
| Quadrant A | 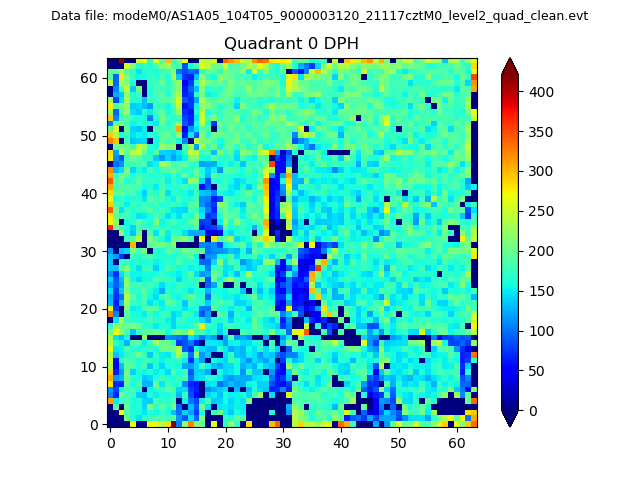 |
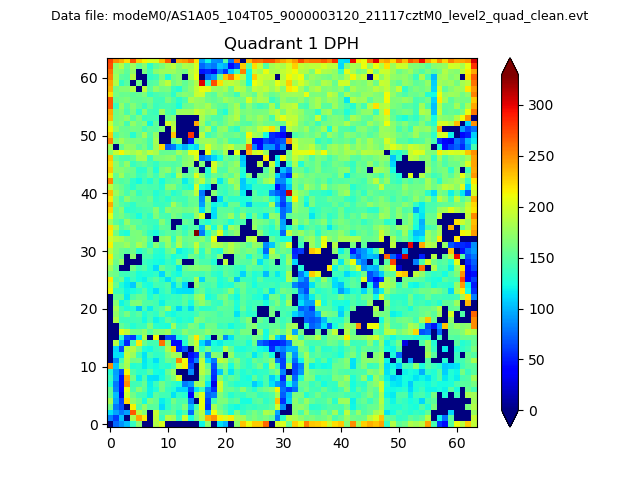 |
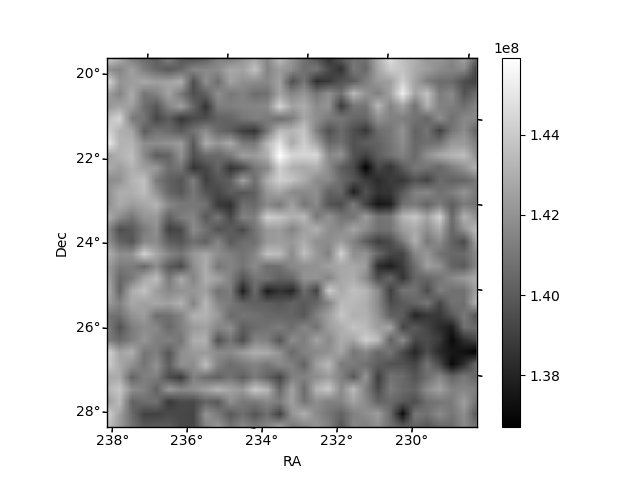
Quadrant B |
|---|---|---|---|
| Quadrant D | 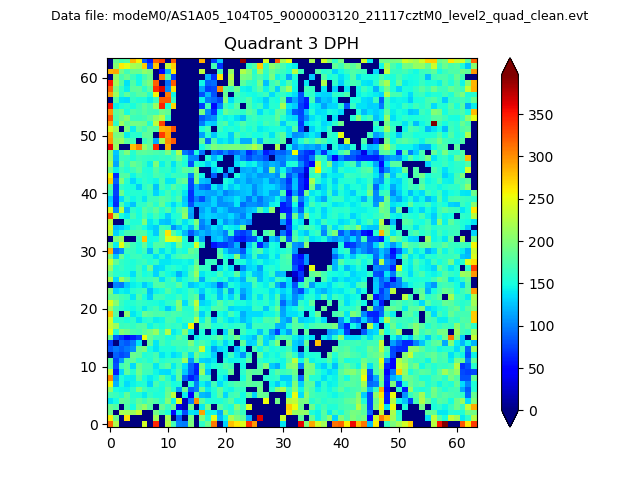 |
 |
Quadrant C |
| Plot type | Count rate plots | Images |
|---|---|---|
| Comparison with Poisson distribution Blue bars denote a histogram of data divided into 1 sec bins. Red curve is a Poisson curve with rate = median count rate of data. |
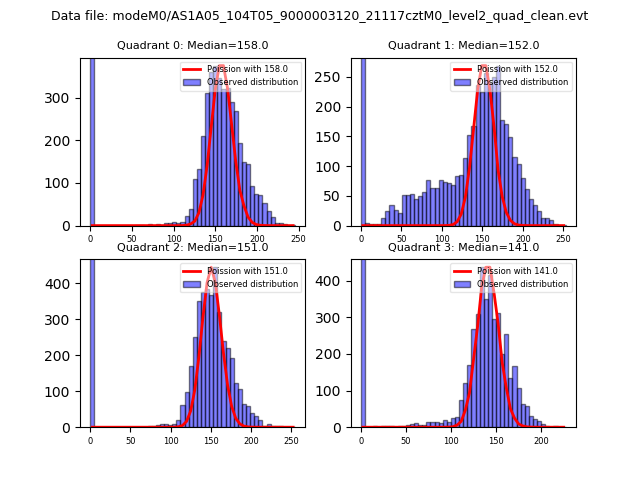 |
 |
| Quadrant-wise count rates Data is divided into 100 sec bins |
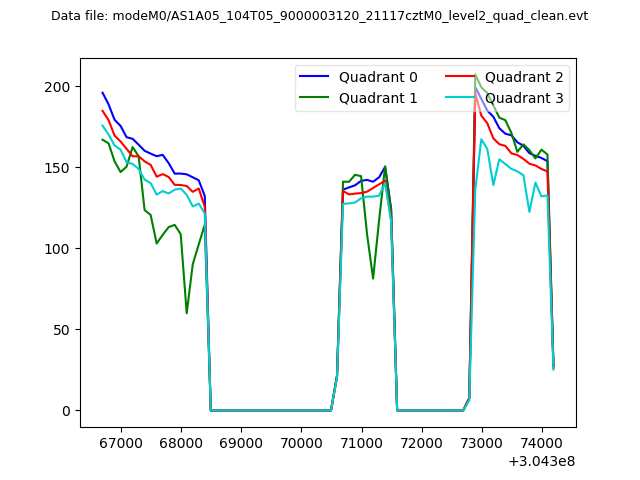 |
|
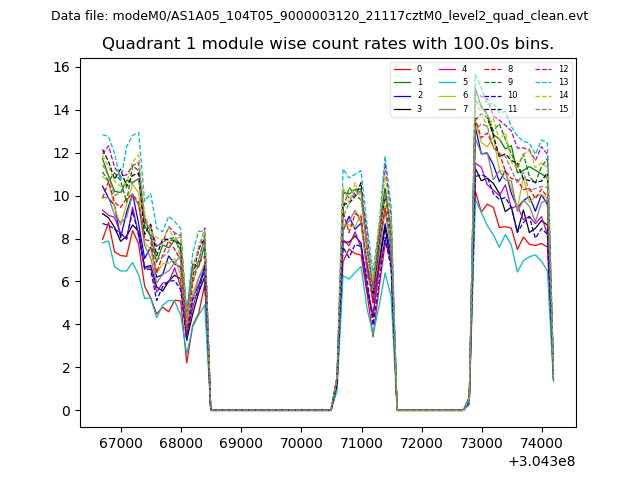
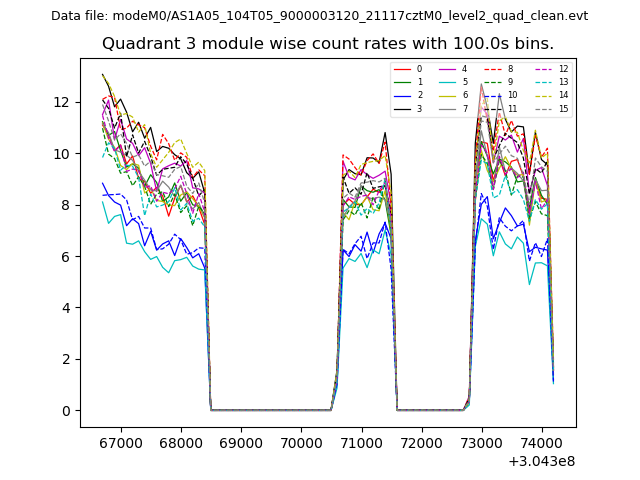
| Module-wise count rates for Quadrant A Data is divided into 100 sec bins |
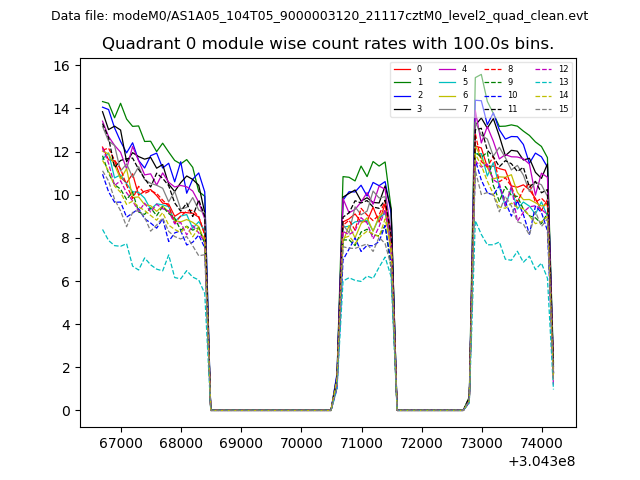 |
 |
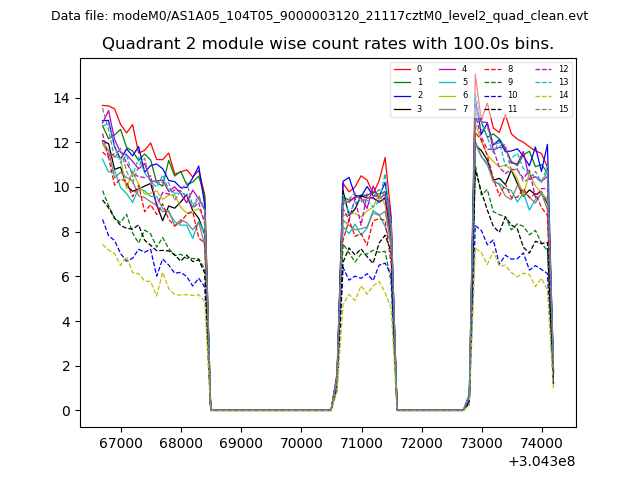
| Module-wise count rates for Quadrant B Data is divided into 100 sec bins |
 |
 |
| Module-wise count rates for Quadrant C Data is divided into 100 sec bins |
 |
 |
| Module-wise count rates for Quadrant D Data is divided into 100 sec bins |
 |
 |
| Parameter | Plot |
|---|---|
| CZT HV Monitor | 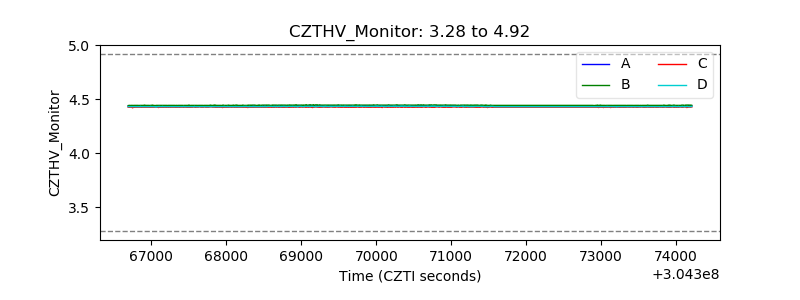 |
| D_VDD | 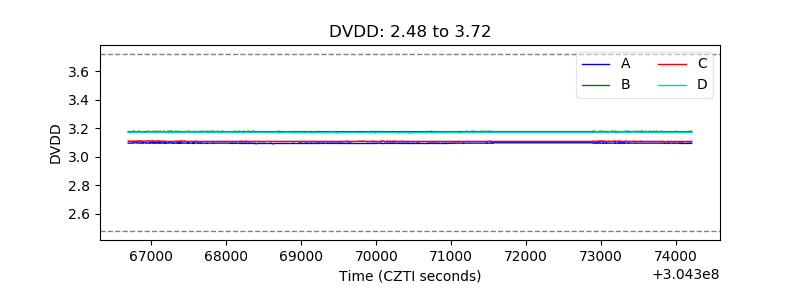 |
| Temperature 1 | 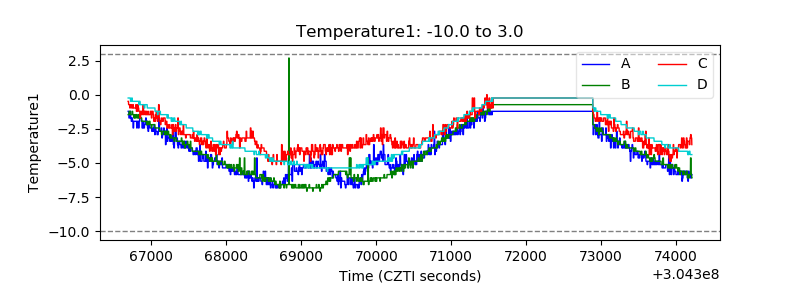 |
| Veto HV Monitor | 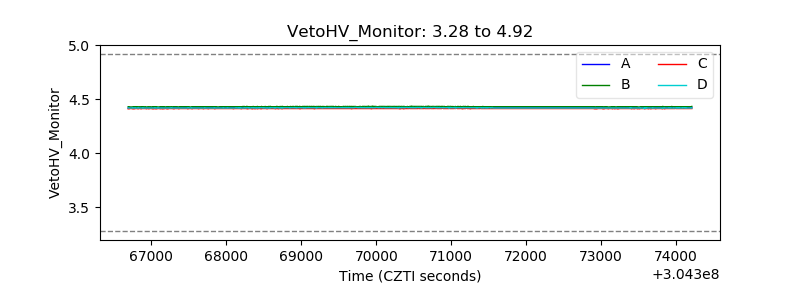 |
| Veto LLD | 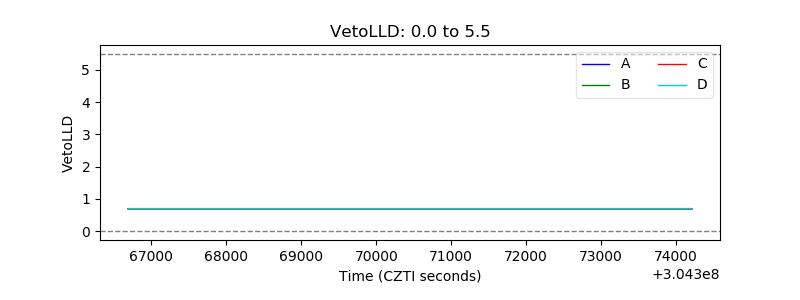 |
| Alpha Counter | 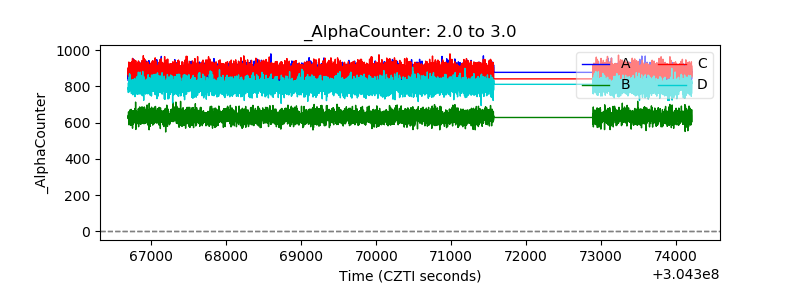 |
| _CPM_Rate | 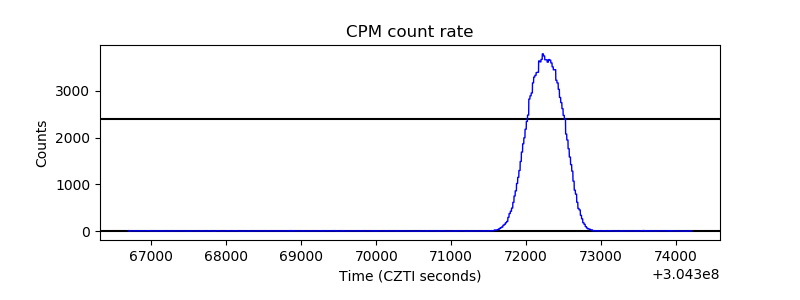 |
| CZT Counter | 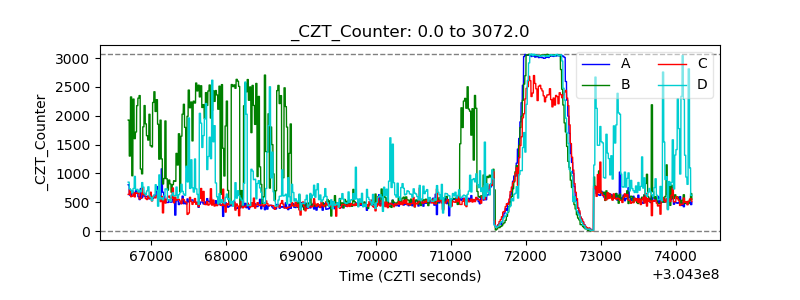 |
| +2.5 Volts monitor |  |
| +5 Volts monitor |  |
| _ROLL_ROT | 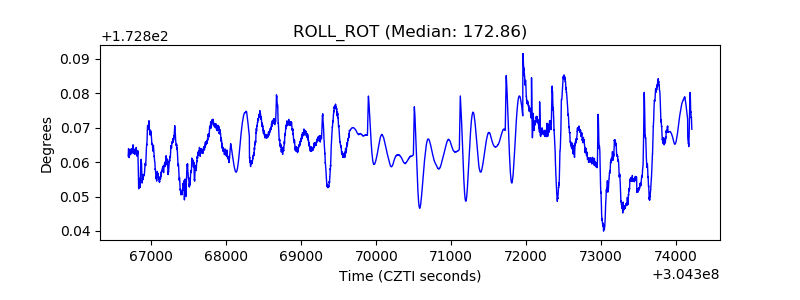 |
| _Roll_DEC | 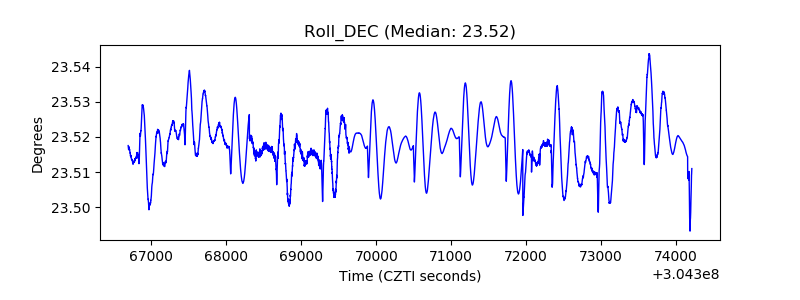 |
| _Roll_RA | 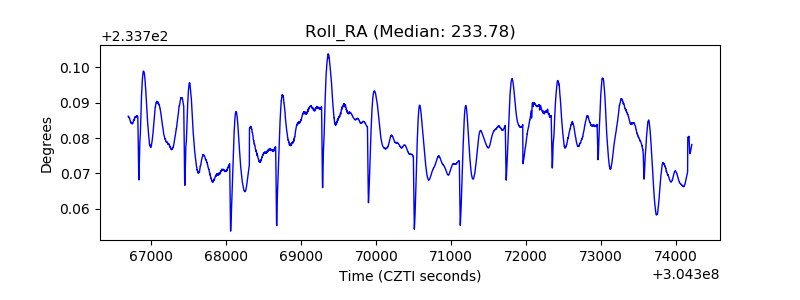 |
| Veto Counter | 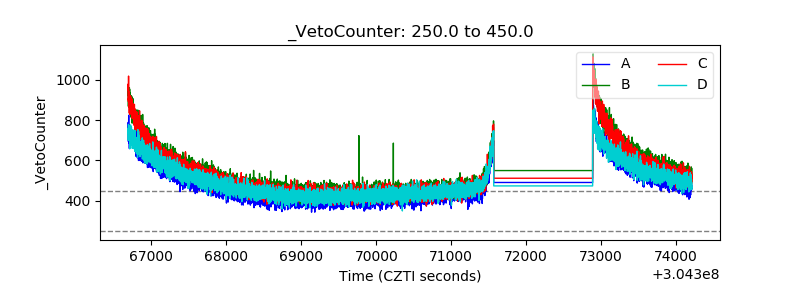 |