| Param | Original file | Final file |
|---|---|---|
| Filename | modeM0/AS1A05_104T05_9000003120_21119cztM0_level2.evt | modeM0/AS1A05_104T05_9000003120_21119cztM0_level2_quad_clean.evt |
| Size (bytes) | 560,931,840 | 79,813,440 |
| Size | 534.9 MB | 76.1 MB |
| Events in quadrant A | 3,744,734 | 518,853 |
| Events in quadrant B | 3,562,386 | 520,479 |
| Events in quadrant C | 3,082,076 | 491,118 |
| Events in quadrant D | 6,187,559 | 462,265 |
| Mode SS | |||
|---|---|---|---|
| Quadrant | BADHDUFLAG | Total packets | Discarded packets |
| A | 0 | 124 | 0 |
| B | 0 | 124 | 0 |
| C | 0 | 124 | 0 |
| D | 0 | 124 | 0 |
| Mode M9 | |||
|---|---|---|---|
| Quadrant | BADHDUFLAG | Total packets | Discarded packets |
| A | 0 | 19 | 0 |
| B | 0 | 20 | 0 |
| C | 0 | 20 | 0 |
| D | 0 | 20 | 0 |
| Mode M0 | |||
|---|---|---|---|
| Quadrant | BADHDUFLAG | Total packets | Discarded packets |
| A | 0 | 14806 | 1 |
| B | 0 | 14153 | 1 |
| C | 0 | 12699 | 1 |
| D | 0 | 22764 | 1 |
| Quadrant | Total seconds | Saturated seconds | Saturation percentage |
|---|---|---|---|
| A | 6071 | 175 | 2.882556% |
| B | 6071 | 145 | 2.388404% |
| C | 6071 | 35 | 0.576511% |
| D | 6071 | 419 | 6.901664% |
Noise dominated data is calculated using 1-second bins in cleaned event files. If a bin has >2000 counts, and if more than 50% of those come from <1% of pixels, then it is considered to be noise-dominated and hence unusable.
| Quadrant | # 1 sec bins | Bins with >0 counts | Bins with >2000 counts | High rate bins dominated by noise | Noise dominated (total time) | Noise dominated (detector-on time) | Marked lightcurve |
|---|---|---|---|---|---|---|---|
| A | 7456 | 6072 | 138 | 138 | 1.85% | 2.27% | 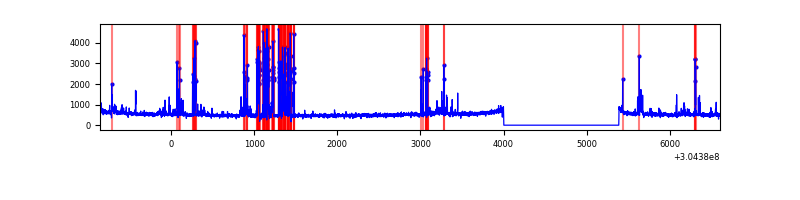 |
| B | 7456 | 6072 | 71 | 71 | 0.95% | 1.17% |  |
| C | 7456 | 6072 | 0 | 0 | 0.00% | 0.00% | 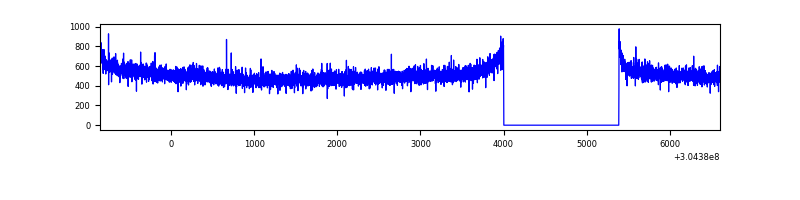 |
| D | 7456 | 6072 | 359 | 359 | 4.81% | 5.91% | 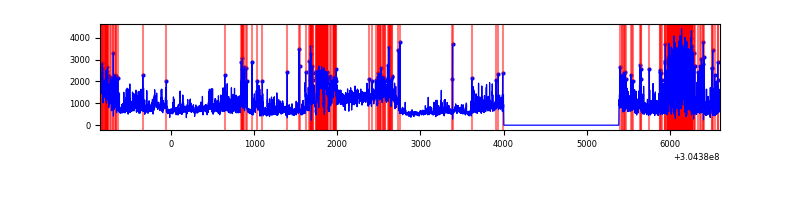 |
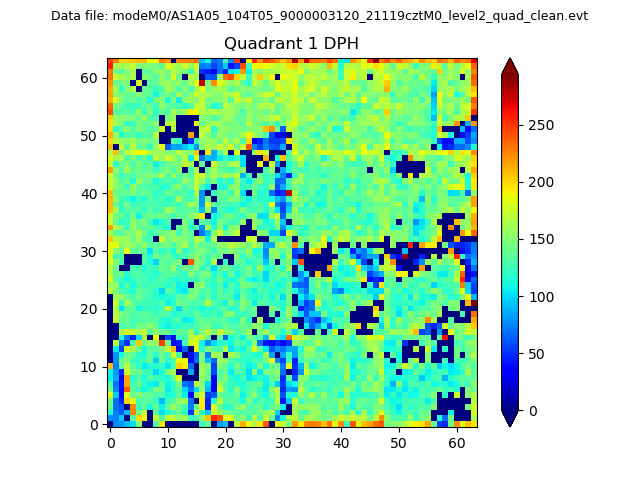
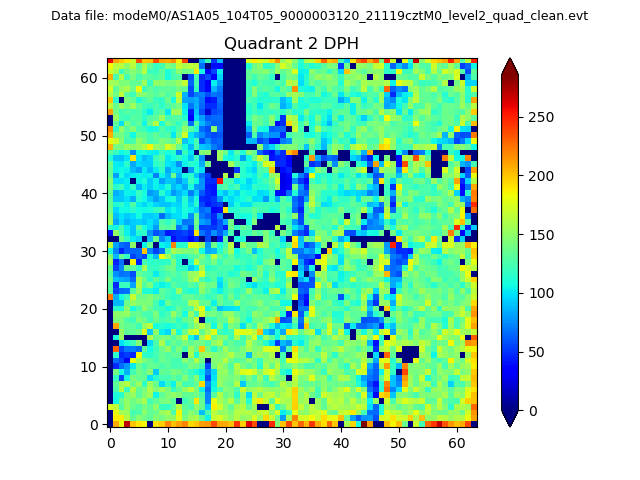
Top three noisy pixels from each quadrant. If the there are fewer than three noisy pixels in the level2.evt file, extra rows are filled as -1
| Pixel properties | Quadrant properties | ||||||
|---|---|---|---|---|---|---|---|
| Quadrant | DetID | PixID | Counts | Sigma | Mean | Median | Sigma |
| A | 15 | 192 | 709164 | 4520.76 | 787 | 773 | 156.7 |
| A | 13 | 254 | 8475 | 49.15 | 787 | 773 | 156.7 |
| A | 0 | 226 | 6687 | 37.74 | 787 | 773 | 156.7 |
| B | 0 | 228 | 162218 | 1087.88 | 793 | 777 | 148.4 |
| B | 7 | 220 | 146594 | 982.59 | 793 | 777 | 148.4 |
| B | 0 | 219 | 64651 | 430.42 | 793 | 777 | 148.4 |
| C | 14 | 238 | 121652 | 684.17 | 759 | 765 | 176.7 |
| C | 13 | 61 | 5321 | 25.79 | 759 | 765 | 176.7 |
| C | 3 | 202 | 1803 | 5.87 | 759 | 765 | 176.7 |
| D | 1 | 239 | 1463338 | 8074.58 | 742 | 722 | 181.1 |
| D | 5 | 222 | 914436 | 5044.29 | 742 | 722 | 181.1 |
| D | 1 | 20 | 574999 | 3170.38 | 742 | 722 | 181.1 |
Histogram calculated using DETX and DETY for each event in the final _common_clean file
| Quadrant A | 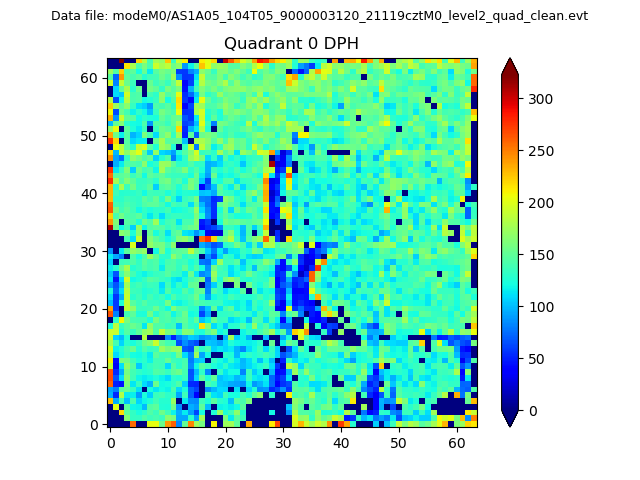 |
 |
Quadrant B |
|---|---|---|---|
| Quadrant D | 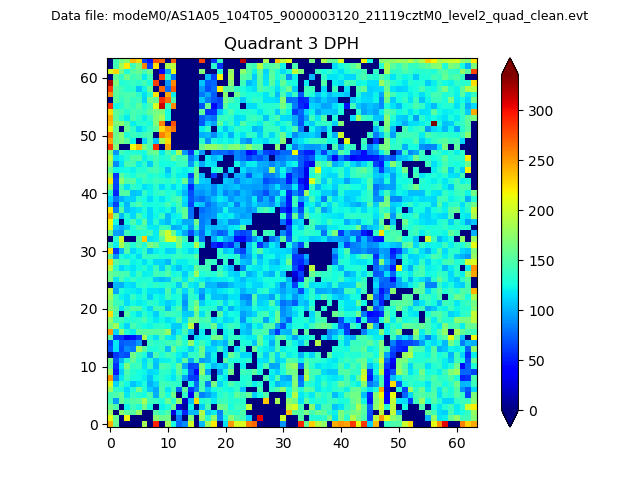 |
 |
Quadrant C |
| Plot type | Count rate plots | Images |
|---|---|---|
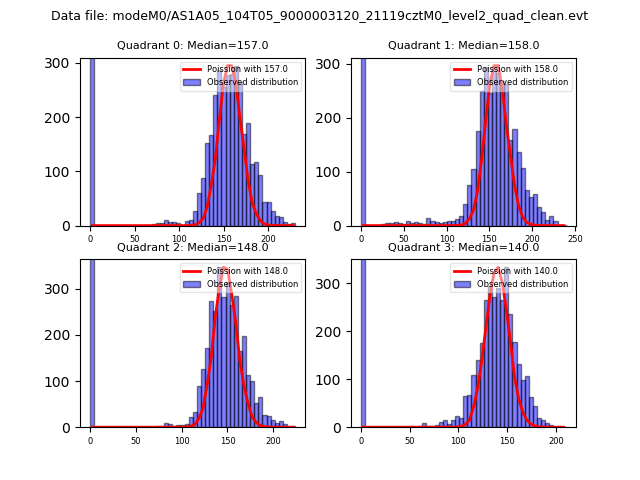
| Comparison with Poisson distribution Blue bars denote a histogram of data divided into 1 sec bins. Red curve is a Poisson curve with rate = median count rate of data. |
 |
 |
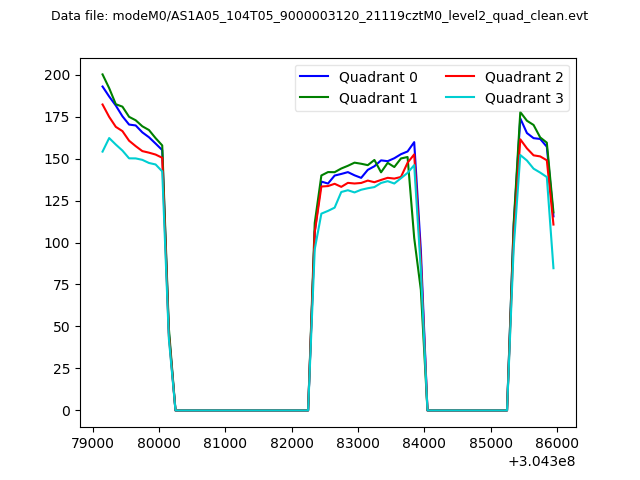
| Quadrant-wise count rates Data is divided into 100 sec bins |
 |
|
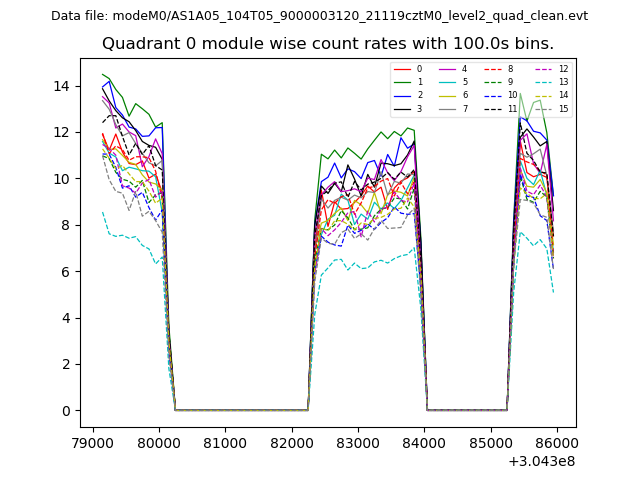
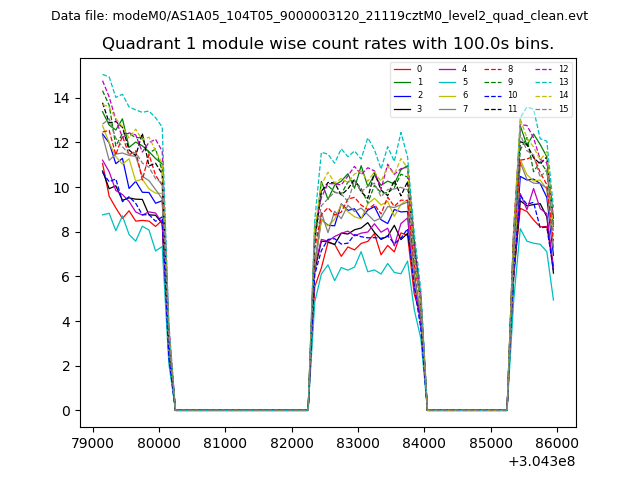
| Module-wise count rates for Quadrant A Data is divided into 100 sec bins |
 |
 |
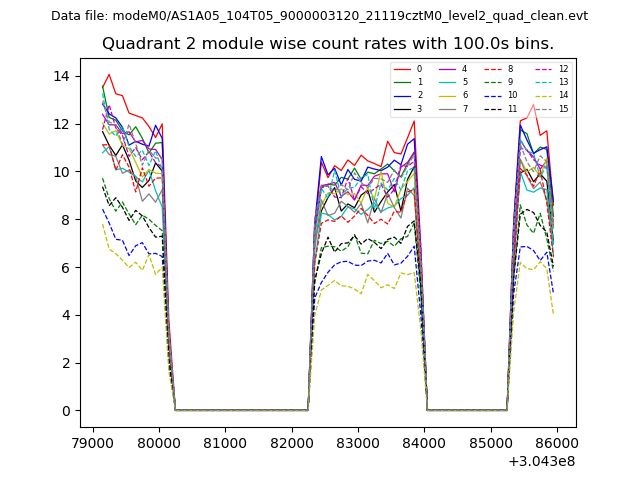
| Module-wise count rates for Quadrant B Data is divided into 100 sec bins |
 |
 |
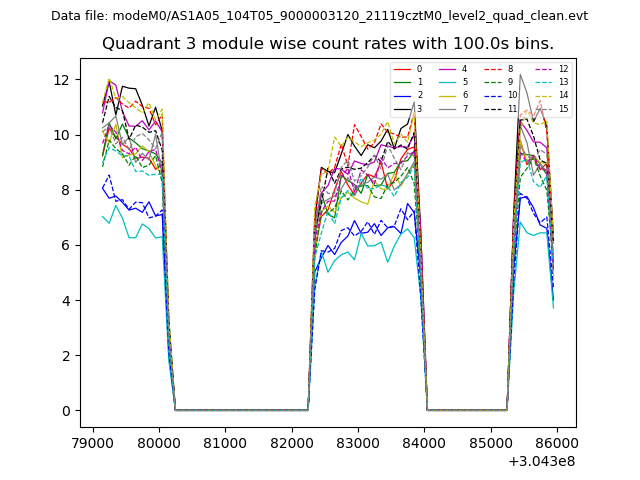
| Module-wise count rates for Quadrant C Data is divided into 100 sec bins |
 |
 |
| Module-wise count rates for Quadrant D Data is divided into 100 sec bins |
 |
 |
| Parameter | Plot |
|---|---|
| CZT HV Monitor | 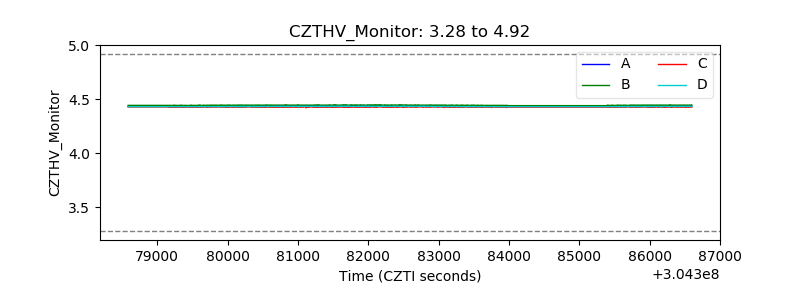 |
| D_VDD | 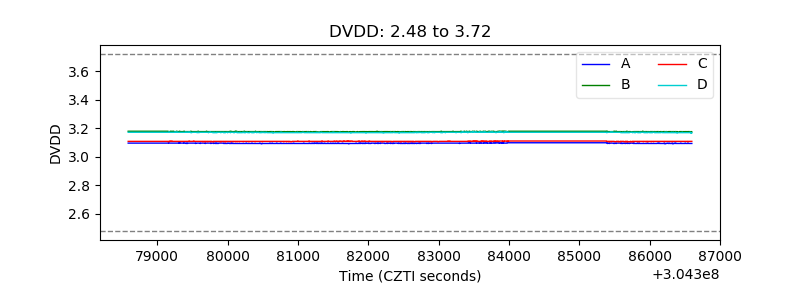 |
| Temperature 1 | 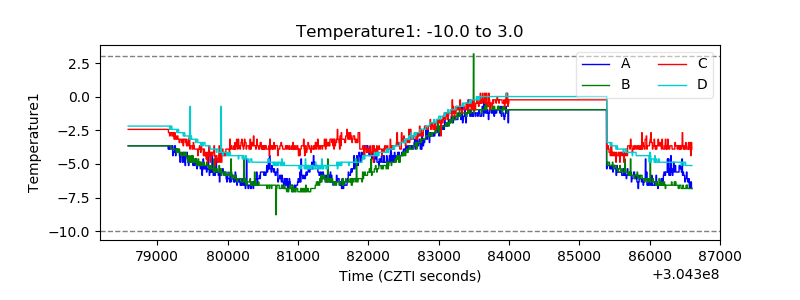 |
| Veto HV Monitor | 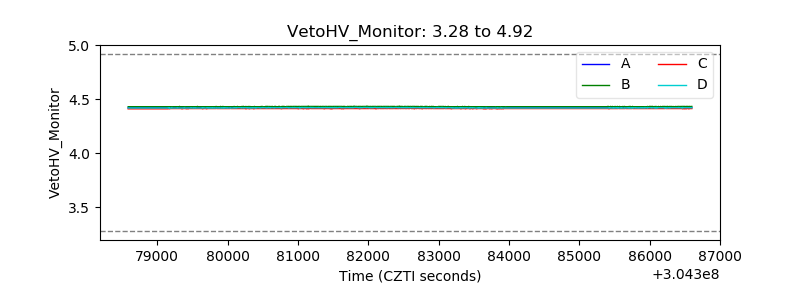 |
| Veto LLD | 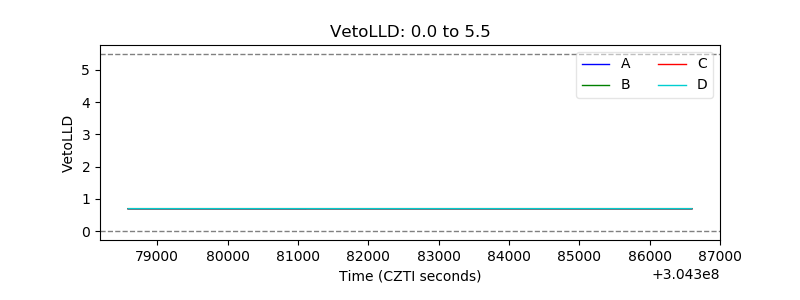 |
| Alpha Counter | 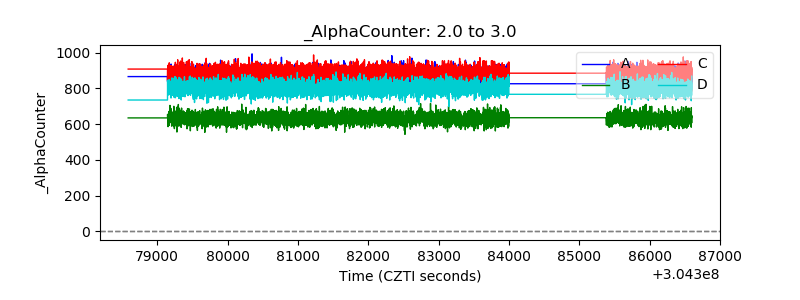 |
| _CPM_Rate | 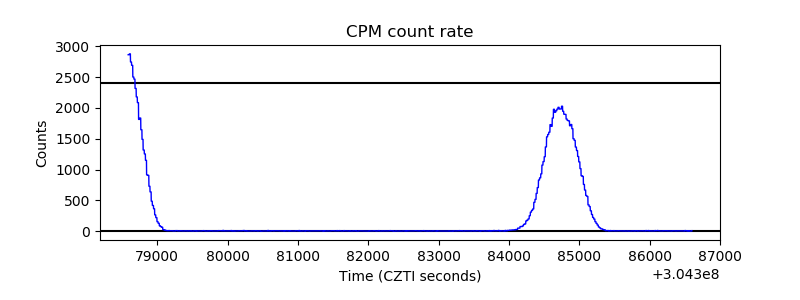 |
| CZT Counter | 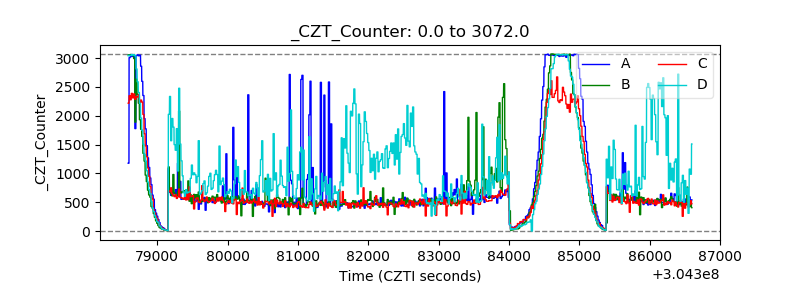 |
| +2.5 Volts monitor |  |
| +5 Volts monitor |  |
| _ROLL_ROT | 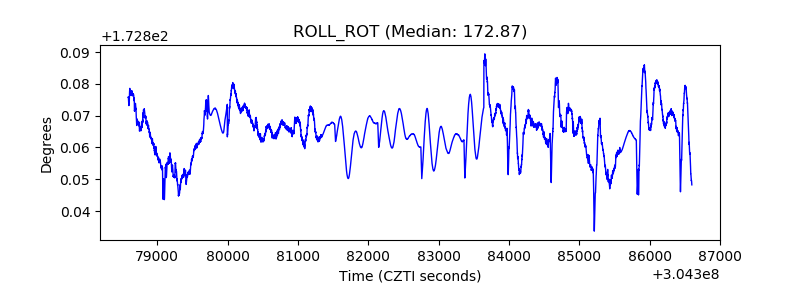 |
| _Roll_DEC | 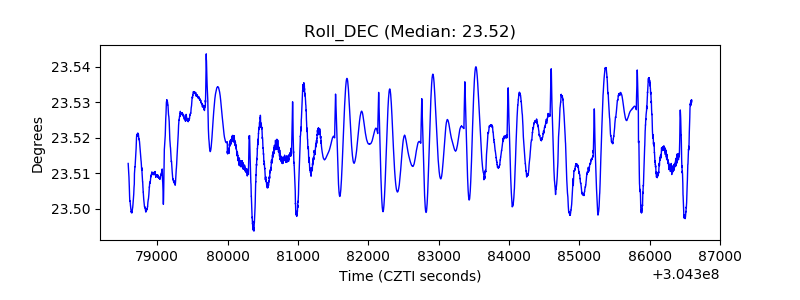 |
| _Roll_RA |  |
| Veto Counter | 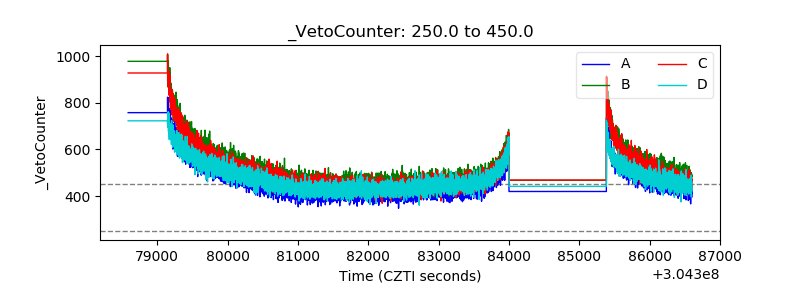 |