| Param | Original file | Final file |
|---|---|---|
| Filename | modeM0/AS1A05_104T05_9000003120_21120cztM0_level2.evt | modeM0/AS1A05_104T05_9000003120_21120cztM0_level2_quad_clean.evt |
| Size (bytes) | 571,302,720 | 74,612,160 |
| Size | 544.8 MB | 71.2 MB |
| Events in quadrant A | 3,794,217 | 464,107 |
| Events in quadrant B | 3,900,530 | 467,021 |
| Events in quadrant C | 3,319,168 | 441,736 |
| Events in quadrant D | 5,835,671 | 420,626 |
| Mode SS | |||
|---|---|---|---|
| Quadrant | BADHDUFLAG | Total packets | Discarded packets |
| A | 0 | 138 | 0 |
| B | 0 | 138 | 0 |
| C | 0 | 138 | 0 |
| D | 0 | 138 | 0 |
| Mode M9 | |||
|---|---|---|---|
| Quadrant | BADHDUFLAG | Total packets | Discarded packets |
| A | 0 | 26 | 0 |
| B | 0 | 26 | 0 |
| C | 0 | 26 | 0 |
| D | 0 | 26 | 0 |
| Mode M0 | |||
|---|---|---|---|
| Quadrant | BADHDUFLAG | Total packets | Discarded packets |
| A | 0 | 15391 | 1 |
| B | 0 | 15740 | 1 |
| C | 0 | 13848 | 1 |
| D | 0 | 21942 | 4 |
| Quadrant | Total seconds | Saturated seconds | Saturation percentage |
|---|---|---|---|
| A | 6678 | 77 | 1.153040% |
| B | 6679 | 162 | 2.425513% |
| C | 6679 | 67 | 1.003144% |
| D | 6678 | 396 | 5.929919% |
Noise dominated data is calculated using 1-second bins in cleaned event files. If a bin has >2000 counts, and if more than 50% of those come from <1% of pixels, then it is considered to be noise-dominated and hence unusable.
| Quadrant | # 1 sec bins | Bins with >0 counts | Bins with >2000 counts | High rate bins dominated by noise | Noise dominated (total time) | Noise dominated (detector-on time) | Marked lightcurve |
|---|---|---|---|---|---|---|---|
| A | 9234 | 6680 | 20 | 20 | 0.22% | 0.30% |  |
| B | 9235 | 6681 | 31 | 31 | 0.34% | 0.46% | 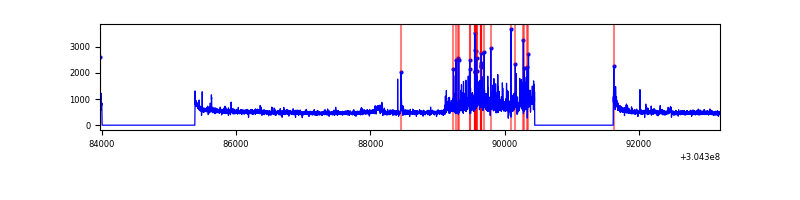 |
| C | 9235 | 6681 | 0 | 0 | 0.00% | 0.00% | 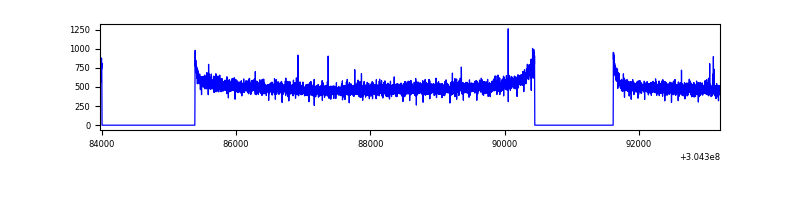 |
| D | 9234 | 6680 | 326 | 326 | 3.53% | 4.88% | 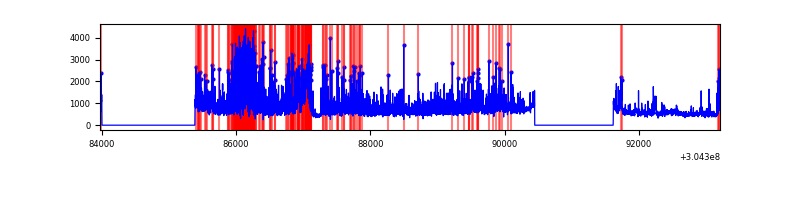 |
Top three noisy pixels from each quadrant. If the there are fewer than three noisy pixels in the level2.evt file, extra rows are filled as -1
| Pixel properties | Quadrant properties | ||||||
|---|---|---|---|---|---|---|---|
| Quadrant | DetID | PixID | Counts | Sigma | Mean | Median | Sigma |
| A | 15 | 192 | 489894 | 2874.1 | 856 | 838 | 170.2 |
| A | 13 | 254 | 8271 | 43.68 | 856 | 838 | 170.2 |
| A | 0 | 226 | 7406 | 38.6 | 856 | 838 | 170.2 |
| B | 7 | 220 | 313733 | 1952.02 | 856 | 838 | 160.3 |
| B | 0 | 190 | 56796 | 349.1 | 856 | 838 | 160.3 |
| B | 0 | 219 | 54451 | 334.47 | 856 | 838 | 160.3 |
| C | 14 | 238 | 128961 | 670.4 | 818 | 825 | 191.1 |
| C | 13 | 61 | 5692 | 25.46 | 818 | 825 | 191.1 |
| C | 9 | 54 | 3195 | 12.4 | 818 | 825 | 191.1 |
| D | 1 | 239 | 1844664 | 9507.57 | 803 | 781 | 193.9 |
| D | 15 | 0 | 317452 | 1632.84 | 803 | 781 | 193.9 |
| D | 1 | 20 | 254546 | 1308.48 | 803 | 781 | 193.9 |
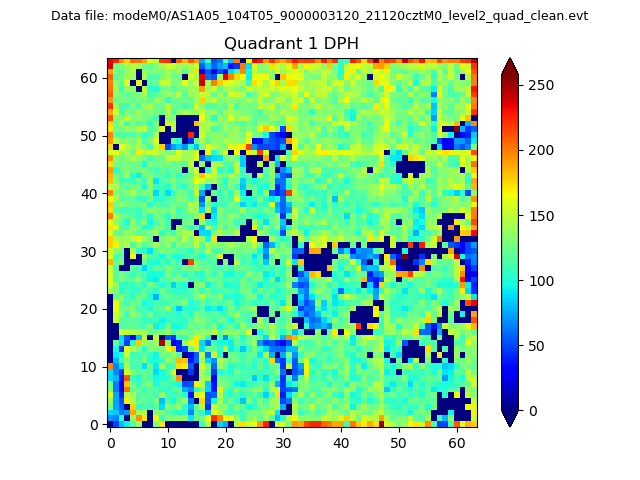
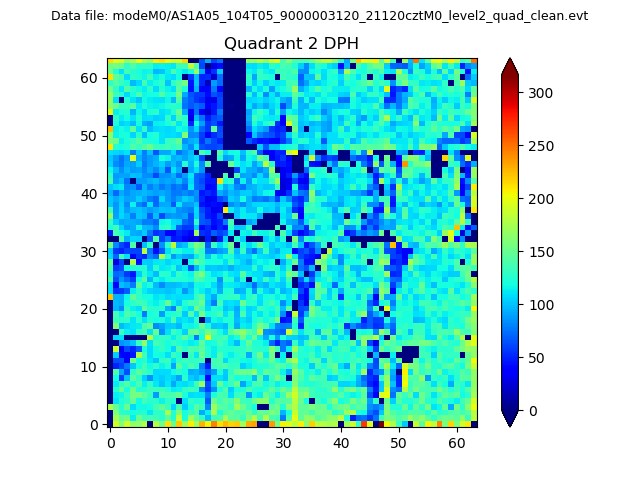
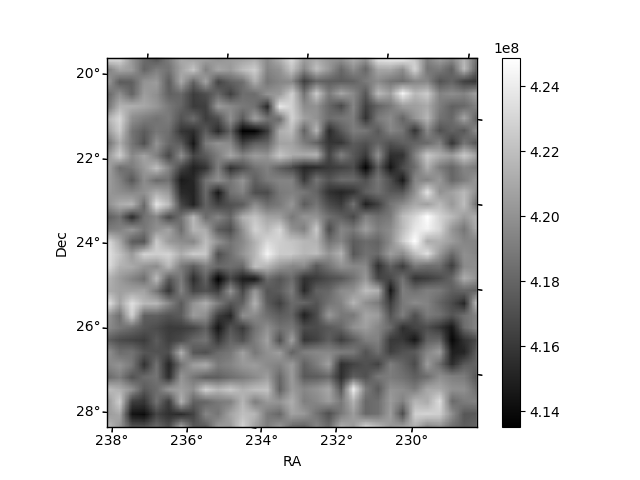
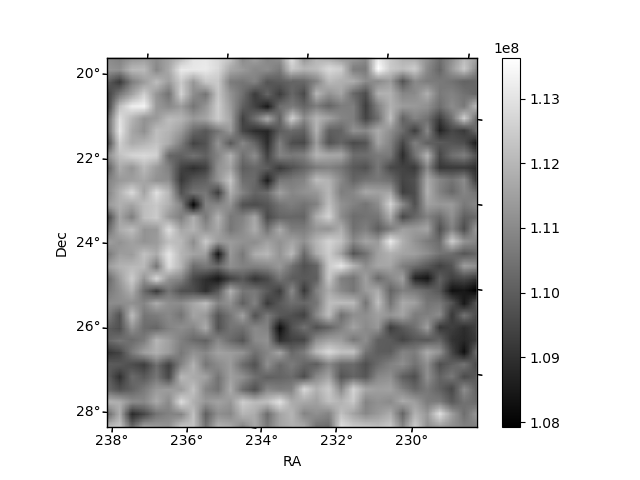
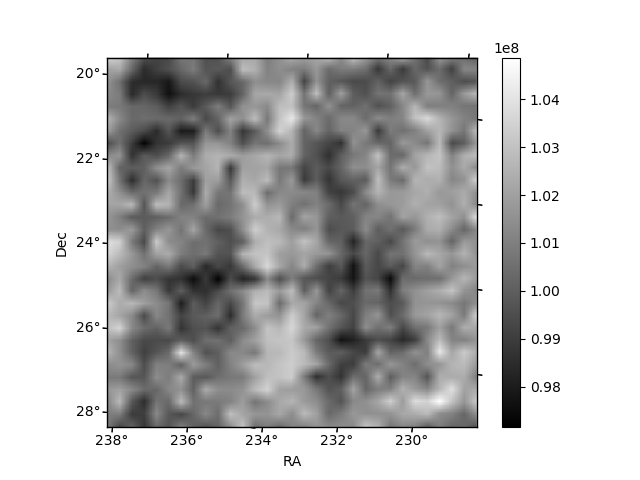
Histogram calculated using DETX and DETY for each event in the final _common_clean file
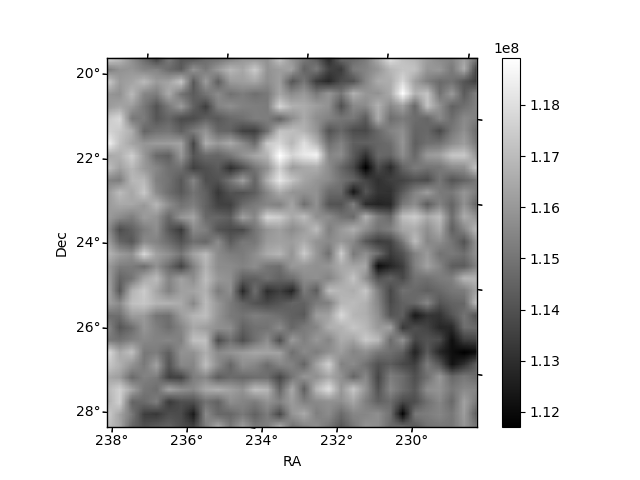
| Quadrant A | 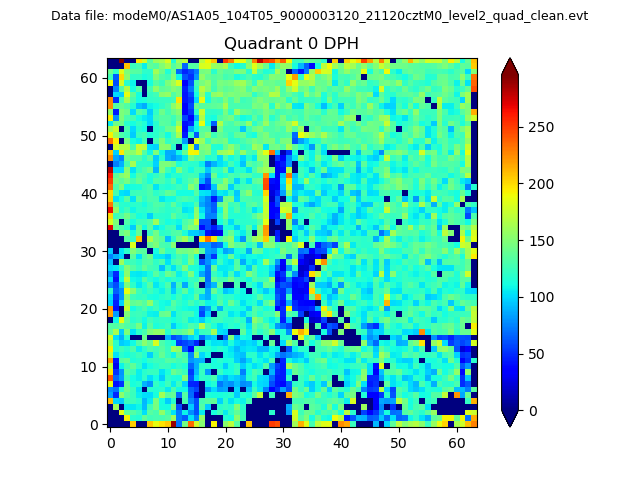 |
 |
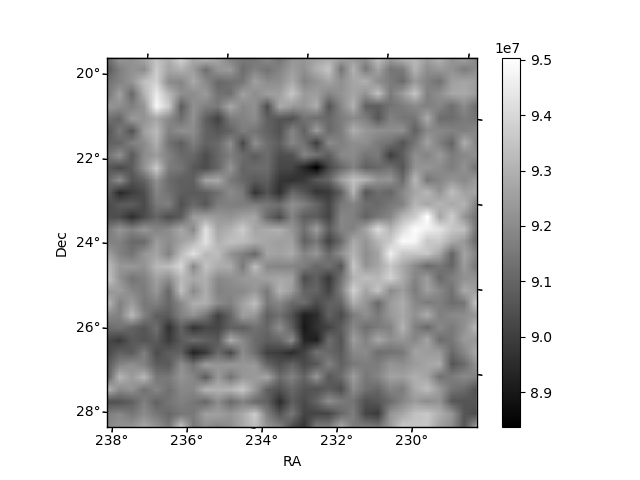
Quadrant B |
|---|---|---|---|
| Quadrant D | 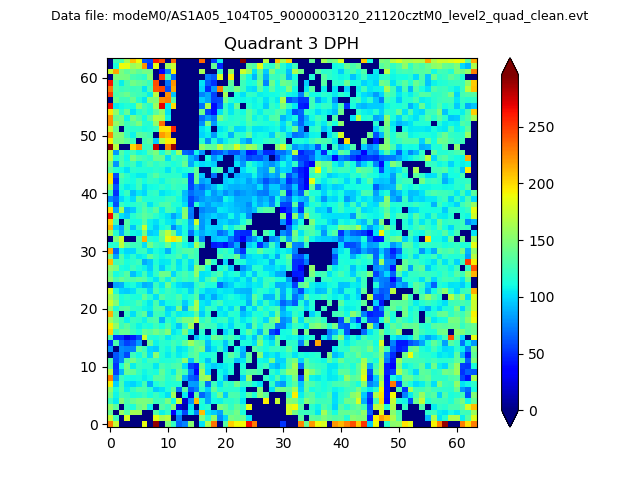 |
 |
Quadrant C |
| Plot type | Count rate plots | Images |
|---|---|---|
| Comparison with Poisson distribution Blue bars denote a histogram of data divided into 1 sec bins. Red curve is a Poisson curve with rate = median count rate of data. |
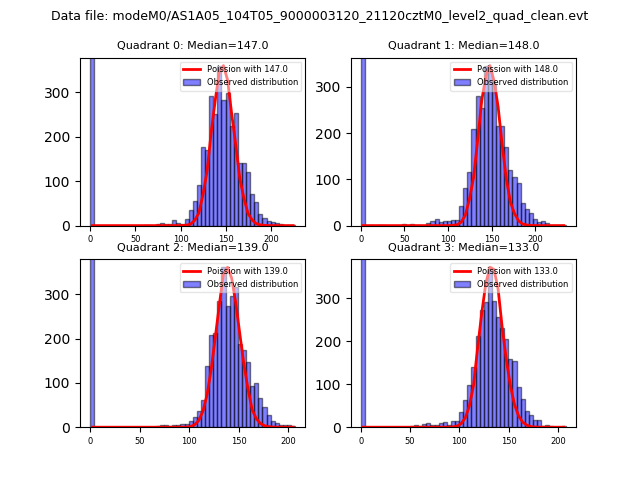 |
 |
| Quadrant-wise count rates Data is divided into 100 sec bins |
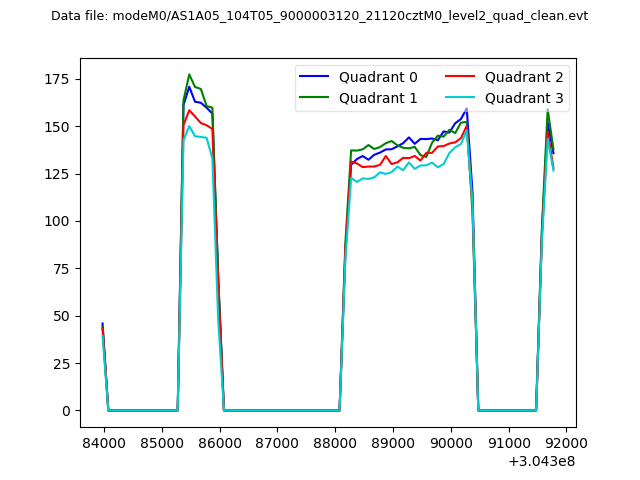 |
|
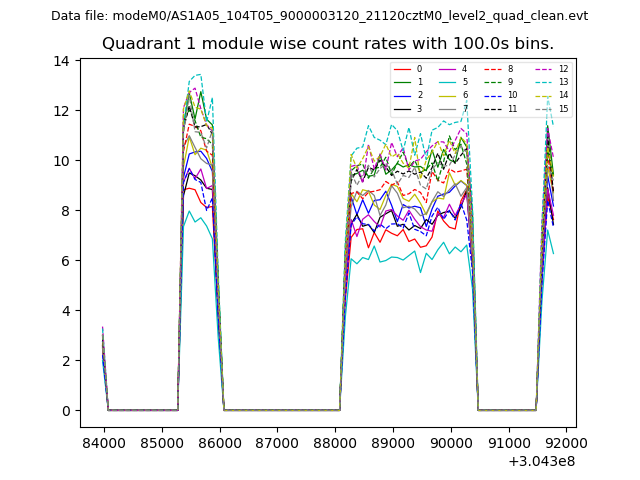
| Module-wise count rates for Quadrant A Data is divided into 100 sec bins |
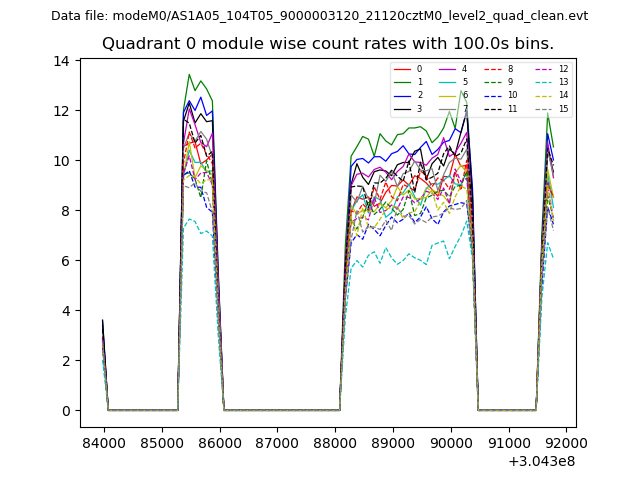 |
 |
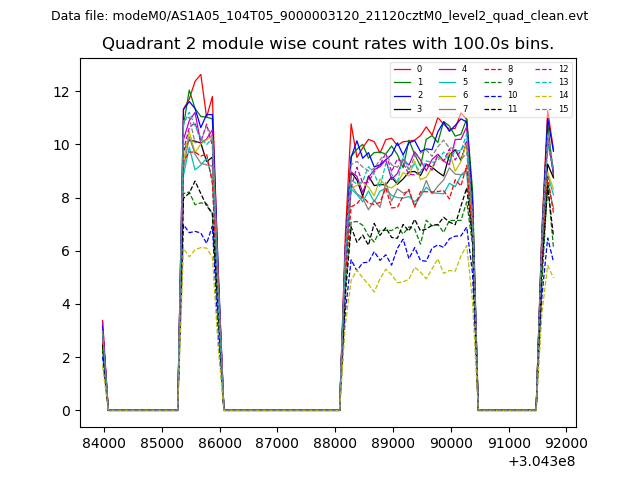
| Module-wise count rates for Quadrant B Data is divided into 100 sec bins |
 |
 |
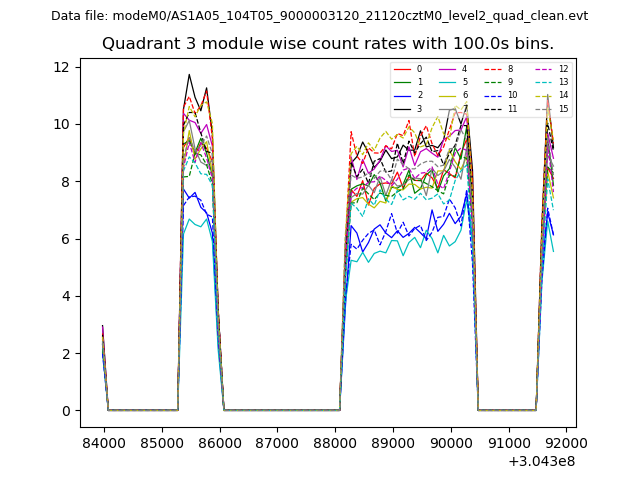
| Module-wise count rates for Quadrant C Data is divided into 100 sec bins |
 |
 |
| Module-wise count rates for Quadrant D Data is divided into 100 sec bins |
 |
 |
| Parameter | Plot |
|---|---|
| CZT HV Monitor | 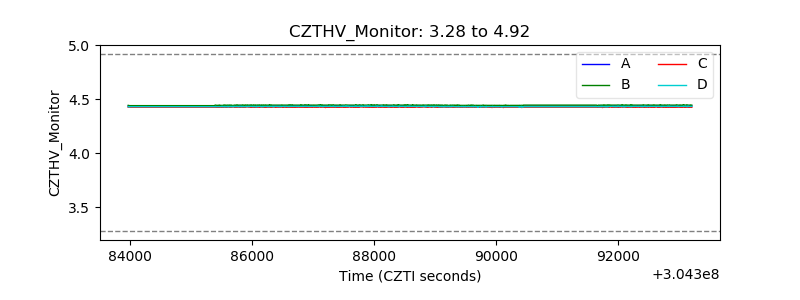 |
| D_VDD |  |
| Temperature 1 | 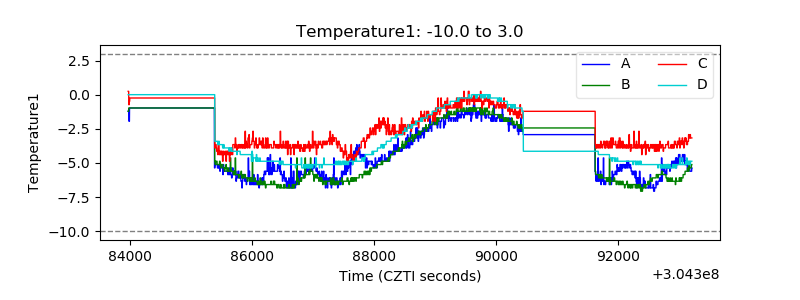 |
| Veto HV Monitor | 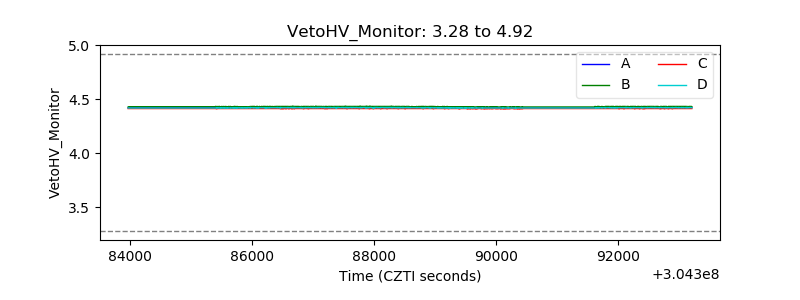 |
| Veto LLD | 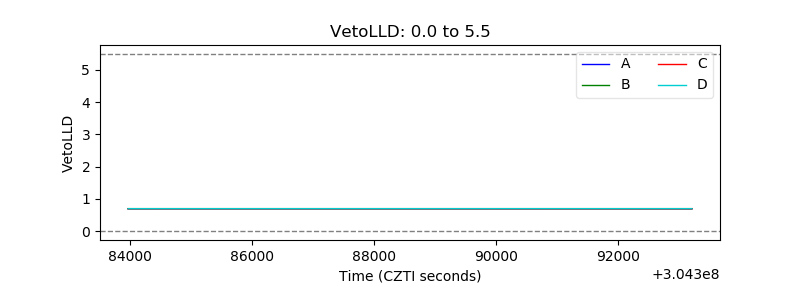 |
| Alpha Counter | 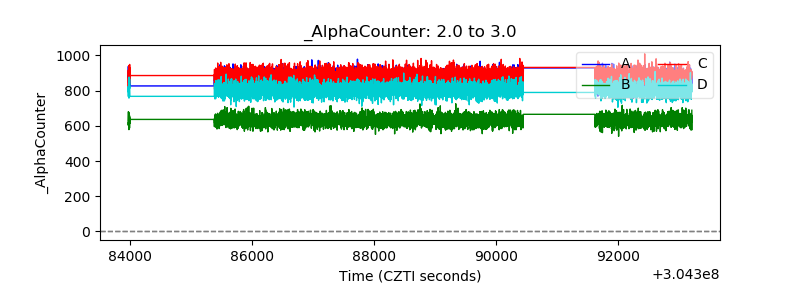 |
| _CPM_Rate | 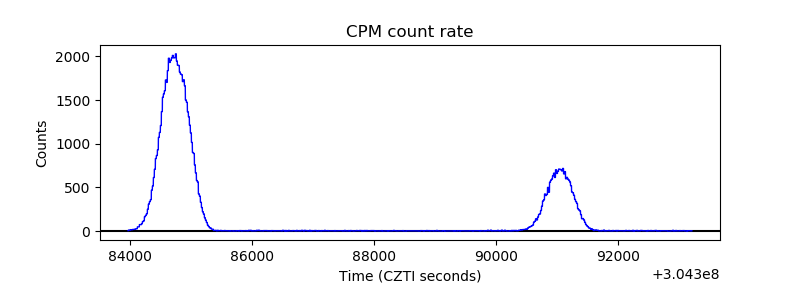 |
| CZT Counter | 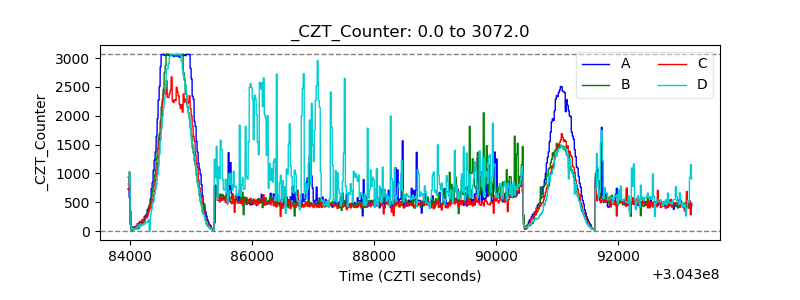 |
| +2.5 Volts monitor | 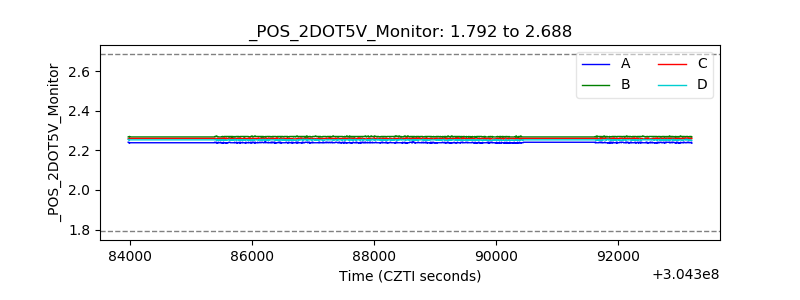 |
| +5 Volts monitor |  |
| _ROLL_ROT | 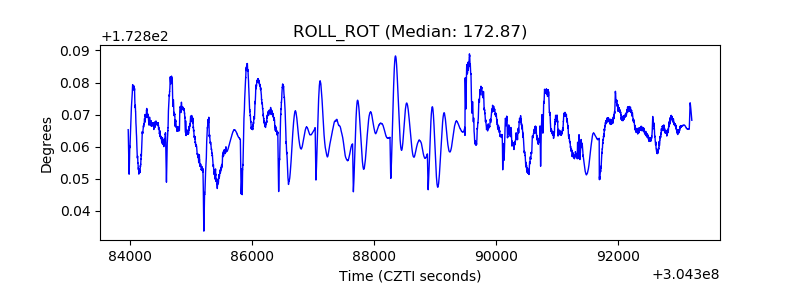 |
| _Roll_DEC | 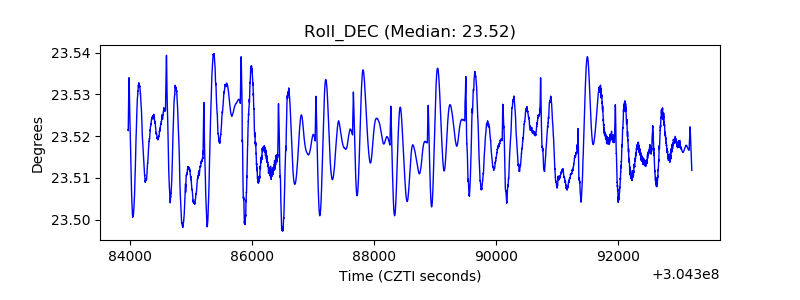 |
| _Roll_RA | 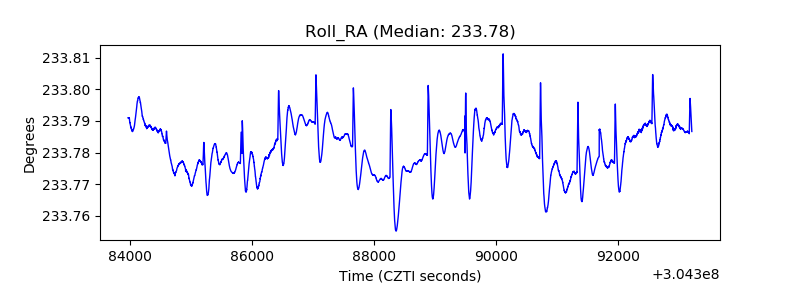 |
| Veto Counter | 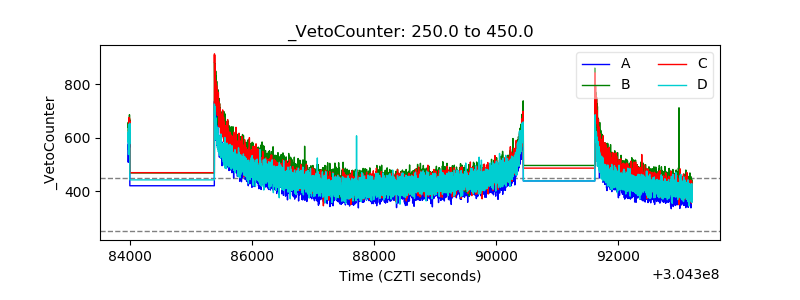 |