| Param | Original file | Final file |
|---|---|---|
| Filename | modeM0/AS1A05_104T05_9000003120_21122cztM0_level2.evt | modeM0/AS1A05_104T05_9000003120_21122cztM0_level2_quad_clean.evt |
| Size (bytes) | 574,896,960 | 80,464,320 |
| Size | 548.3 MB | 76.7 MB |
| Events in quadrant A | 3,665,955 | 497,607 |
| Events in quadrant B | 4,019,058 | 493,940 |
| Events in quadrant C | 3,669,957 | 470,921 |
| Events in quadrant D | 5,547,864 | 453,183 |
| Mode SS | |||
|---|---|---|---|
| Quadrant | BADHDUFLAG | Total packets | Discarded packets |
| A | 0 | 154 | 0 |
| B | 0 | 154 | 0 |
| C | 0 | 154 | 0 |
| D | 0 | 154 | 0 |
| Mode M9 | |||
|---|---|---|---|
| Quadrant | BADHDUFLAG | Total packets | Discarded packets |
| A | 0 | 10 | 0 |
| B | 0 | 10 | 0 |
| C | 0 | 10 | 0 |
| D | 0 | 10 | 0 |
| Mode M0 | |||
|---|---|---|---|
| Quadrant | BADHDUFLAG | Total packets | Discarded packets |
| A | 0 | 15698 | 2 |
| B | 0 | 16542 | 2 |
| C | 0 | 15663 | 2 |
| D | 0 | 21537 | 2 |
| Quadrant | Total seconds | Saturated seconds | Saturation percentage |
|---|---|---|---|
| A | 7483 | 289 | 3.862087% |
| B | 7483 | 362 | 4.837632% |
| C | 7483 | 309 | 4.129360% |
| D | 7484 | 487 | 6.507215% |
Noise dominated data is calculated using 1-second bins in cleaned event files. If a bin has >2000 counts, and if more than 50% of those come from <1% of pixels, then it is considered to be noise-dominated and hence unusable.
| Quadrant | # 1 sec bins | Bins with >0 counts | Bins with >2000 counts | High rate bins dominated by noise | Noise dominated (total time) | Noise dominated (detector-on time) | Marked lightcurve |
|---|---|---|---|---|---|---|---|
| A | 8553 | 7486 | 0 | 0 | 0.00% | 0.00% | 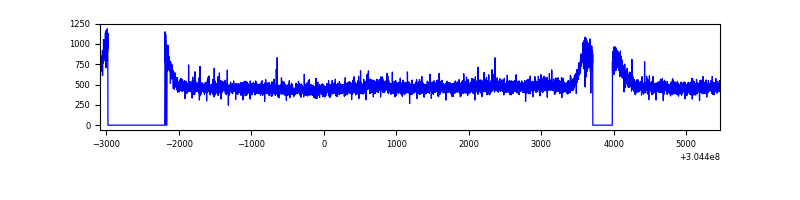 |
| B | 8553 | 7486 | 21 | 21 | 0.25% | 0.28% | 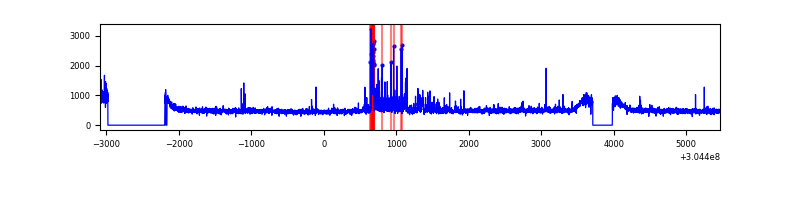 |
| C | 8553 | 7486 | 0 | 0 | 0.00% | 0.00% | 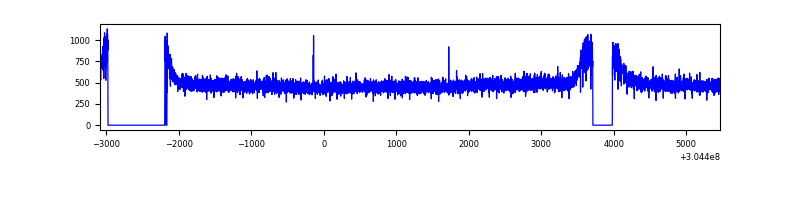 |
| D | 8554 | 7487 | 189 | 189 | 2.21% | 2.52% | 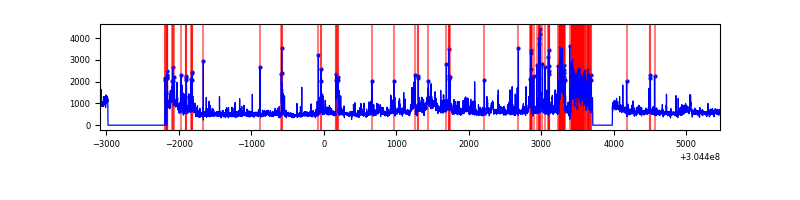 |
Top three noisy pixels from each quadrant. If the there are fewer than three noisy pixels in the level2.evt file, extra rows are filled as -1
| Pixel properties | Quadrant properties | ||||||
|---|---|---|---|---|---|---|---|
| Quadrant | DetID | PixID | Counts | Sigma | Mean | Median | Sigma |
| A | 15 | 192 | 23598 | 117.83 | 944 | 920 | 192.5 |
| A | 13 | 254 | 10113 | 47.76 | 944 | 920 | 192.5 |
| A | 0 | 226 | 8186 | 37.75 | 944 | 920 | 192.5 |
| B | 0 | 182 | 148698 | 802.22 | 944 | 920 | 184.2 |
| B | 7 | 220 | 67552 | 361.71 | 944 | 920 | 184.2 |
| B | 0 | 190 | 27533 | 144.47 | 944 | 920 | 184.2 |
| C | 14 | 238 | 138545 | 640.32 | 905 | 910 | 214.9 |
| C | 13 | 61 | 6467 | 25.85 | 905 | 910 | 214.9 |
| C | 9 | 54 | 3396 | 11.57 | 905 | 910 | 214.9 |
| D | 1 | 20 | 799124 | 3648.21 | 899 | 874 | 218.8 |
| D | 5 | 222 | 645964 | 2948.23 | 899 | 874 | 218.8 |
| D | 1 | 52 | 236849 | 1078.47 | 899 | 874 | 218.8 |
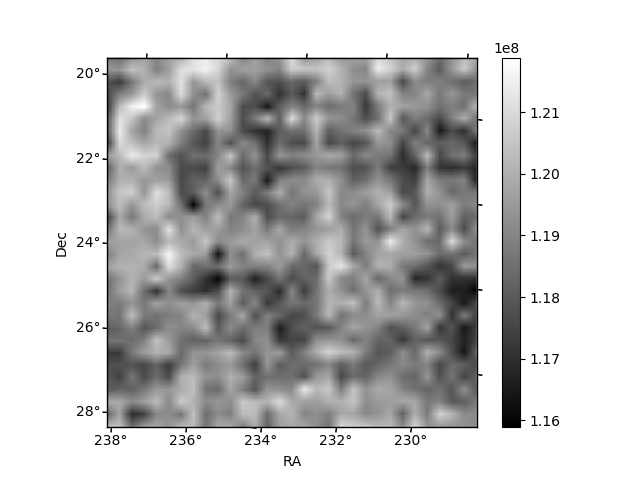
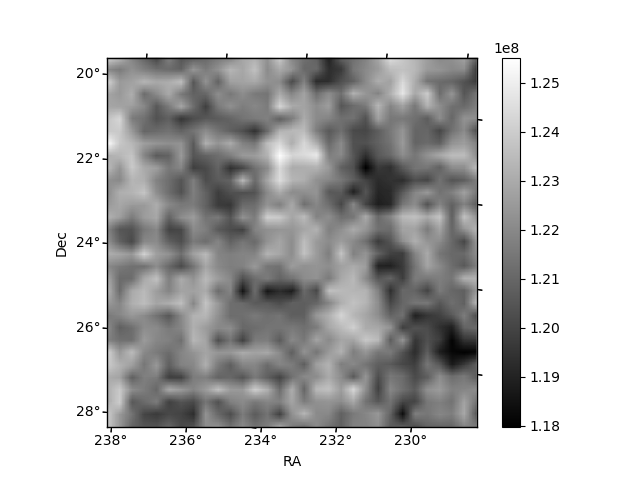
Histogram calculated using DETX and DETY for each event in the final _common_clean file
| Quadrant A | 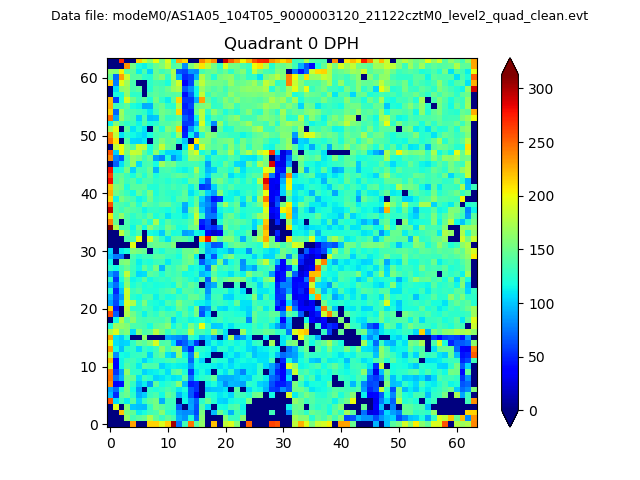 |
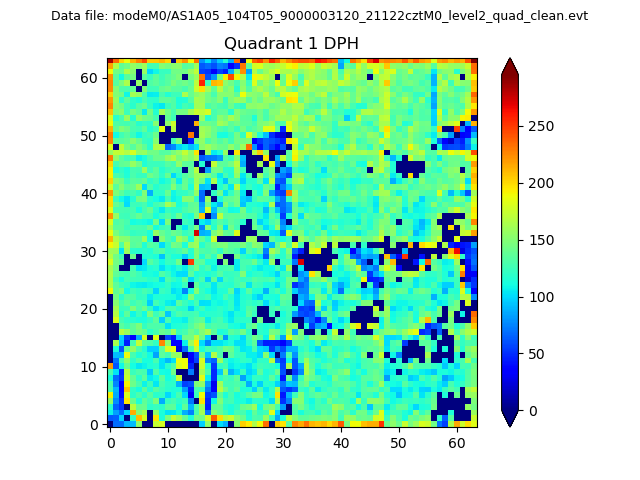 |
Quadrant B |
|---|---|---|---|
| Quadrant D | 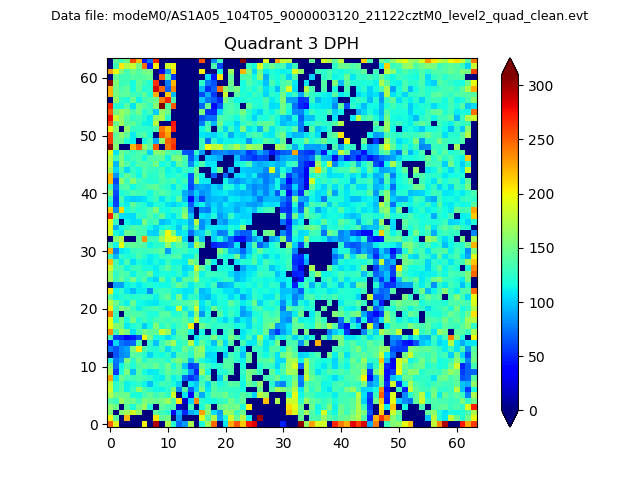 |
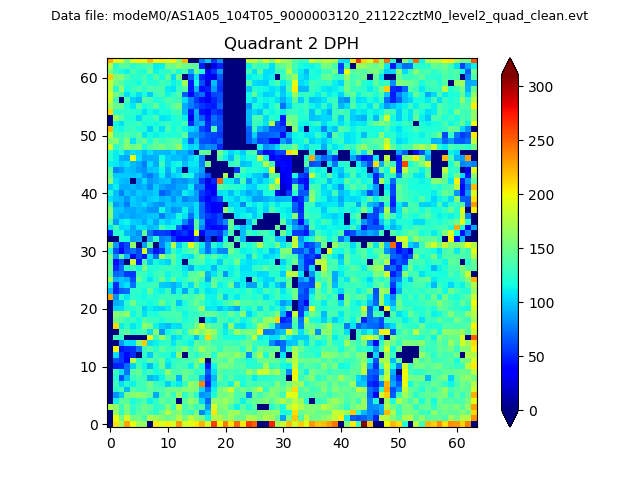 |
Quadrant C |
| Plot type | Count rate plots | Images |
|---|---|---|
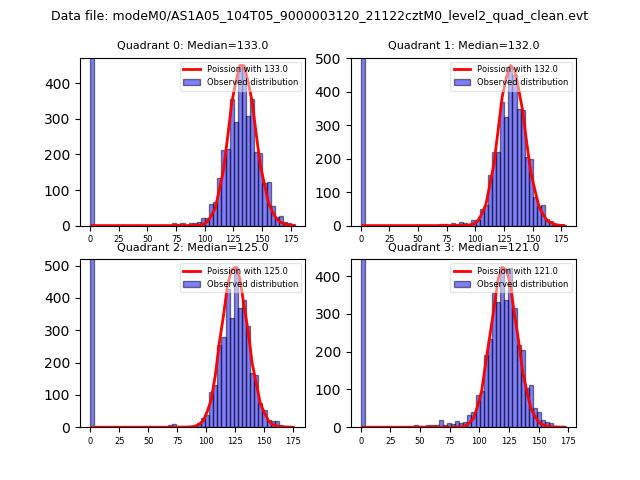
| Comparison with Poisson distribution Blue bars denote a histogram of data divided into 1 sec bins. Red curve is a Poisson curve with rate = median count rate of data. |
 |
 |
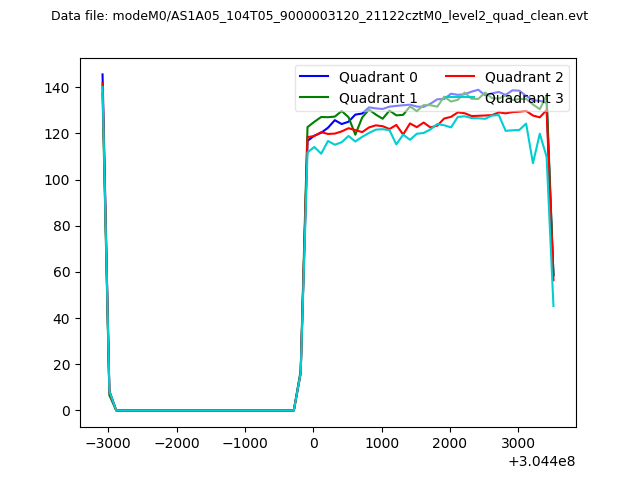
| Quadrant-wise count rates Data is divided into 100 sec bins |
 |
|
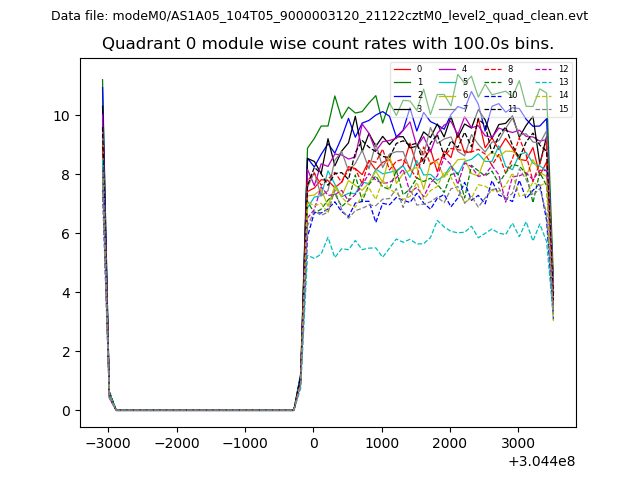
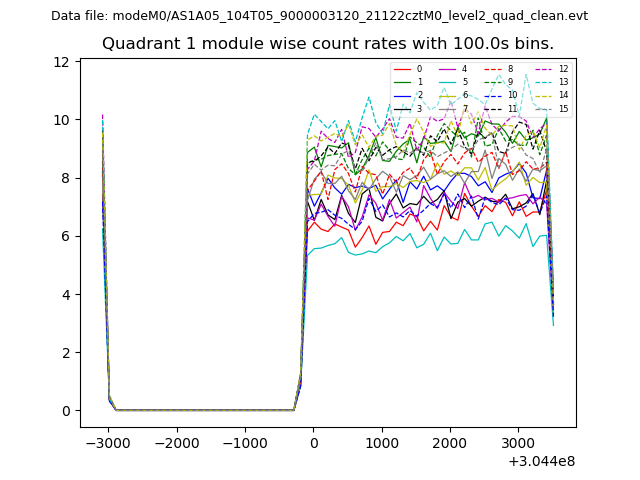
| Module-wise count rates for Quadrant A Data is divided into 100 sec bins |
 |
 |
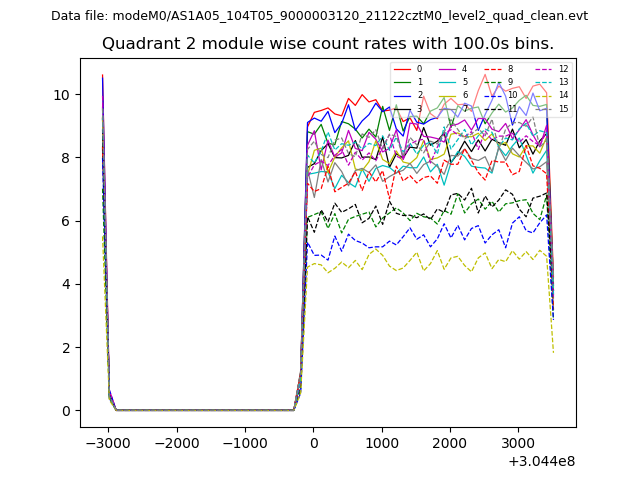
| Module-wise count rates for Quadrant B Data is divided into 100 sec bins |
 |
 |
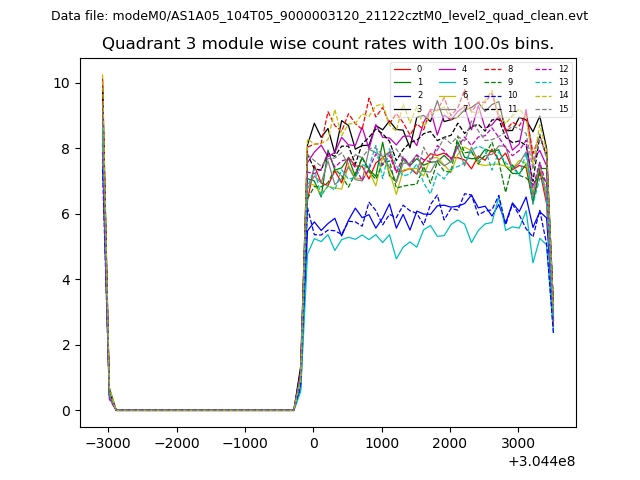
| Module-wise count rates for Quadrant C Data is divided into 100 sec bins |
 |
 |
| Module-wise count rates for Quadrant D Data is divided into 100 sec bins |
 |
 |
| Parameter | Plot |
|---|---|
| CZT HV Monitor | 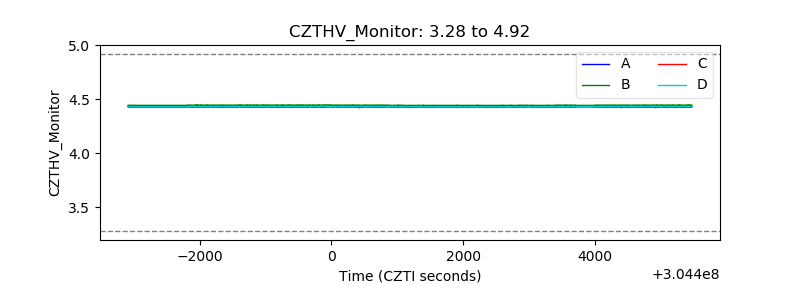 |
| D_VDD | 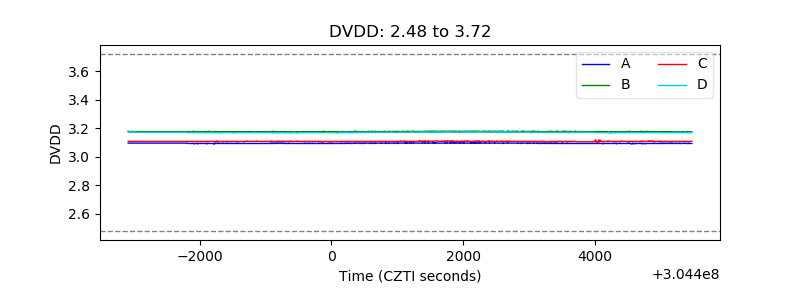 |
| Temperature 1 | 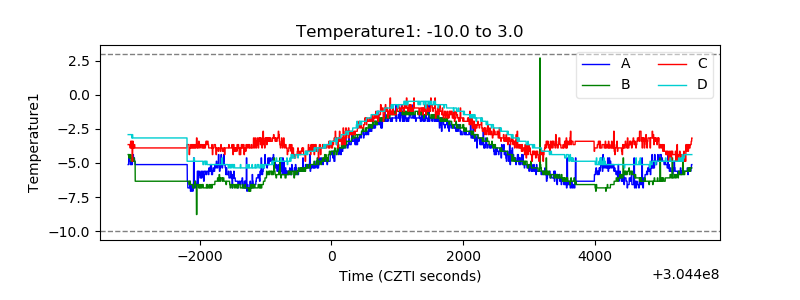 |
| Veto HV Monitor | 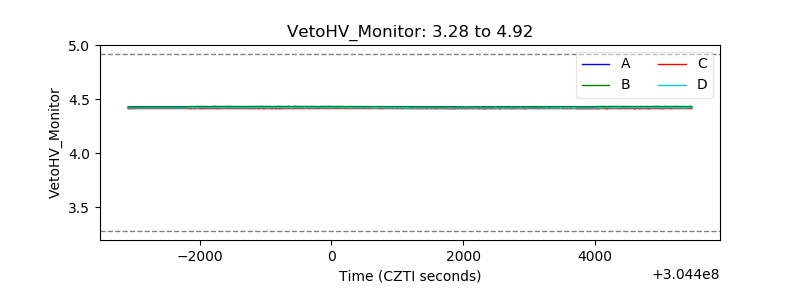 |
| Veto LLD | 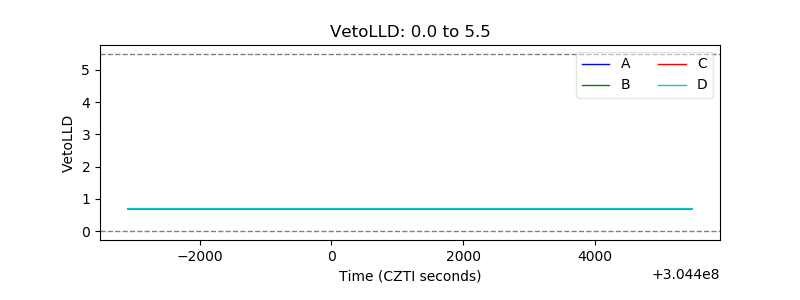 |
| Alpha Counter | 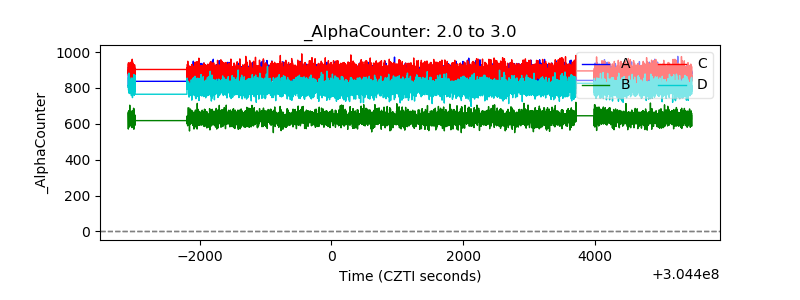 |
| _CPM_Rate | 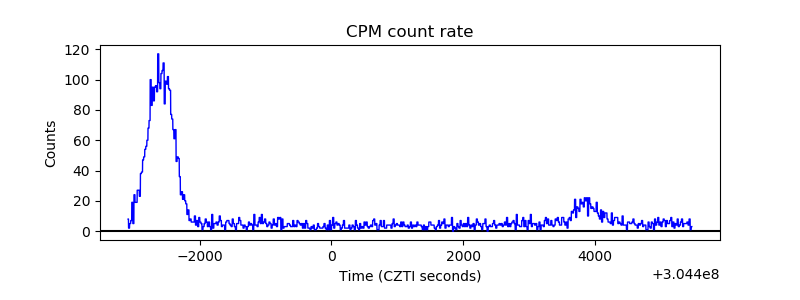 |
| CZT Counter | 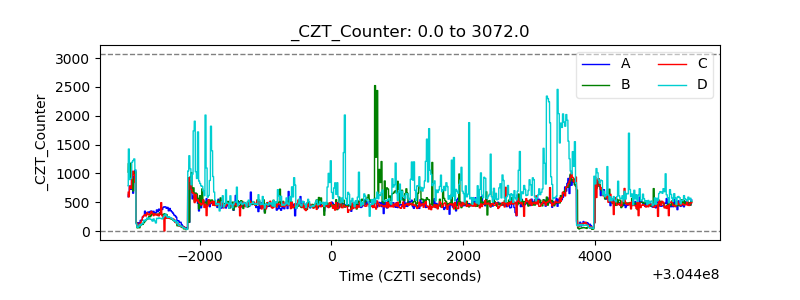 |
| +2.5 Volts monitor |  |
| +5 Volts monitor |  |
| _ROLL_ROT | 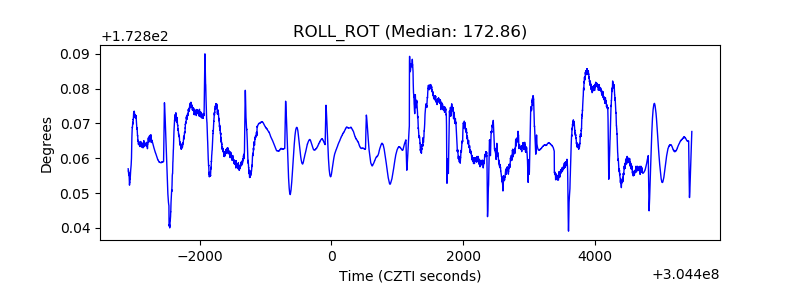 |
| _Roll_DEC | 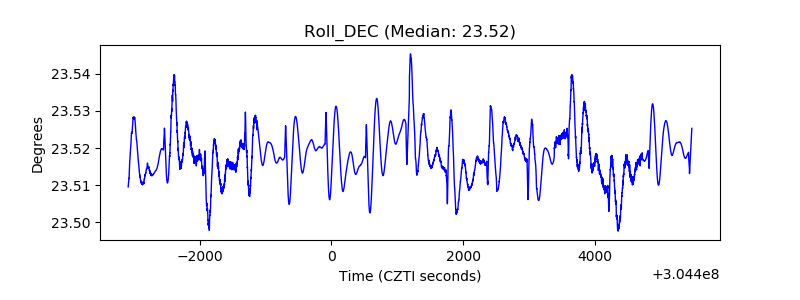 |
| _Roll_RA | 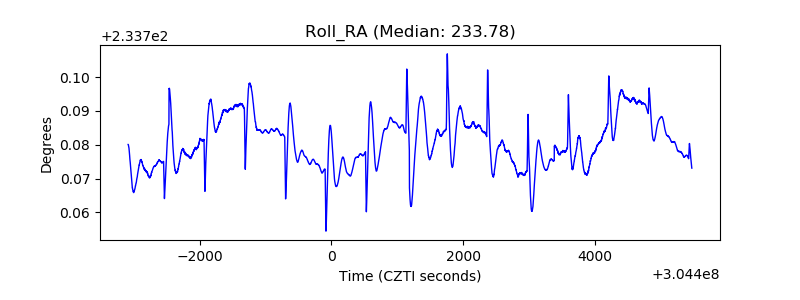 |
| Veto Counter | 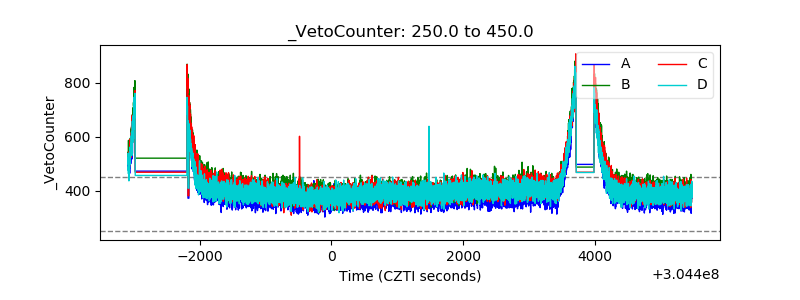 |