| Param | Original file | Final file |
|---|---|---|
| Filename | modeM0/AS1A05_104T05_9000003120_21130cztM0_level2.evt | modeM0/AS1A05_104T05_9000003120_21130cztM0_level2_quad_clean.evt |
| Size (bytes) | 1,695,936,960 | 271,509,120 |
| Size | 1.6 GB | 258.9 MB |
| Events in quadrant A | 10,066,681 | 1,769,964 |
| Events in quadrant B | 11,380,271 | 1,762,820 |
| Events in quadrant C | 9,861,702 | 1,683,159 |
| Events in quadrant D | 18,642,202 | 1,567,541 |
| Mode SS | |||
|---|---|---|---|
| Quadrant | BADHDUFLAG | Total packets | Discarded packets |
| A | 0 | 426 | 0 |
| B | 0 | 426 | 0 |
| C | 0 | 426 | 0 |
| D | 0 | 426 | 0 |
| Mode M9 | |||
|---|---|---|---|
| Quadrant | BADHDUFLAG | Total packets | Discarded packets |
| A | 0 | 7 | 0 |
| B | 0 | 7 | 0 |
| C | 0 | 7 | 0 |
| D | 0 | 7 | 0 |
| Mode M0 | |||
|---|---|---|---|
| Quadrant | BADHDUFLAG | Total packets | Discarded packets |
| A | 0 | 43595 | 3 |
| B | 0 | 47081 | 3 |
| C | 0 | 42946 | 3 |
| D | 0 | 69584 | 3 |
| Quadrant | Total seconds | Saturated seconds | Saturation percentage |
|---|---|---|---|
| A | 20907 | 543 | 2.597216% |
| B | 20908 | 760 | 3.634972% |
| C | 20908 | 575 | 2.750143% |
| D | 20908 | 1986 | 9.498756% |
Noise dominated data is calculated using 1-second bins in cleaned event files. If a bin has >2000 counts, and if more than 50% of those come from <1% of pixels, then it is considered to be noise-dominated and hence unusable.
| Quadrant | # 1 sec bins | Bins with >0 counts | Bins with >2000 counts | High rate bins dominated by noise | Noise dominated (total time) | Noise dominated (detector-on time) | Marked lightcurve |
|---|---|---|---|---|---|---|---|
| A | 21652 | 20911 | 0 | 0 | 0.00% | 0.00% | 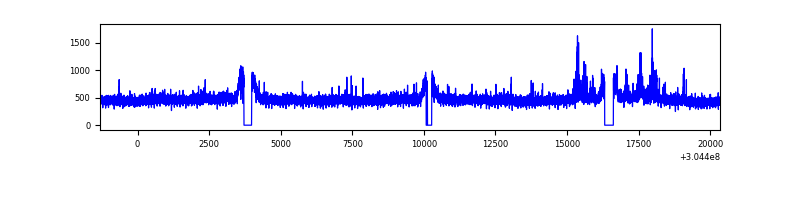 |
| B | 21653 | 20911 | 112 | 112 | 0.52% | 0.54% | 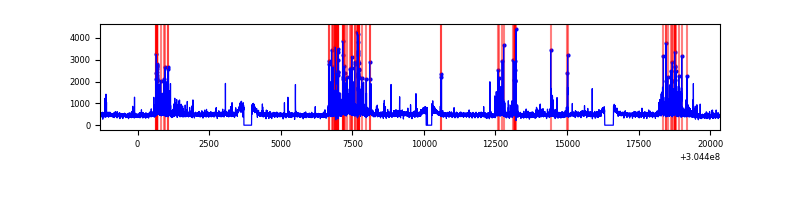 |
| C | 21653 | 20912 | 0 | 0 | 0.00% | 0.00% | 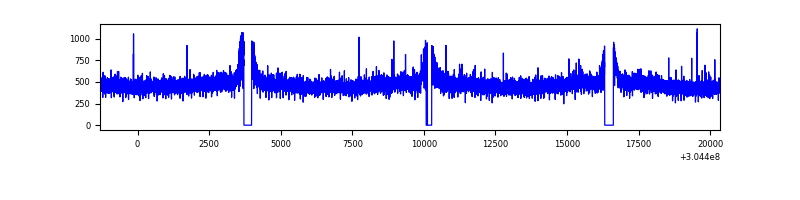 |
| D | 21652 | 20911 | 1546 | 1546 | 7.14% | 7.39% | 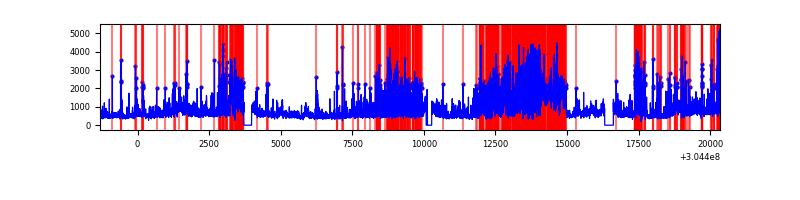 |
Top three noisy pixels from each quadrant. If the there are fewer than three noisy pixels in the level2.evt file, extra rows are filled as -1
| Pixel properties | Quadrant properties | ||||||
|---|---|---|---|---|---|---|---|
| Quadrant | DetID | PixID | Counts | Sigma | Mean | Median | Sigma |
| A | 15 | 192 | 256764 | 498.48 | 2538 | 2477 | 510.1 |
| A | 13 | 254 | 26035 | 46.18 | 2538 | 2477 | 510.1 |
| A | 0 | 226 | 22035 | 38.34 | 2538 | 2477 | 510.1 |
| B | 7 | 220 | 800412 | 1665.85 | 2523 | 2457 | 479.0 |
| B | 0 | 228 | 162939 | 335.03 | 2523 | 2457 | 479.0 |
| B | 0 | 182 | 137204 | 281.3 | 2523 | 2457 | 479.0 |
| C | 14 | 238 | 375752 | 654.42 | 2426 | 2442 | 570.4 |
| C | 13 | 61 | 17212 | 25.89 | 2426 | 2442 | 570.4 |
| C | 9 | 54 | 13000 | 18.51 | 2426 | 2442 | 570.4 |
| D | 5 | 222 | 3242109 | 5542.98 | 2399 | 2331 | 584.5 |
| D | 1 | 239 | 3014163 | 5152.98 | 2399 | 2331 | 584.5 |
| D | 1 | 20 | 1817497 | 3105.59 | 2399 | 2331 | 584.5 |
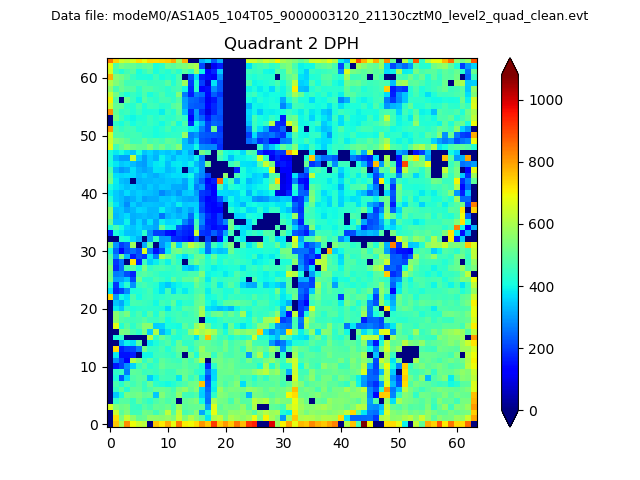
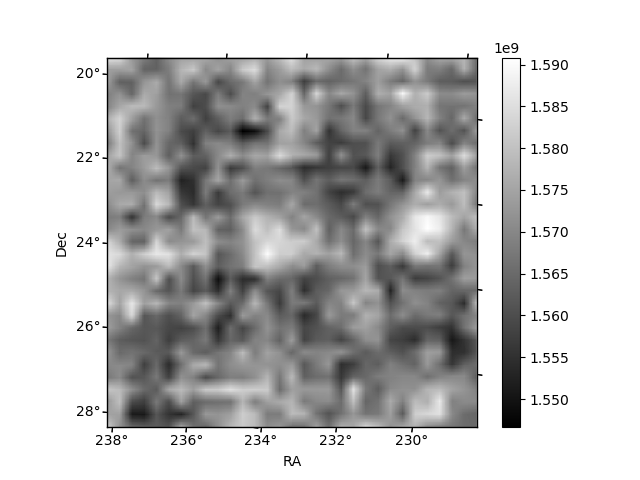
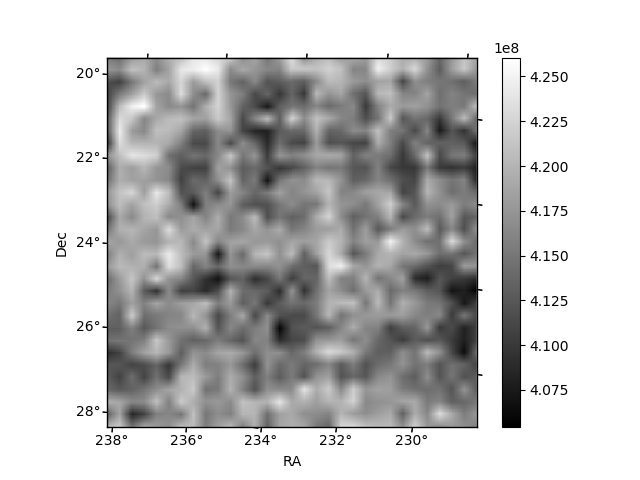
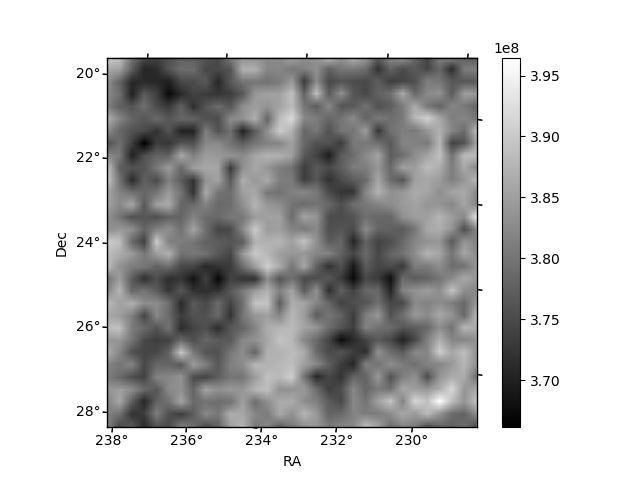
Histogram calculated using DETX and DETY for each event in the final _common_clean file
| Quadrant A | 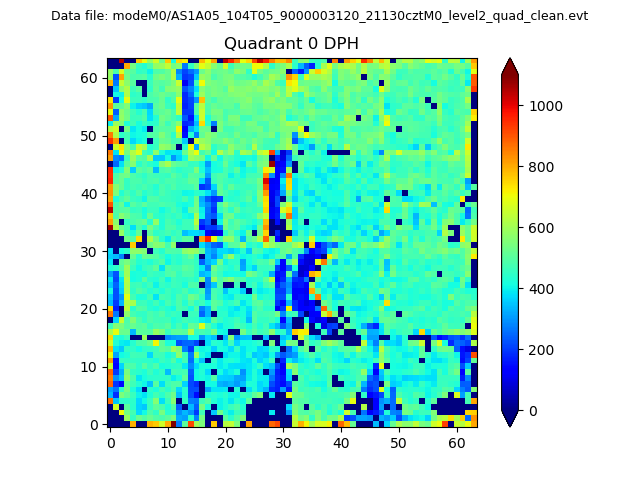 |
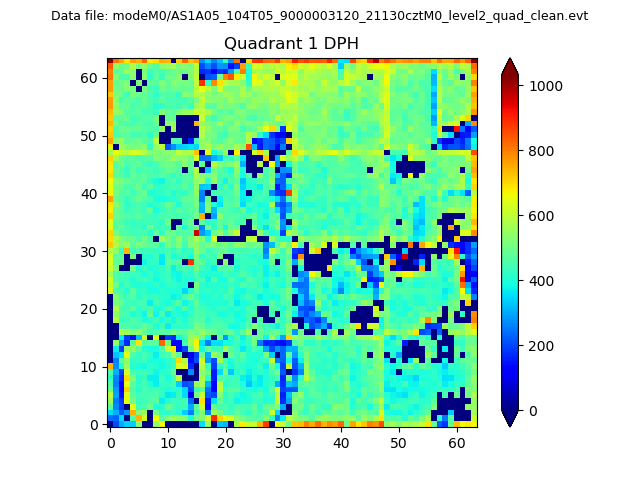 |
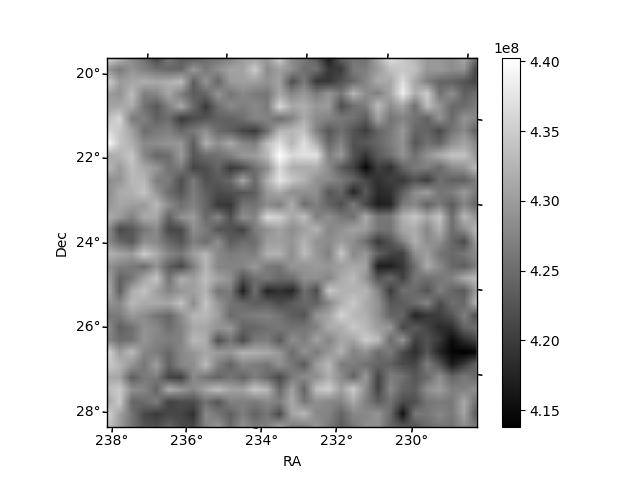
Quadrant B |
|---|---|---|---|
| Quadrant D | 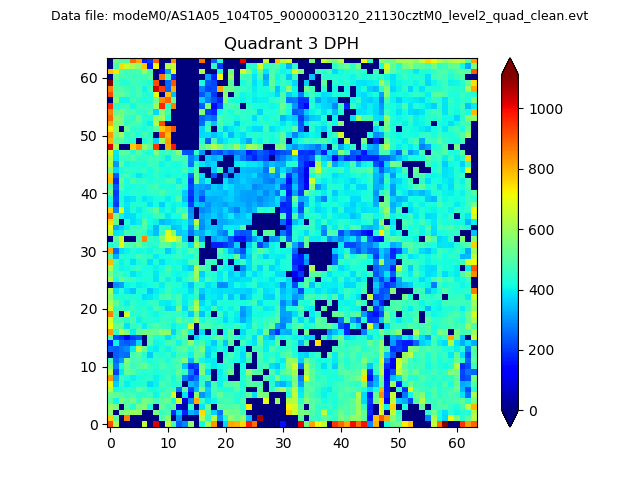 |
 |
Quadrant C |
| Plot type | Count rate plots | Images |
|---|---|---|
| Comparison with Poisson distribution Blue bars denote a histogram of data divided into 1 sec bins. Red curve is a Poisson curve with rate = median count rate of data. |
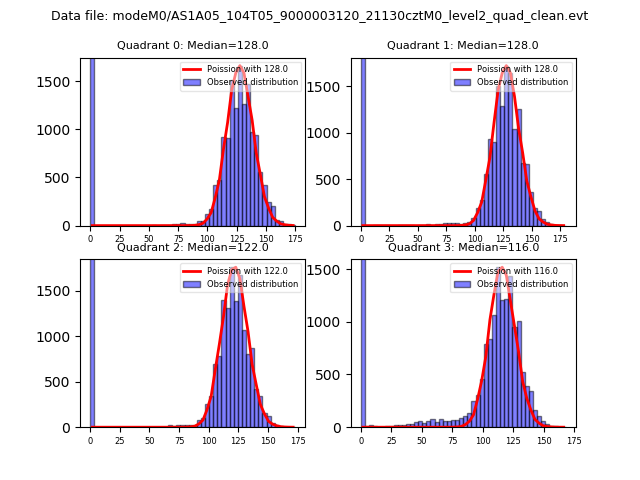 |
 |
| Quadrant-wise count rates Data is divided into 100 sec bins |
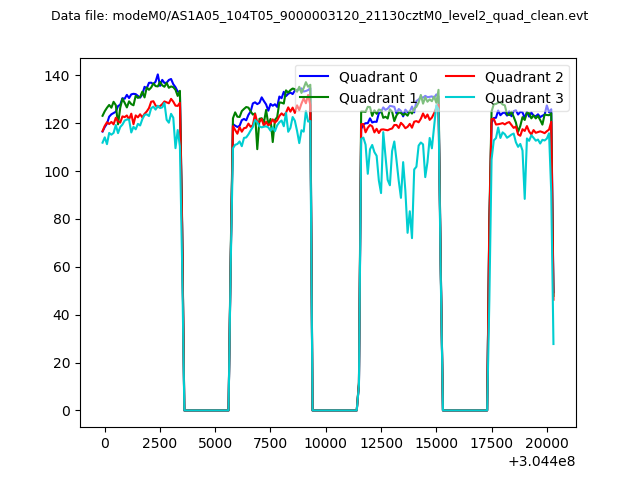 |
|
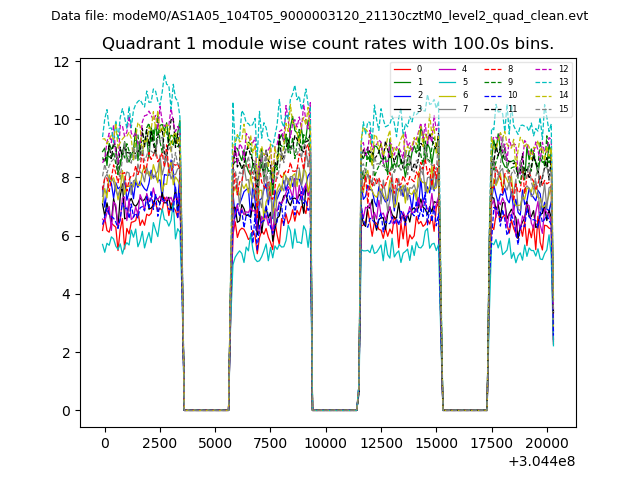
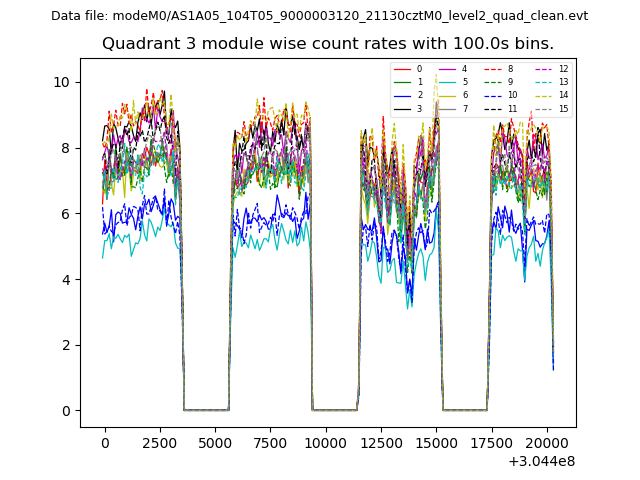
| Module-wise count rates for Quadrant A Data is divided into 100 sec bins |
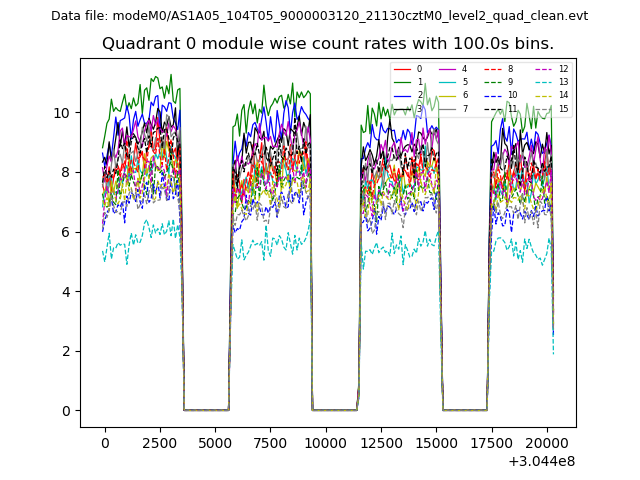 |
 |
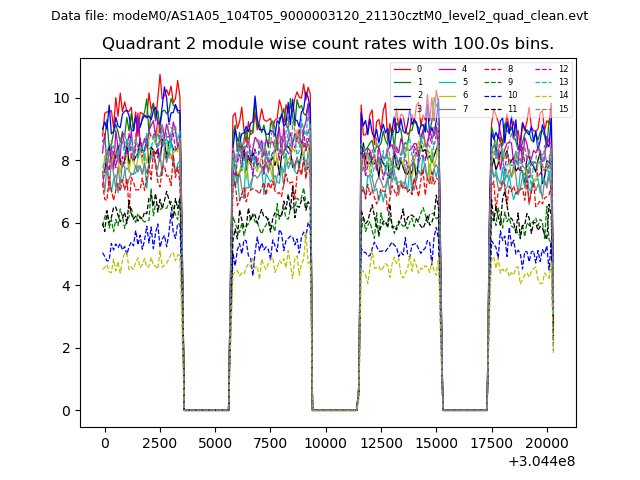
| Module-wise count rates for Quadrant B Data is divided into 100 sec bins |
 |
 |
| Module-wise count rates for Quadrant C Data is divided into 100 sec bins |
 |
 |
| Module-wise count rates for Quadrant D Data is divided into 100 sec bins |
 |
 |
| Parameter | Plot |
|---|---|
| CZT HV Monitor | 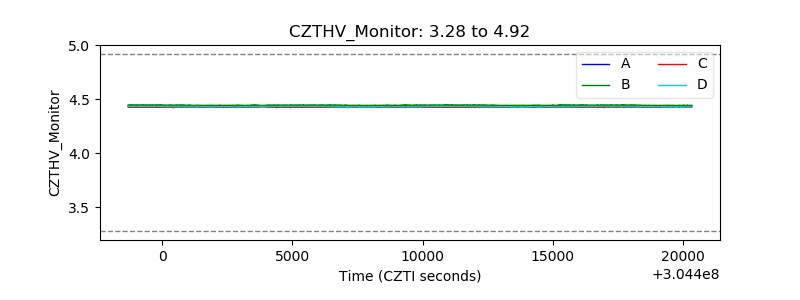 |
| D_VDD |  |
| Temperature 1 | 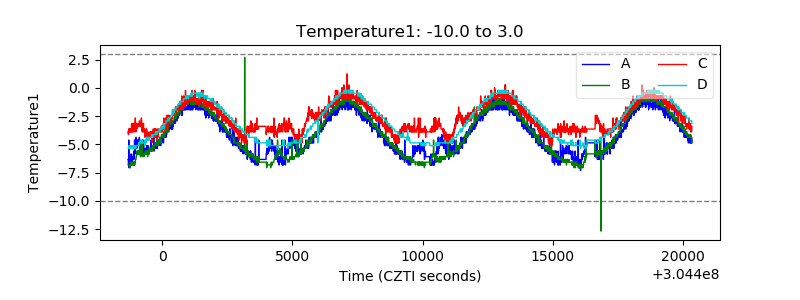 |
| Veto HV Monitor | 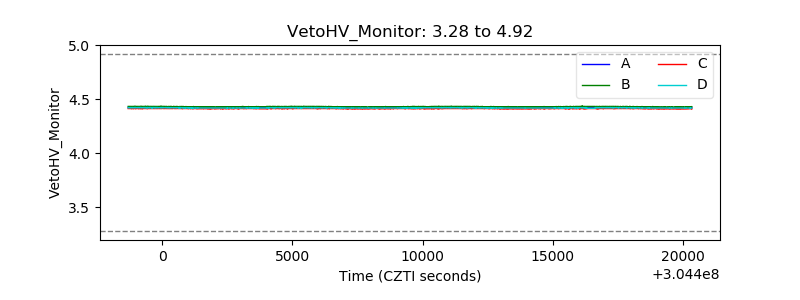 |
| Veto LLD | 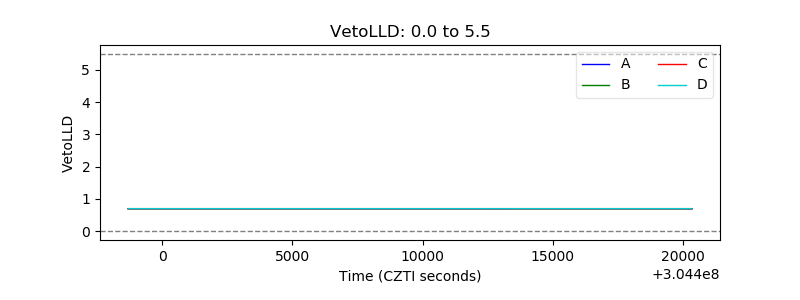 |
| Alpha Counter | 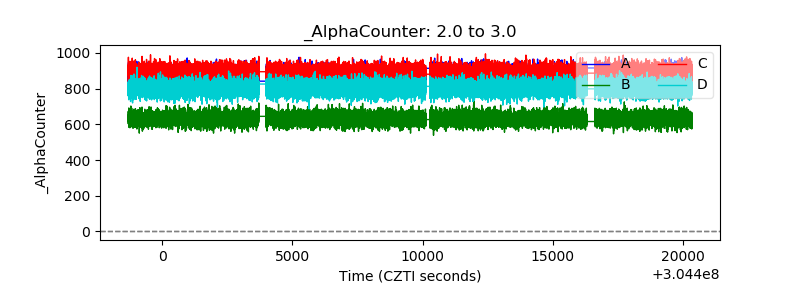 |
| _CPM_Rate | 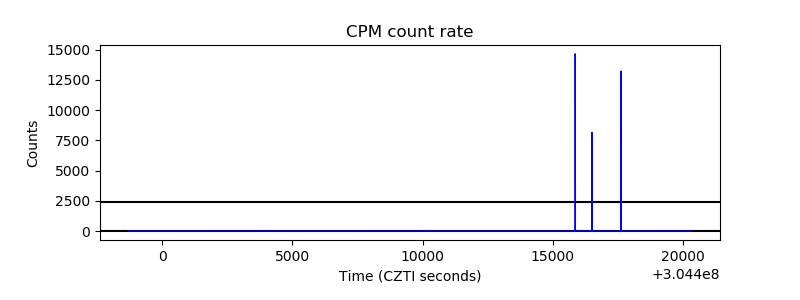 |
| CZT Counter | 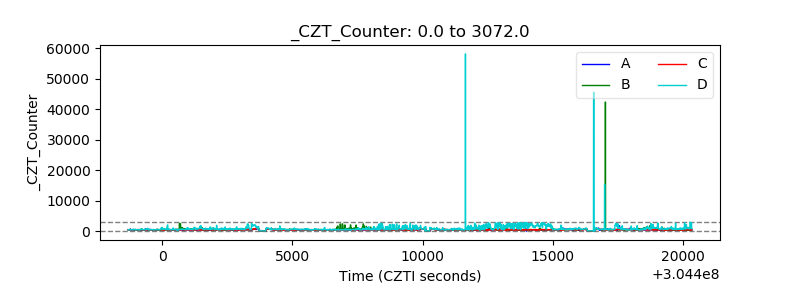 |
| +2.5 Volts monitor | 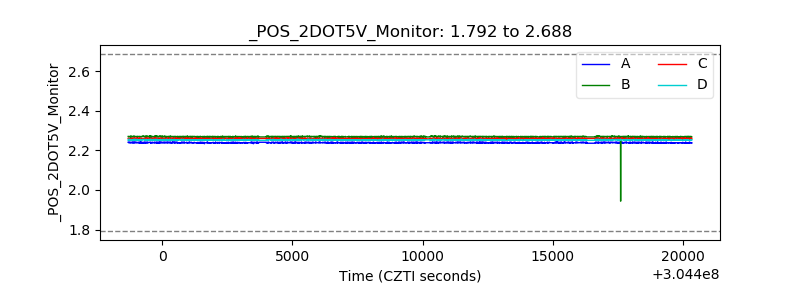 |
| +5 Volts monitor |  |
| _ROLL_ROT | 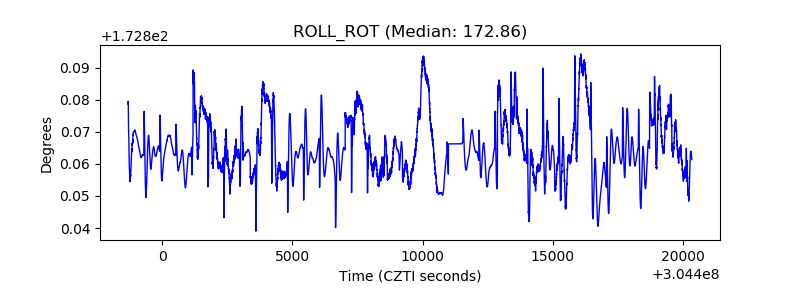 |
| _Roll_DEC | 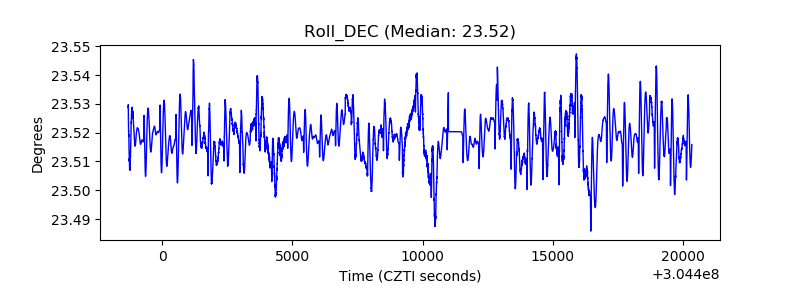 |
| _Roll_RA | 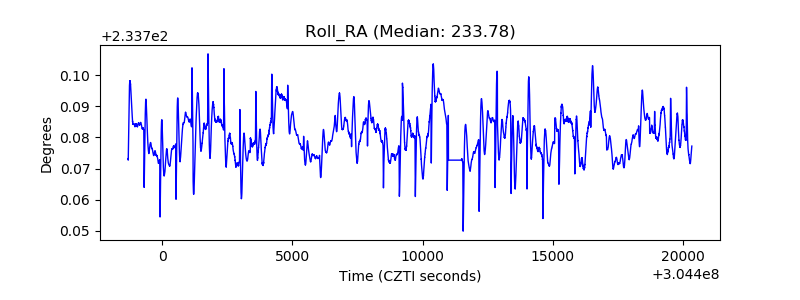 |
| Veto Counter | 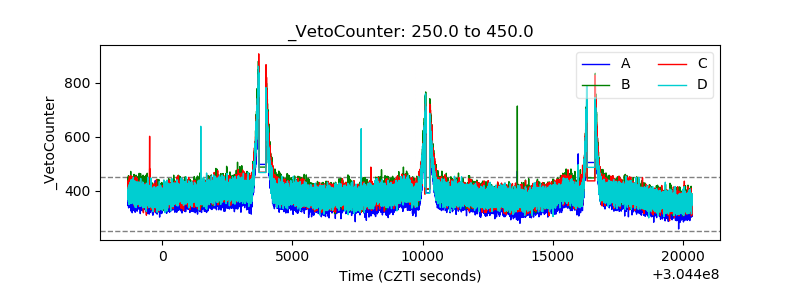 |