| Param | Original file | Final file |
|---|---|---|
| Filename | modeM0/AS1A06_009T03_9000003122cztM0_level2.fits | modeM0/AS1A06_009T03_9000003122cztM0_level2_quad_clean.evt |
| Size (bytes) | 432,112,320 | 277,925,760 |
| Size | 412.1 MB | 265.1 MB |
| Events in quadrant A | 2,678,986 | 1,443,473 |
| Events in quadrant B | 2,589,356 | 1,429,353 |
| Events in quadrant C | 2,635,934 | 1,387,834 |
| Events in quadrant D | 2,211,810 | 1,184,753 |
| Mode M0 | |||
|---|---|---|---|
| Quadrant | BADHDUFLAG | Total packets | Discarded packets |
| A | 0 | 103459 | 0 |
| B | 0 | 99259 | 0 |
| C | 0 | 91401 | 0 |
| D | 0 | 128531 | 0 |
| Mode M9 | |||
|---|---|---|---|
| Quadrant | BADHDUFLAG | Total packets | Discarded packets |
| A | 0 | 96 | 0 |
| B | 0 | 97 | 0 |
| C | 0 | 96 | 0 |
| D | 0 | 97 | 0 |
| Mode SS | |||
|---|---|---|---|
| Quadrant | BADHDUFLAG | Total packets | Discarded packets |
| A | 0 | 881 | 0 |
| B | 0 | 876 | 0 |
| C | 0 | 877 | 0 |
| D | 0 | 876 | 0 |
| Quadrant | Total seconds | Saturated seconds | Saturation percentage |
|---|---|---|---|
| A | 43278 | 1015 | 2.345302% |
| B | 43235 | 883 | 2.042327% |
| C | 43321 | 749 | 1.728954% |
| D | 43232 | 2292 | 5.301628% |
Noise dominated data is calculated using 1-second bins in cleaned event files. If a bin has >2000 counts, and if more than 50% of those come from <1% of pixels, then it is considered to be noise-dominated and hence unusable.
| Quadrant | # 1 sec bins | Bins with >0 counts | Bins with >2000 counts | High rate bins dominated by noise | Noise dominated (total time) | Noise dominated (detector-on time) | Marked lightcurve |
|---|---|---|---|---|---|---|---|
| A | 55211 | 43712 | 0 | 0 | 0.00% | 0.00% |  |
| B | 55211 | 43707 | 0 | 0 | 0.00% | 0.00% |  |
| C | 55211 | 43774 | 0 | 0 | 0.00% | 0.00% | 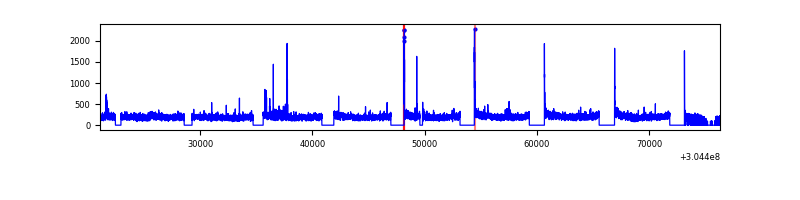 |
| D | 55209 | 43672 | 0 | 0 | 0.00% | 0.00% |  |
Top three noisy pixels from each quadrant. If the there are fewer than three noisy pixels in the level2.evt file, extra rows are filled as -1
| Pixel properties | Quadrant properties | ||||||
|---|---|---|---|---|---|---|---|
| Quadrant | DetID | PixID | Counts | Sigma | Mean | Median | Sigma |
| A | 0 | 29 | 2586 | 11.25 | 697 | 655 | 171.6 |
| A | 7 | 110 | 2153 | 8.72 | 697 | 655 | 171.6 |
| A | 0 | 30 | 2031 | 8.01 | 697 | 655 | 171.6 |
| B | 2 | 9 | 2009 | 10.02 | 684 | 654 | 135.2 |
| B | 14 | 254 | 1731 | 7.96 | 684 | 654 | 135.2 |
| B | 5 | 225 | 1728 | 7.94 | 684 | 654 | 135.2 |
| C | 12 | 249 | 1800 | 6.39 | 695 | 651 | 179.9 |
| C | 12 | 241 | 1764 | 6.19 | 695 | 651 | 179.9 |
| C | 9 | 233 | 1759 | 6.16 | 695 | 651 | 179.9 |
| D | 3 | 14 | 1687 | 6.52 | 633 | 576 | 170.3 |
| D | 10 | 189 | 1572 | 5.85 | 633 | 576 | 170.3 |
| D | 1 | 31 | 1557 | 5.76 | 633 | 576 | 170.3 |
Histogram calculated using DETX and DETY for each event in the final _common_clean file
| Quadrant A | 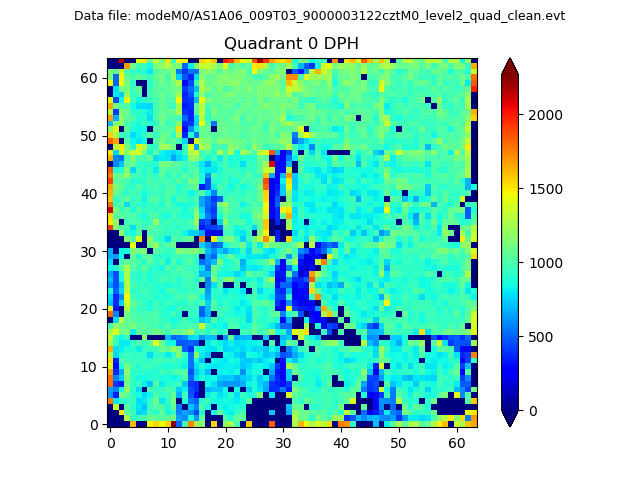 |
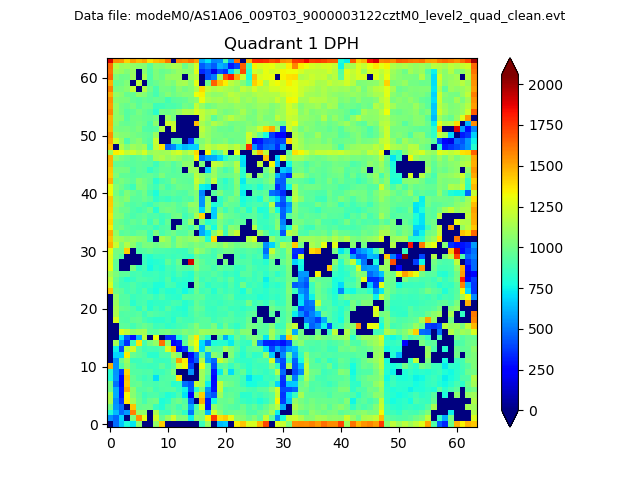 |
Quadrant B |
|---|---|---|---|
| Quadrant D |  |
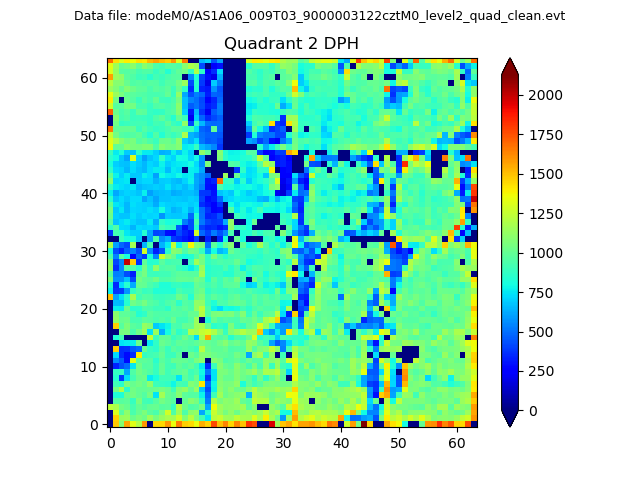 |
Quadrant C |
| Plot type | Count rate plots | Images |
|---|---|---|
| Comparison with Poisson distribution Blue bars denote a histogram of data divided into 1 sec bins. Red curve is a Poisson curve with rate = median count rate of data. |
 |
 |
| Quadrant-wise count rates Data is divided into 100 sec bins |
 |
|
| Module-wise count rates for Quadrant A Data is divided into 100 sec bins |
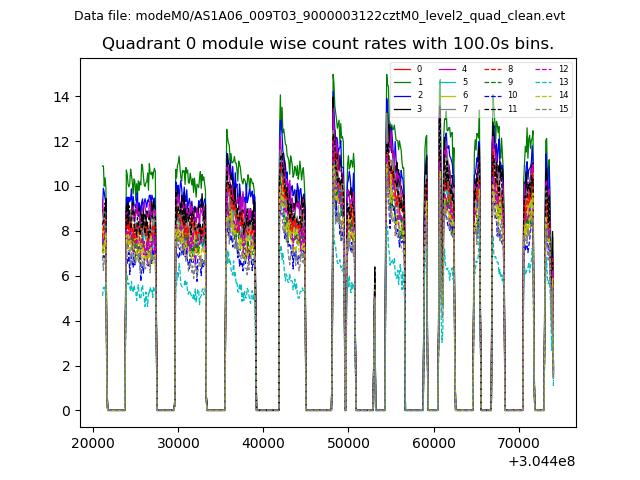 |
 |
| Module-wise count rates for Quadrant B Data is divided into 100 sec bins |
 |
 |
| Module-wise count rates for Quadrant C Data is divided into 100 sec bins |
 |
 |
| Module-wise count rates for Quadrant D Data is divided into 100 sec bins |
 |
 |
| Parameter | Plot |
|---|---|
| CZT HV Monitor |  |
| D_VDD | 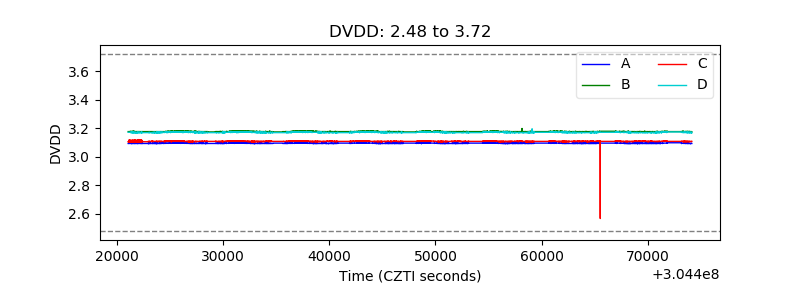 |
| Temperature 1 |  |
| Veto HV Monitor |  |
| Veto LLD |  |
| Alpha Counter |  |
| _CPM_Rate | 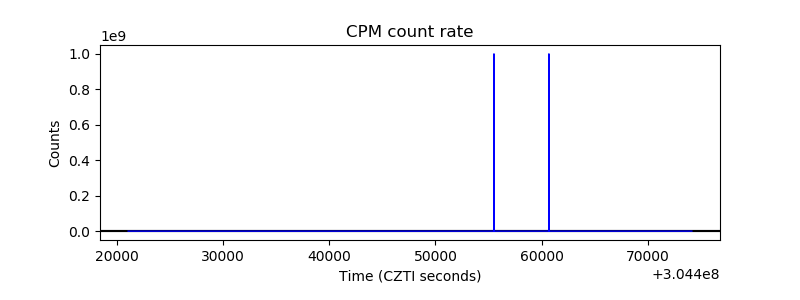 |
| CZT Counter | 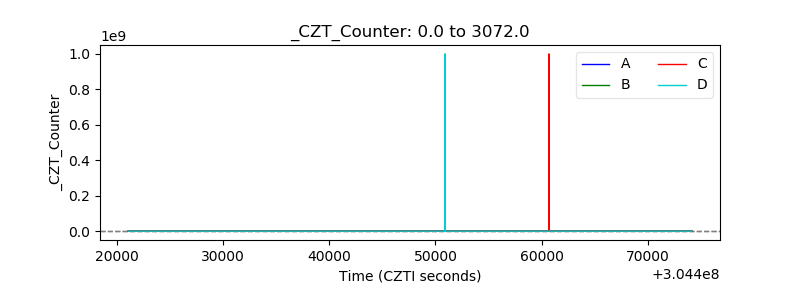 |
| +2.5 Volts monitor |  |
| +5 Volts monitor | 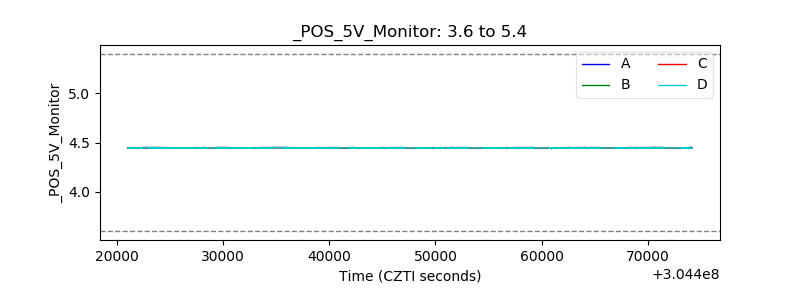 |
| _ROLL_ROT |  |
| _Roll_DEC |  |
| _Roll_RA |  |
| Veto Counter |  |