| Param | Original file | Final file |
|---|---|---|
| Filename | modeM0/AS1A06_009T03_9000003122_21132cztM0_level2.evt | modeM0/AS1A06_009T03_9000003122_21132cztM0_level2_quad_clean.evt |
| Size (bytes) | 779,126,400 | 120,890,880 |
| Size | 743.0 MB | 115.3 MB |
| Events in quadrant A | 6,215,771 | 767,343 |
| Events in quadrant B | 4,909,996 | 821,157 |
| Events in quadrant C | 4,449,757 | 777,256 |
| Events in quadrant D | 7,438,837 | 697,811 |
| Mode M0 | |||
|---|---|---|---|
| Quadrant | BADHDUFLAG | Total packets | Discarded packets |
| A | 0 | 27783 | 3725 |
| B | 0 | 23033 | 3141 |
| C | 0 | 21465 | 2916 |
| D | 0 | 33857 | 5944 |
| Mode M9 | |||
|---|---|---|---|
| Quadrant | BADHDUFLAG | Total packets | Discarded packets |
| A | 0 | 21 | 2 |
| B | 0 | 24 | 5 |
| C | 0 | 23 | 4 |
| D | 0 | 24 | 5 |
| Mode SS | |||
|---|---|---|---|
| Quadrant | BADHDUFLAG | Total packets | Discarded packets |
| A | 0 | 206 | 26 |
| B | 0 | 207 | 31 |
| C | 0 | 210 | 32 |
| D | 0 | 205 | 21 |
| Quadrant | Total seconds | Saturated seconds | Saturation percentage |
|---|---|---|---|
| A | 8607 | 462 | 5.367724% |
| B | 8620 | 82 | 0.951276% |
| C | 8675 | 134 | 1.544669% |
| D | 8427 | 583 | 6.918239% |
Noise dominated data is calculated using 1-second bins in cleaned event files. If a bin has >2000 counts, and if more than 50% of those come from <1% of pixels, then it is considered to be noise-dominated and hence unusable.
| Quadrant | # 1 sec bins | Bins with >0 counts | Bins with >2000 counts | High rate bins dominated by noise | Noise dominated (total time) | Noise dominated (detector-on time) | Marked lightcurve |
|---|---|---|---|---|---|---|---|
| A | 12736 | 9114 | 290 | 290 | 2.28% | 3.18% | 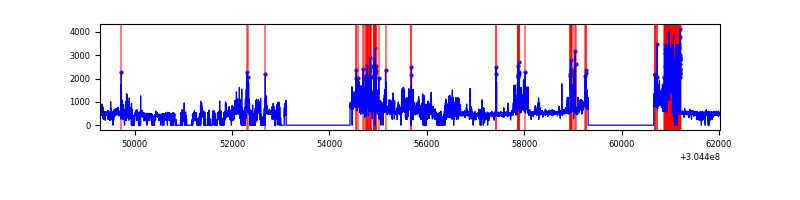 |
| B | 12736 | 9118 | 11 | 11 | 0.09% | 0.12% | 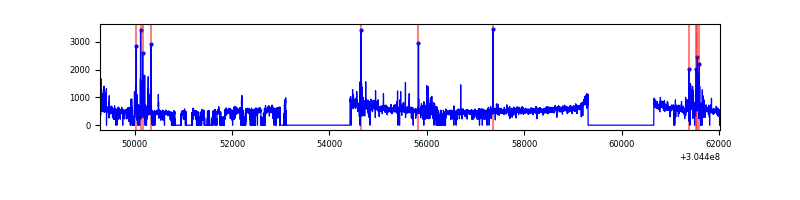 |
| C | 12736 | 9162 | 22 | 22 | 0.17% | 0.24% | 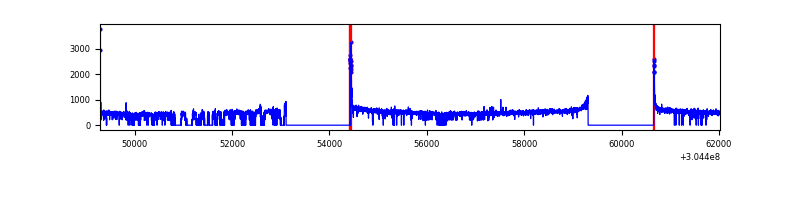 |
| D | 12735 | 8972 | 459 | 459 | 3.60% | 5.12% | 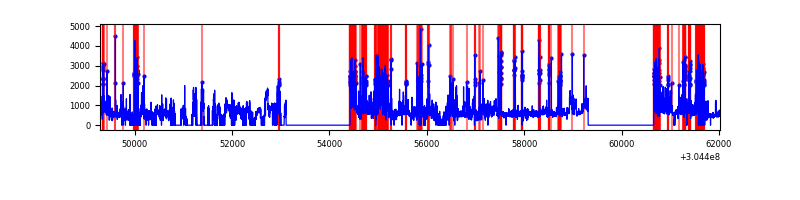 |
Top three noisy pixels from each quadrant. If the there are fewer than three noisy pixels in the level2.evt file, extra rows are filled as -1
| Pixel properties | Quadrant properties | ||||||
|---|---|---|---|---|---|---|---|
| Quadrant | DetID | PixID | Counts | Sigma | Mean | Median | Sigma |
| A | 15 | 192 | 1979631 | 8982.12 | 1099 | 1081 | 220.3 |
| A | 13 | 254 | 11892 | 49.08 | 1099 | 1081 | 220.3 |
| A | 0 | 226 | 9796 | 39.56 | 1099 | 1081 | 220.3 |
| B | 0 | 182 | 140637 | 660.95 | 1130 | 1105 | 211.1 |
| B | 0 | 219 | 109434 | 513.15 | 1130 | 1105 | 211.1 |
| B | 7 | 220 | 105557 | 494.78 | 1130 | 1105 | 211.1 |
| C | 14 | 238 | 171378 | 680.61 | 1074 | 1085 | 250.2 |
| C | 0 | 10 | 78562 | 309.65 | 1074 | 1085 | 250.2 |
| C | 0 | 207 | 7934 | 27.37 | 1074 | 1085 | 250.2 |
| D | 1 | 52 | 956942 | 3837.75 | 1022 | 996 | 249.1 |
| D | 5 | 222 | 737510 | 2956.82 | 1022 | 996 | 249.1 |
| D | 1 | 239 | 640850 | 2568.76 | 1022 | 996 | 249.1 |
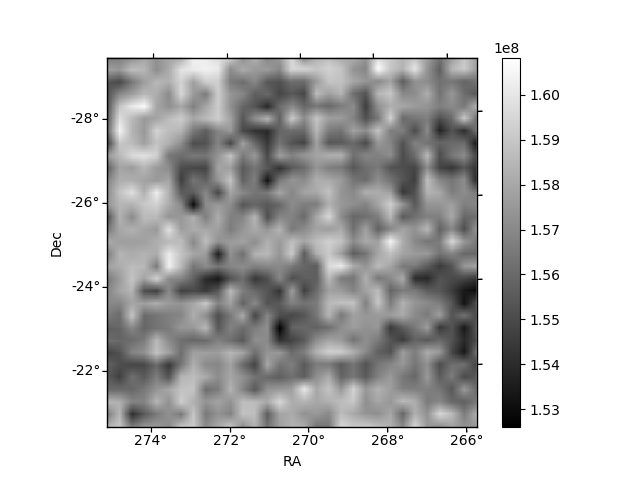
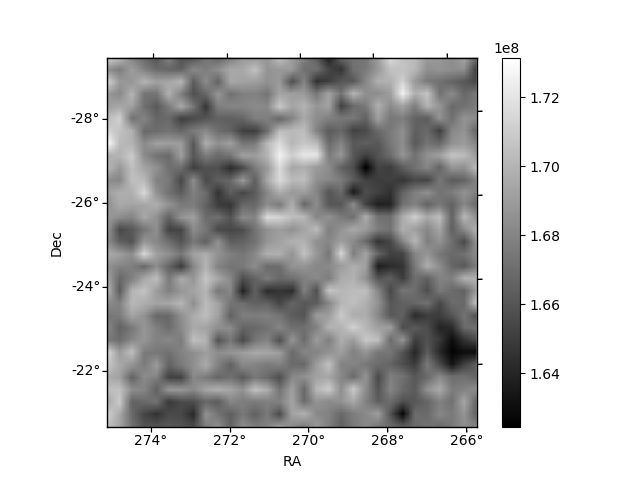
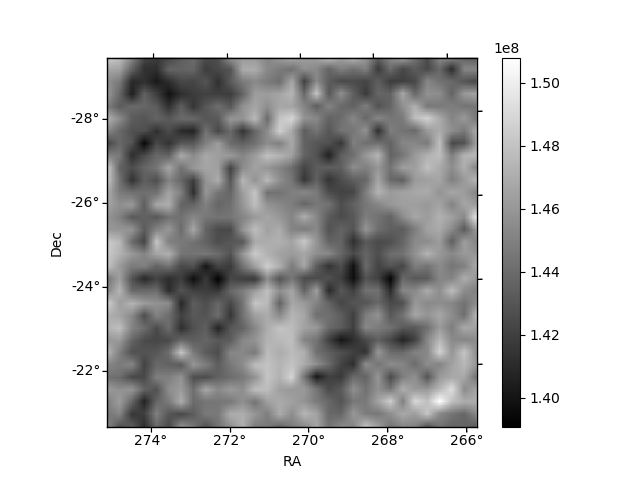
Histogram calculated using DETX and DETY for each event in the final _common_clean file
| Quadrant A | 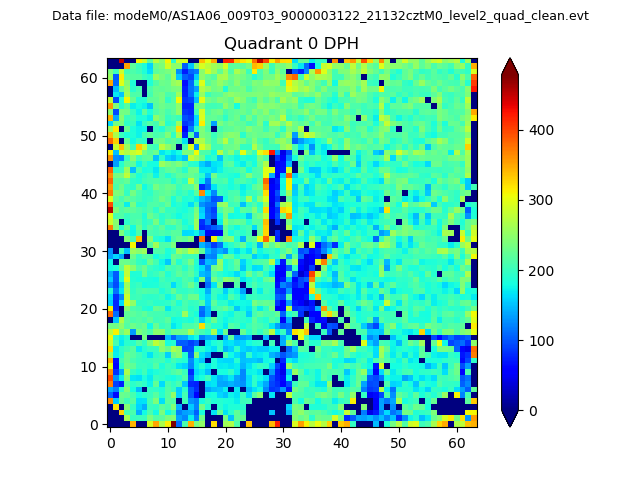 |
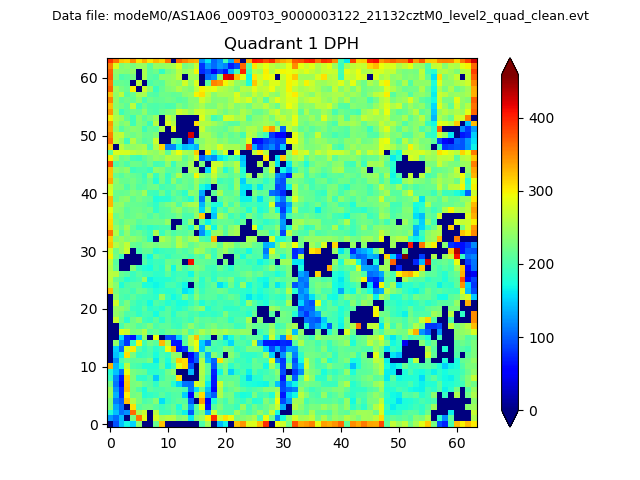 |
Quadrant B |
|---|---|---|---|
| Quadrant D | 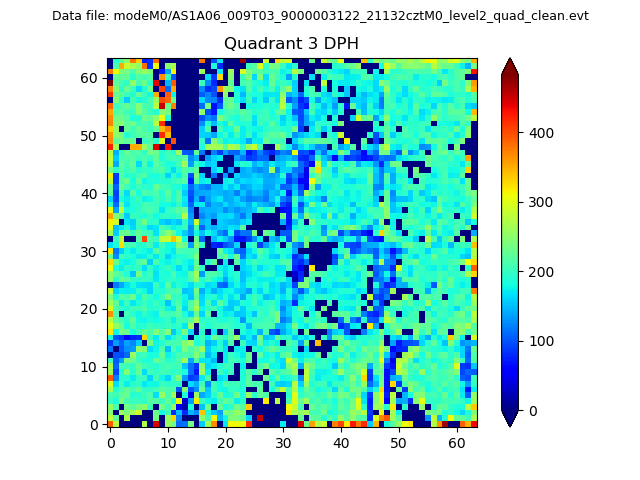 |
 |
Quadrant C |
| Plot type | Count rate plots | Images |
|---|---|---|
| Comparison with Poisson distribution Blue bars denote a histogram of data divided into 1 sec bins. Red curve is a Poisson curve with rate = median count rate of data. |
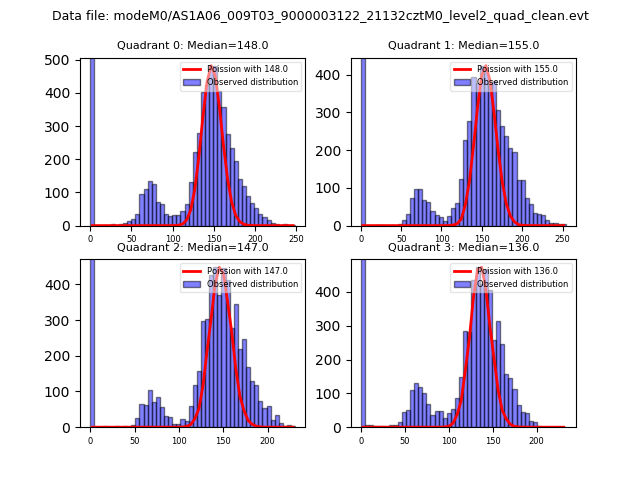 |
 |
| Quadrant-wise count rates Data is divided into 100 sec bins |
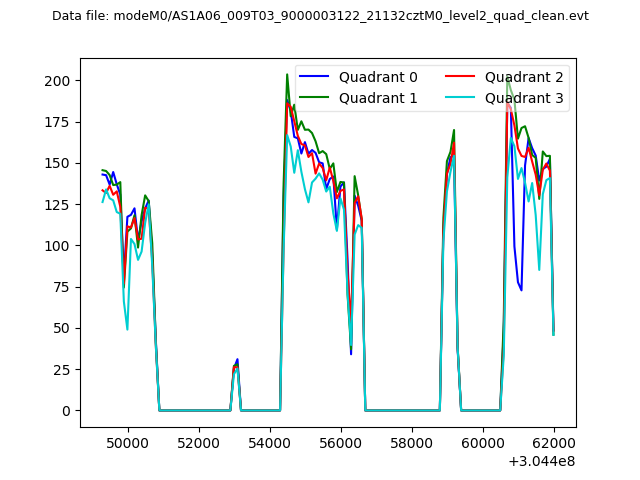 |
|
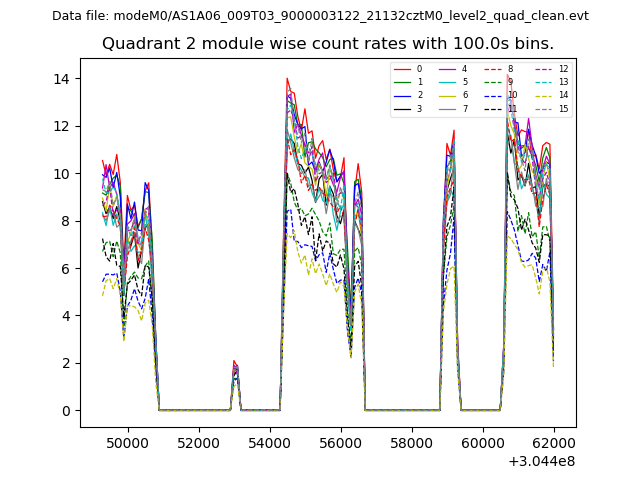
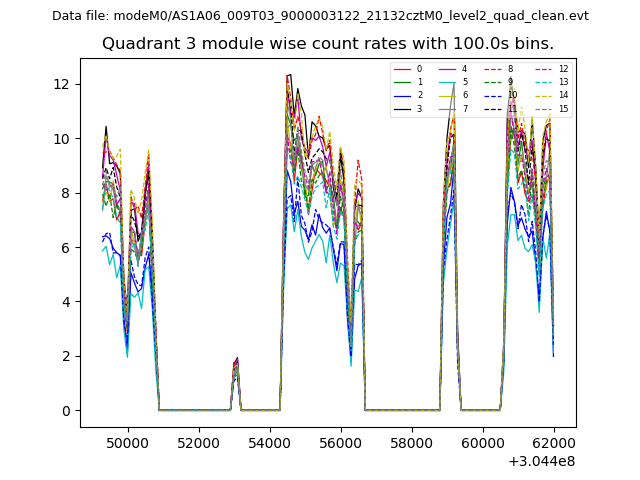
| Module-wise count rates for Quadrant A Data is divided into 100 sec bins |
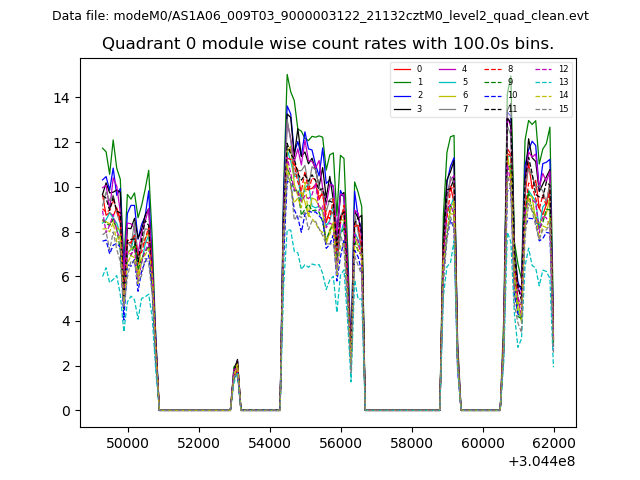 |
 |
| Module-wise count rates for Quadrant B Data is divided into 100 sec bins |
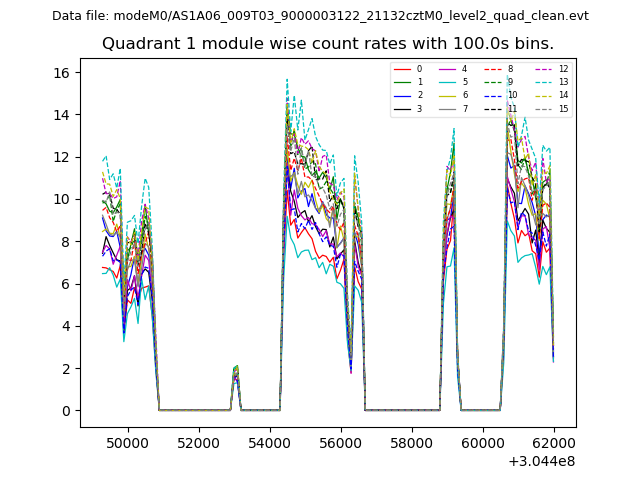 |
 |
| Module-wise count rates for Quadrant C Data is divided into 100 sec bins |
 |
 |
| Module-wise count rates for Quadrant D Data is divided into 100 sec bins |
 |
 |
| Parameter | Plot |
|---|---|
| CZT HV Monitor | 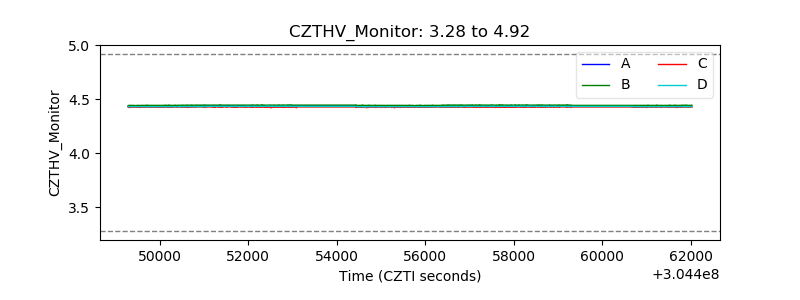 |
| D_VDD |  |
| Temperature 1 | 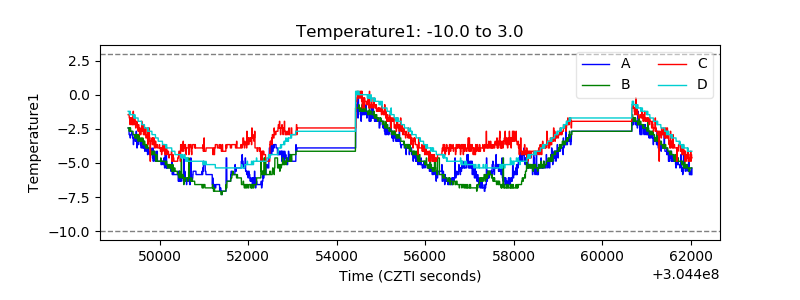 |
| Veto HV Monitor | 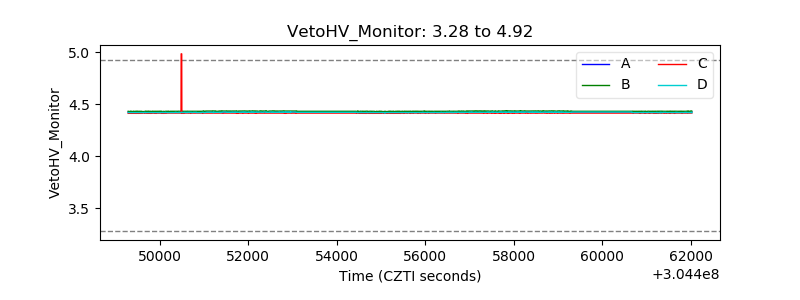 |
| Veto LLD | 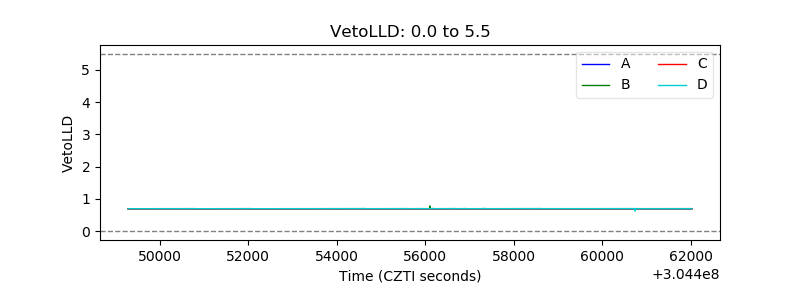 |
| Alpha Counter | 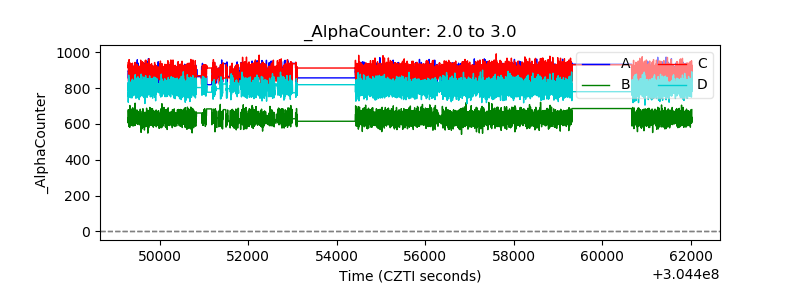 |
| _CPM_Rate | 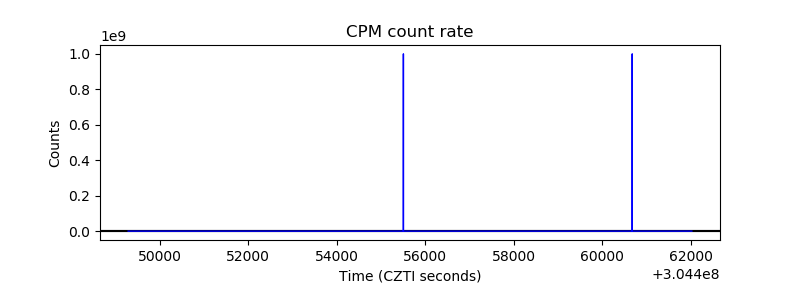 |
| CZT Counter | 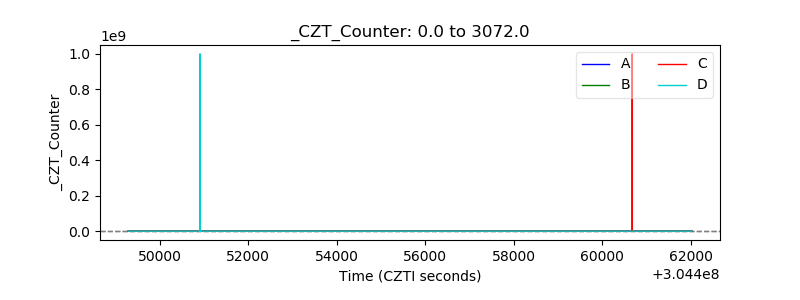 |
| +2.5 Volts monitor |  |
| +5 Volts monitor |  |
| _ROLL_ROT | 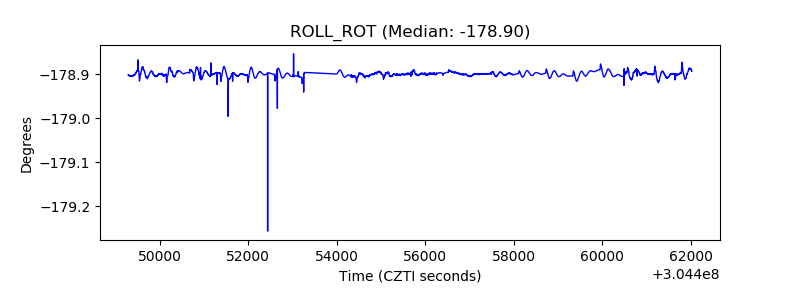 |
| _Roll_DEC | 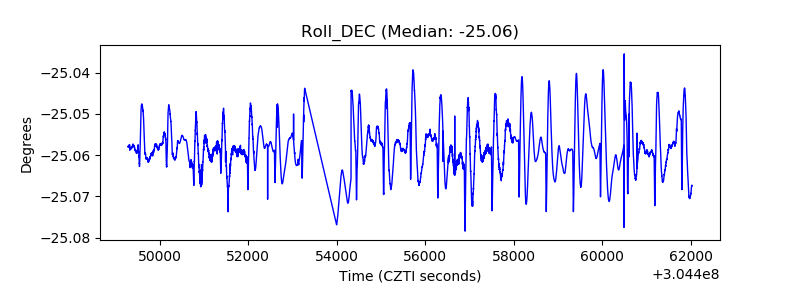 |
| _Roll_RA | 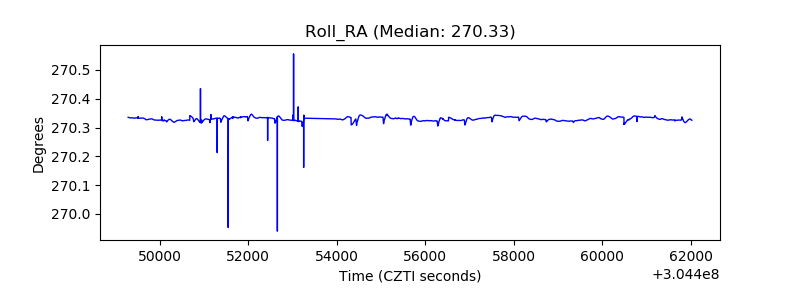 |
| Veto Counter | 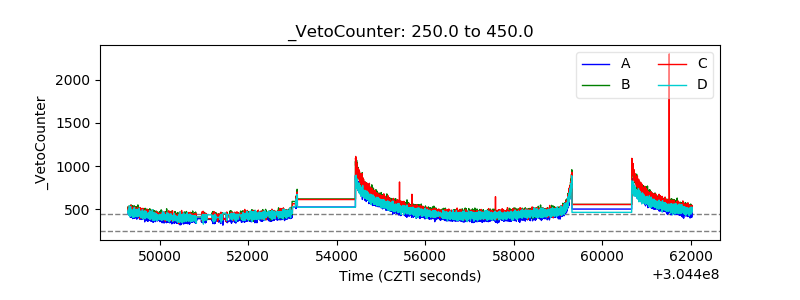 |