| Param | Original file | Final file |
|---|---|---|
| Filename | modeM0/AS1A06_009T03_9000003122_21135cztM0_level2.evt | modeM0/AS1A06_009T03_9000003122_21135cztM0_level2_quad_clean.evt |
| Size (bytes) | 1,597,524,480 | 222,468,480 |
| Size | 1.5 GB | 212.2 MB |
| Events in quadrant A | 12,001,794 | 1,363,169 |
| Events in quadrant B | 10,745,093 | 1,434,050 |
| Events in quadrant C | 9,874,993 | 1,357,758 |
| Events in quadrant D | 14,456,328 | 1,251,421 |
| Mode M0 | |||
|---|---|---|---|
| Quadrant | BADHDUFLAG | Total packets | Discarded packets |
| A | 0 | 51793 | 3697 |
| B | 0 | 47592 | 3924 |
| C | 0 | 44902 | 3636 |
| D | 0 | 59963 | 3852 |
| Mode M9 | |||
|---|---|---|---|
| Quadrant | BADHDUFLAG | Total packets | Discarded packets |
| A | 0 | 54 | 2 |
| B | 0 | 53 | 0 |
| C | 0 | 55 | 3 |
| D | 0 | 54 | 1 |
| Mode SS | |||
|---|---|---|---|
| Quadrant | BADHDUFLAG | Total packets | Discarded packets |
| A | 0 | 433 | 37 |
| B | 0 | 433 | 47 |
| C | 0 | 433 | 40 |
| D | 0 | 434 | 42 |
| Quadrant | Total seconds | Saturated seconds | Saturation percentage |
|---|---|---|---|
| A | 19333 | 628 | 3.248332% |
| B | 19311 | 294 | 1.522448% |
| C | 19362 | 310 | 1.601074% |
| D | 19313 | 820 | 4.245845% |
Noise dominated data is calculated using 1-second bins in cleaned event files. If a bin has >2000 counts, and if more than 50% of those come from <1% of pixels, then it is considered to be noise-dominated and hence unusable.
| Quadrant | # 1 sec bins | Bins with >0 counts | Bins with >2000 counts | High rate bins dominated by noise | Noise dominated (total time) | Noise dominated (detector-on time) | Marked lightcurve |
|---|---|---|---|---|---|---|---|
| A | 26492 | 19694 | 317 | 317 | 1.20% | 1.61% | 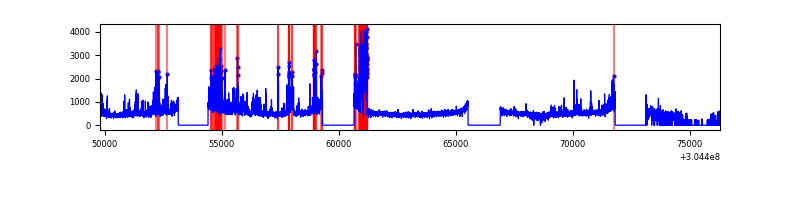 |
| B | 26493 | 19716 | 52 | 52 | 0.20% | 0.26% | 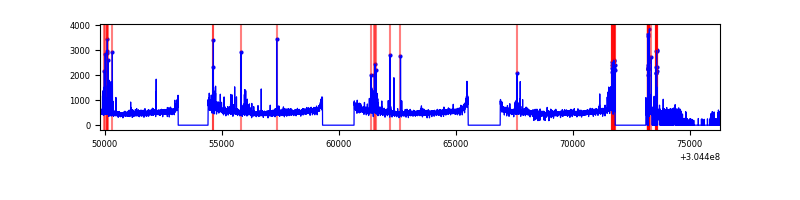 |
| C | 26493 | 19748 | 36 | 36 | 0.14% | 0.18% |  |
| D | 26491 | 19716 | 631 | 631 | 2.38% | 3.20% | 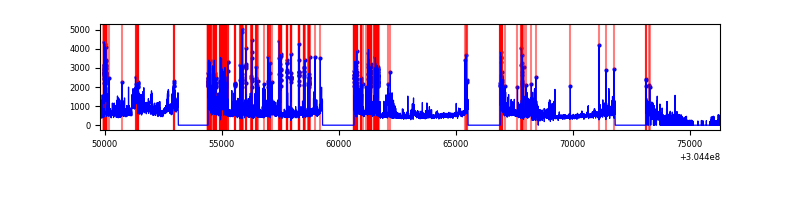 |
Top three noisy pixels from each quadrant. If the there are fewer than three noisy pixels in the level2.evt file, extra rows are filled as -1
| Pixel properties | Quadrant properties | ||||||
|---|---|---|---|---|---|---|---|
| Quadrant | DetID | PixID | Counts | Sigma | Mean | Median | Sigma |
| A | 15 | 192 | 2485674 | 5037.98 | 2470 | 2428 | 492.9 |
| A | 13 | 254 | 25708 | 47.23 | 2470 | 2428 | 492.9 |
| A | 0 | 226 | 21622 | 38.94 | 2470 | 2428 | 492.9 |
| B | 7 | 220 | 335008 | 713.25 | 2510 | 2457 | 466.3 |
| B | 0 | 219 | 215851 | 457.68 | 2510 | 2457 | 466.3 |
| B | 0 | 182 | 126771 | 266.62 | 2510 | 2457 | 466.3 |
| C | 14 | 238 | 380475 | 680.39 | 2392 | 2412 | 555.7 |
| C | 0 | 10 | 143311 | 253.57 | 2392 | 2412 | 555.7 |
| C | 3 | 233 | 25153 | 40.93 | 2392 | 2412 | 555.7 |
| D | 1 | 52 | 1448719 | 2557.79 | 2346 | 2285 | 565.5 |
| D | 1 | 239 | 1028299 | 1814.34 | 2346 | 2285 | 565.5 |
| D | 7 | 223 | 929937 | 1640.41 | 2346 | 2285 | 565.5 |
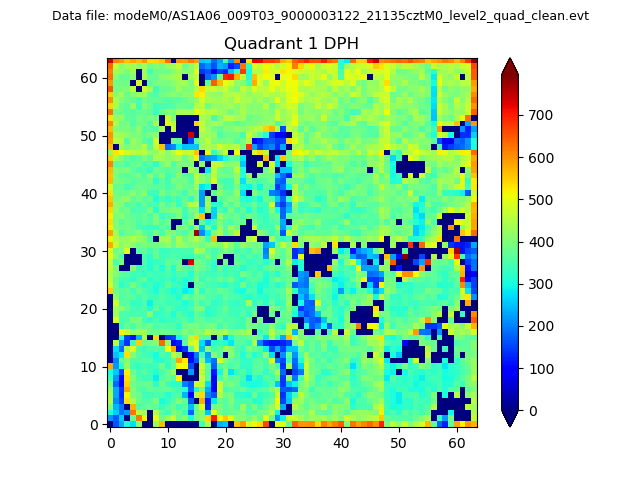
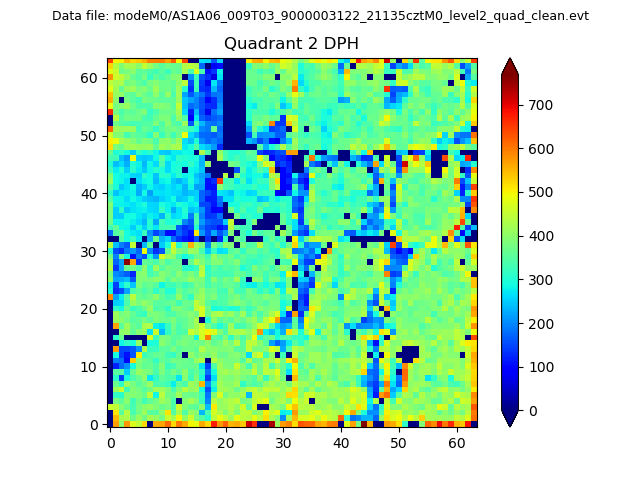
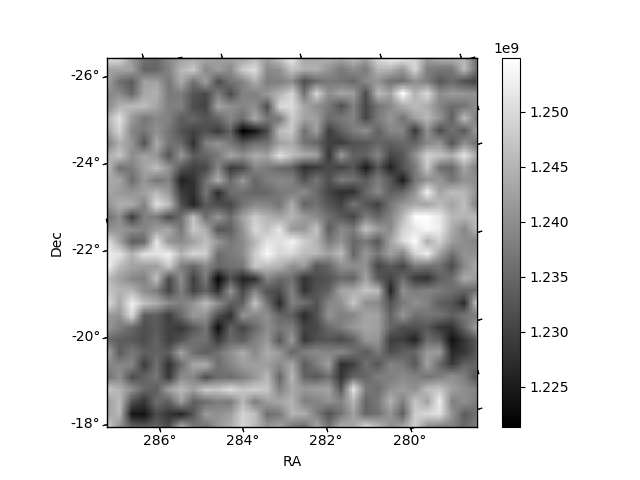
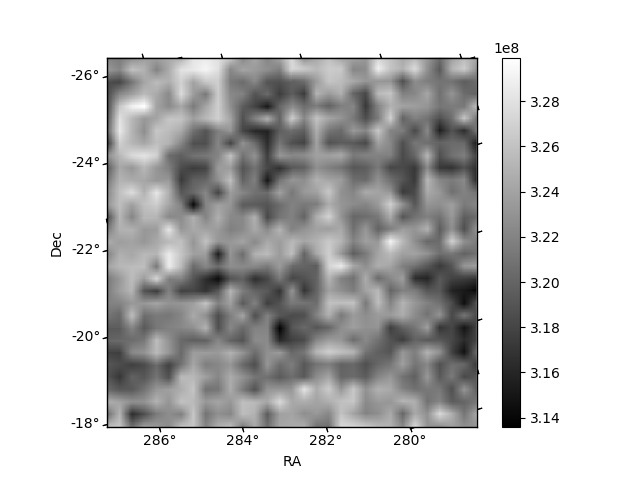
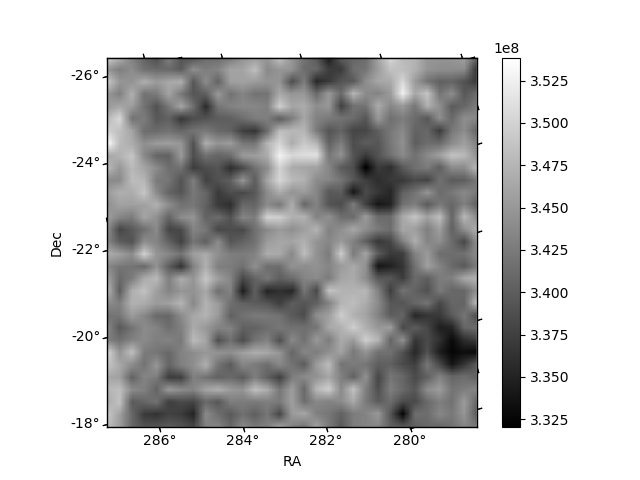
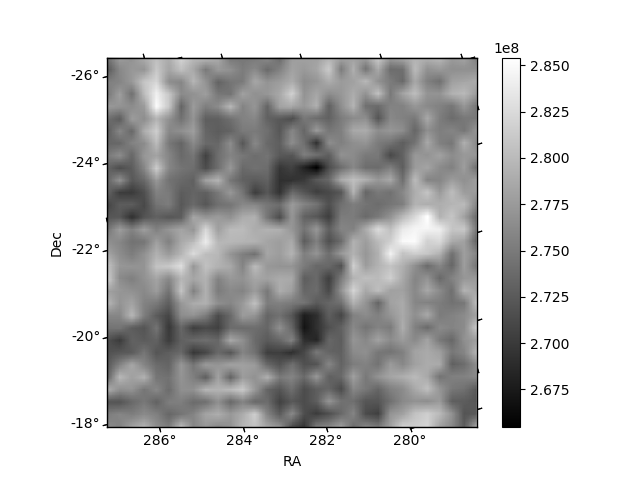
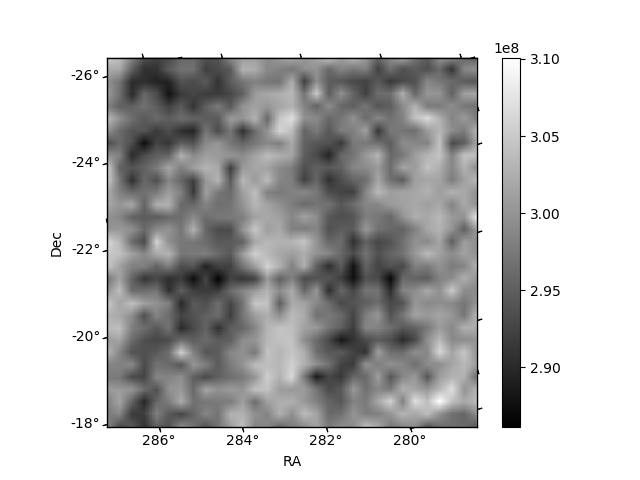
Histogram calculated using DETX and DETY for each event in the final _common_clean file
| Quadrant A | 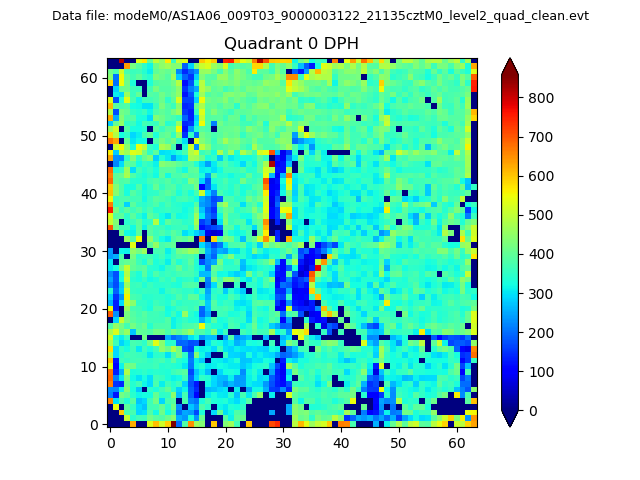 |
 |
Quadrant B |
|---|---|---|---|
| Quadrant D | 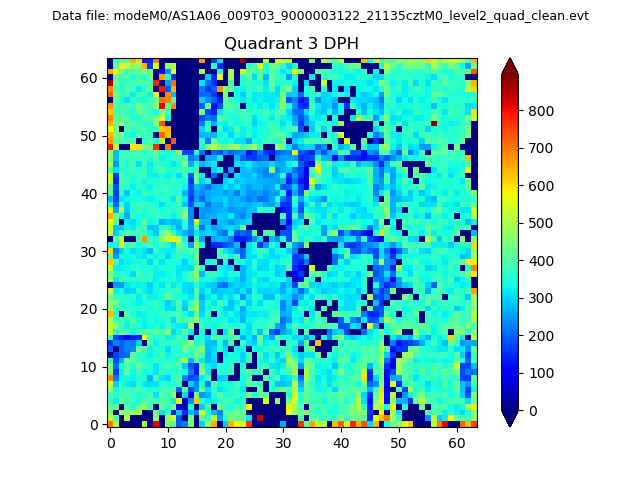 |
 |
Quadrant C |
| Plot type | Count rate plots | Images |
|---|---|---|
| Comparison with Poisson distribution Blue bars denote a histogram of data divided into 1 sec bins. Red curve is a Poisson curve with rate = median count rate of data. |
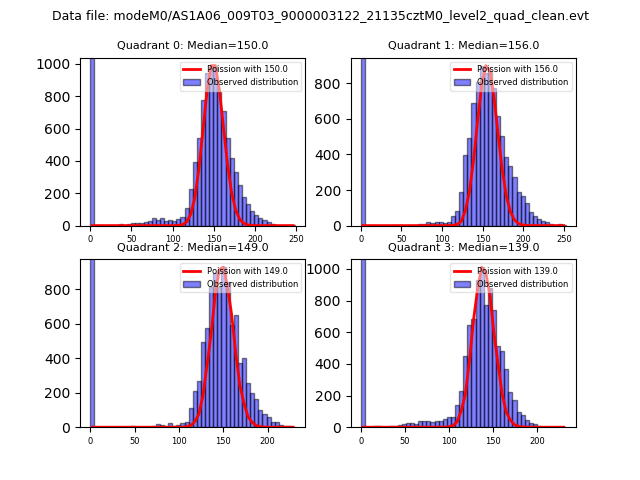 |
 |
| Quadrant-wise count rates Data is divided into 100 sec bins |
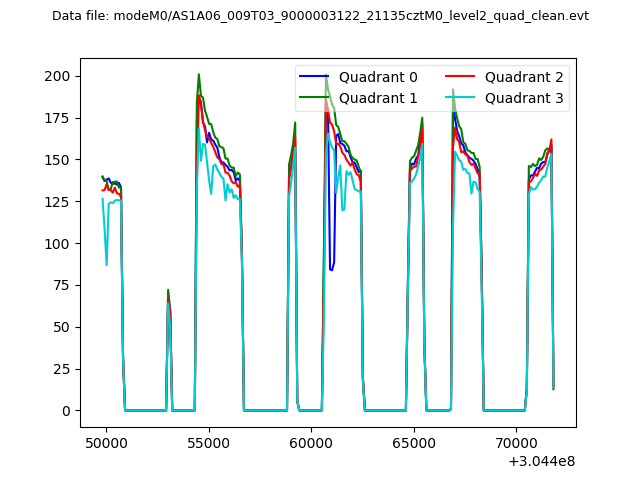 |
|
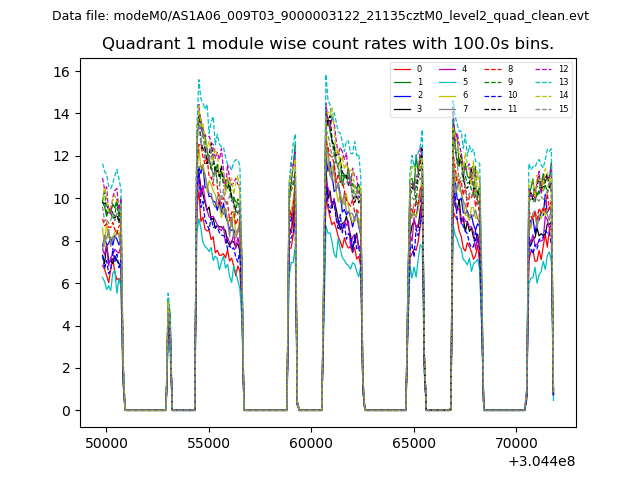
| Module-wise count rates for Quadrant A Data is divided into 100 sec bins |
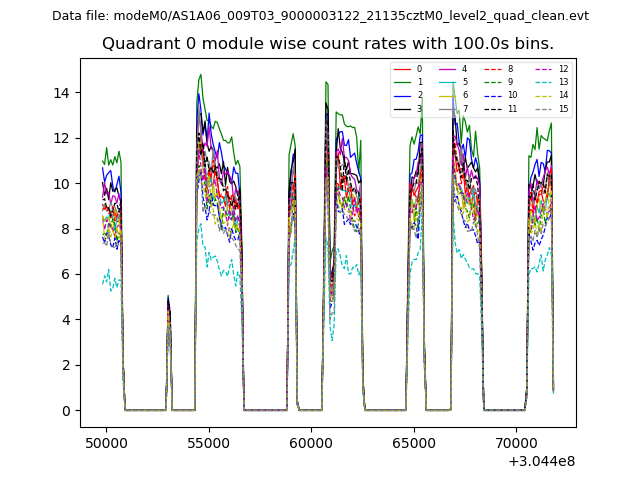 |
 |
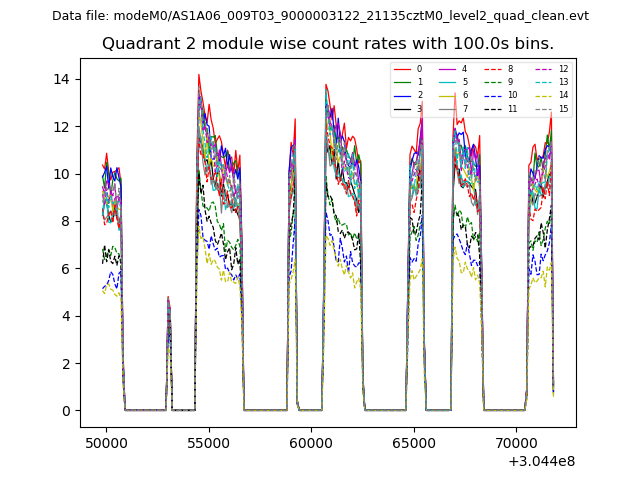
| Module-wise count rates for Quadrant B Data is divided into 100 sec bins |
 |
 |
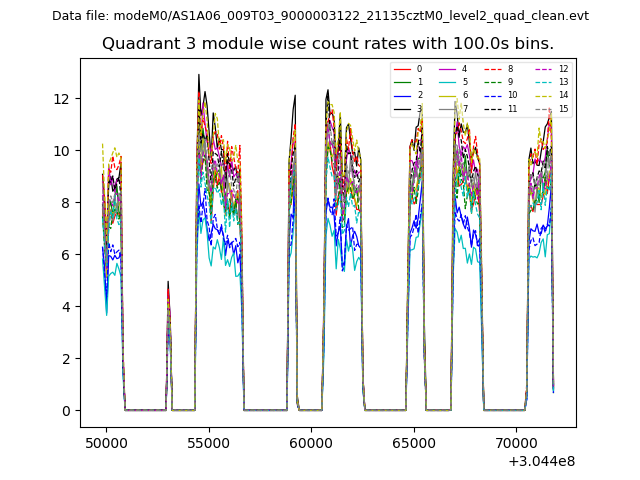
| Module-wise count rates for Quadrant C Data is divided into 100 sec bins |
 |
 |
| Module-wise count rates for Quadrant D Data is divided into 100 sec bins |
 |
 |
| Parameter | Plot |
|---|---|
| CZT HV Monitor | 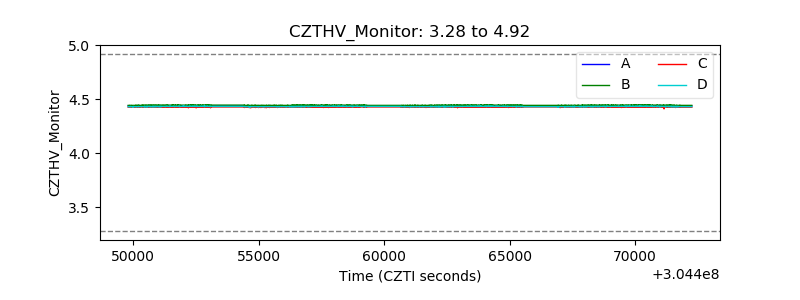 |
| D_VDD | 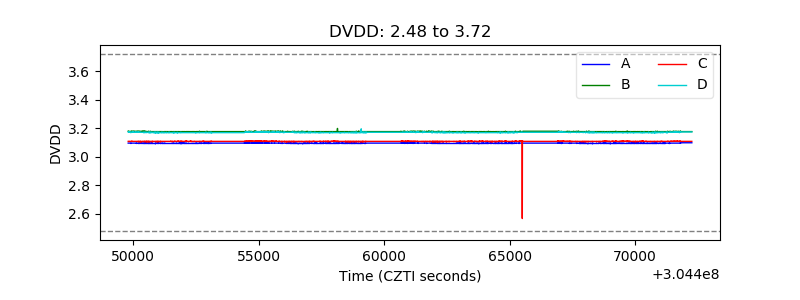 |
| Temperature 1 | 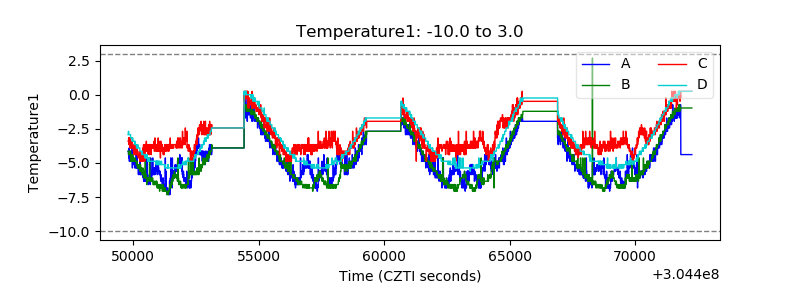 |
| Veto HV Monitor |  |
| Veto LLD | 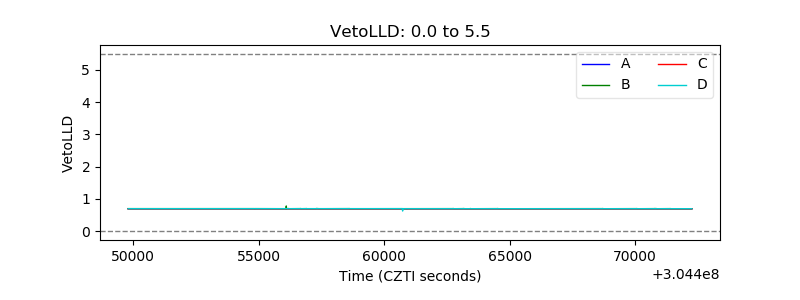 |
| Alpha Counter | 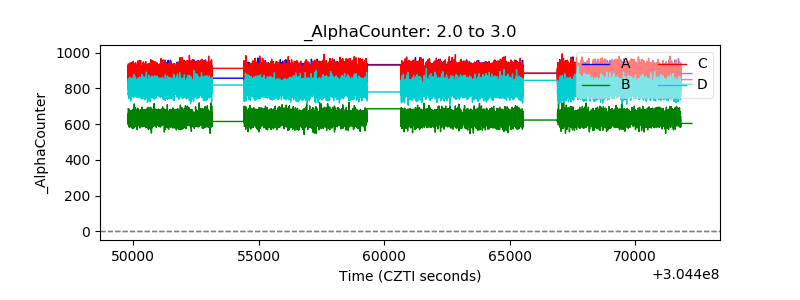 |
| _CPM_Rate | 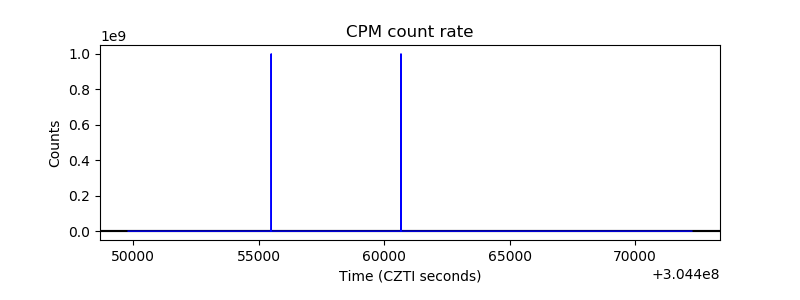 |
| CZT Counter | 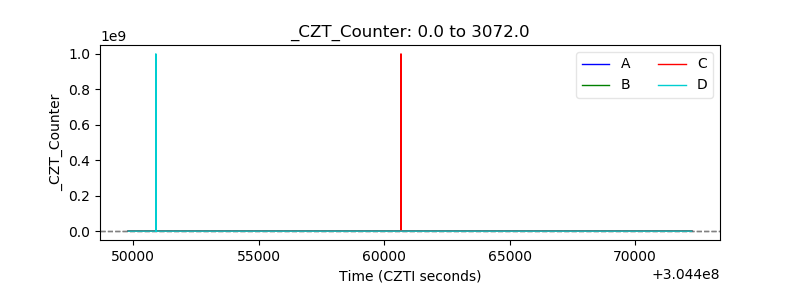 |
| +2.5 Volts monitor |  |
| +5 Volts monitor | 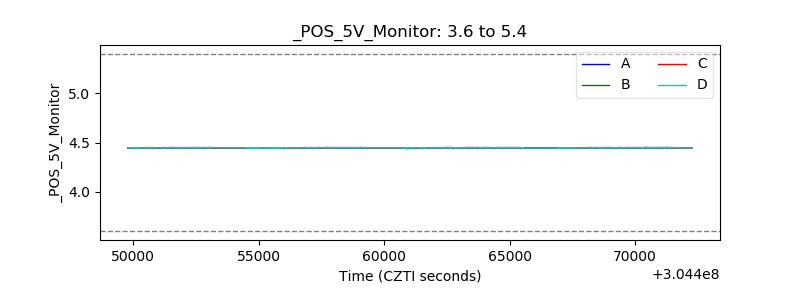 |
| _ROLL_ROT | 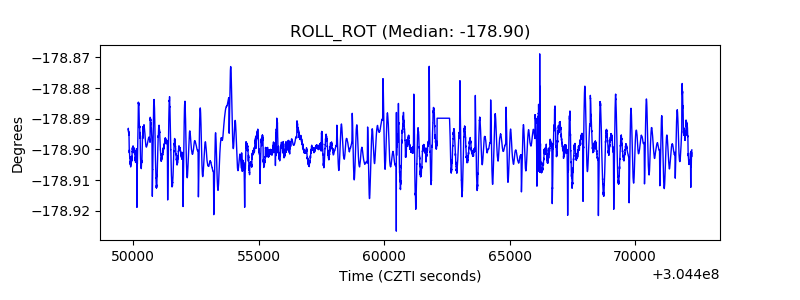 |
| _Roll_DEC | 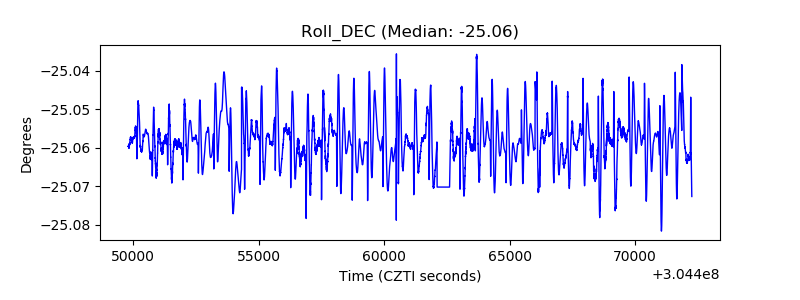 |
| _Roll_RA | 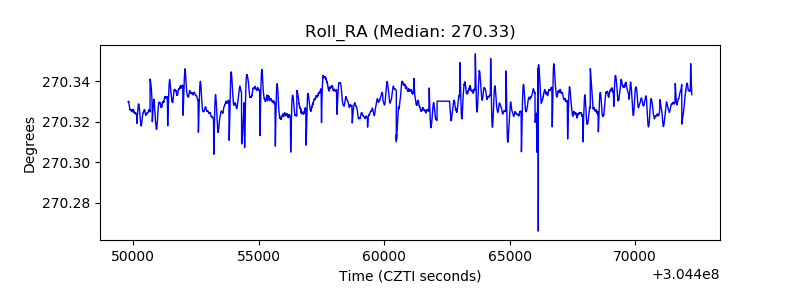 |
| Veto Counter | 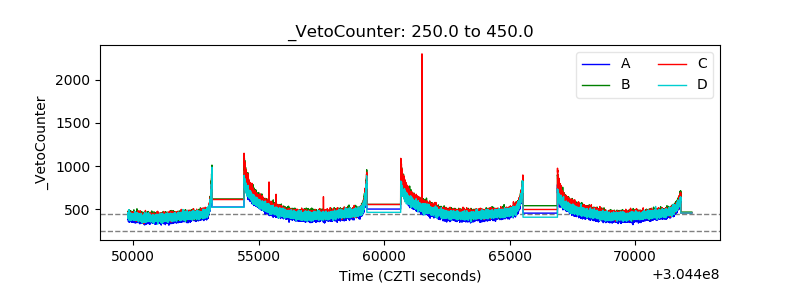 |