| Param | Original file | Final file |
|---|---|---|
| Filename | modeM0/AS1T03_136T01_9000003124_21135cztM0_level2.evt | modeM0/AS1T03_136T01_9000003124_21135cztM0_level2_quad_clean.evt |
| Size (bytes) | 258,036,480 | 47,376,000 |
| Size | 246.1 MB | 45.2 MB |
| Events in quadrant A | 1,465,123 | 313,977 |
| Events in quadrant B | 1,803,991 | 317,259 |
| Events in quadrant C | 1,472,461 | 308,259 |
| Events in quadrant D | 2,869,443 | 282,449 |
| Mode M0 | |||
|---|---|---|---|
| Quadrant | BADHDUFLAG | Total packets | Discarded packets |
| A | 0 | 6248 | 113 |
| B | 0 | 7416 | 115 |
| C | 0 | 6260 | 122 |
| D | 0 | 10796 | 250 |
| Mode SS | |||
|---|---|---|---|
| Quadrant | BADHDUFLAG | Total packets | Discarded packets |
| A | 0 | 64 | 0 |
| B | 0 | 64 | 4 |
| C | 0 | 64 | 2 |
| D | 0 | 64 | 2 |
| Mode M9 | |||
|---|---|---|---|
| Quadrant | BADHDUFLAG | Total packets | Discarded packets |
| A | 0 | 10 | 0 |
| B | 0 | 10 | 0 |
| C | 0 | 10 | 0 |
| D | 0 | 10 | 0 |
| Quadrant | Total seconds | Saturated seconds | Saturation percentage |
|---|---|---|---|
| A | 2984 | 4 | 0.134048% |
| B | 2985 | 52 | 1.742044% |
| C | 2978 | 23 | 0.772330% |
| D | 2959 | 188 | 6.353498% |
Noise dominated data is calculated using 1-second bins in cleaned event files. If a bin has >2000 counts, and if more than 50% of those come from <1% of pixels, then it is considered to be noise-dominated and hence unusable.
| Quadrant | # 1 sec bins | Bins with >0 counts | Bins with >2000 counts | High rate bins dominated by noise | Noise dominated (total time) | Noise dominated (detector-on time) | Marked lightcurve |
|---|---|---|---|---|---|---|---|
| A | 4074 | 3030 | 0 | 0 | 0.00% | 0.00% | 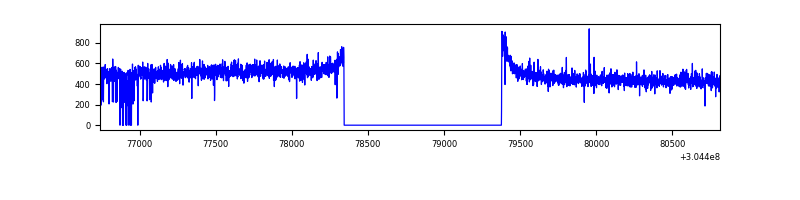 |
| B | 4074 | 3032 | 15 | 15 | 0.37% | 0.49% | 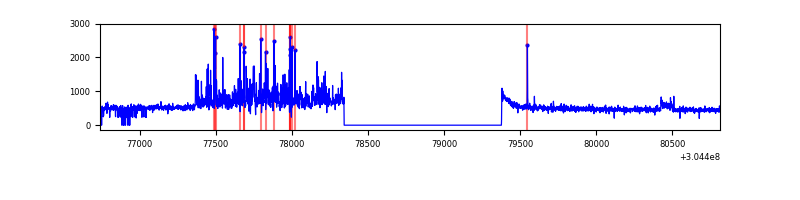 |
| C | 4073 | 3018 | 0 | 0 | 0.00% | 0.00% | 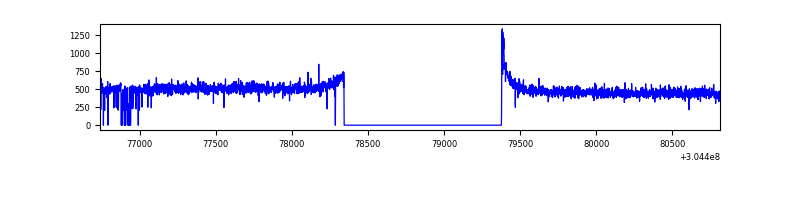 |
| D | 4073 | 3017 | 119 | 119 | 2.92% | 3.94% | 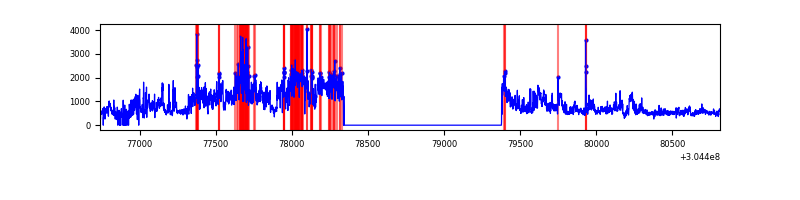 |
Top three noisy pixels from each quadrant. If the there are fewer than three noisy pixels in the level2.evt file, extra rows are filled as -1
| Pixel properties | Quadrant properties | ||||||
|---|---|---|---|---|---|---|---|
| Quadrant | DetID | PixID | Counts | Sigma | Mean | Median | Sigma |
| A | 0 | 226 | 3311 | 37.32 | 380 | 371 | 78.8 |
| A | 3 | 137 | 3115 | 34.84 | 380 | 371 | 78.8 |
| A | 13 | 254 | 2752 | 30.23 | 380 | 371 | 78.8 |
| B | 7 | 220 | 209109 | 2803.83 | 379 | 370 | 74.4 |
| B | 0 | 219 | 23739 | 313.9 | 379 | 370 | 74.4 |
| B | 0 | 190 | 20405 | 269.11 | 379 | 370 | 74.4 |
| C | 14 | 238 | 56917 | 660.47 | 361 | 364 | 85.6 |
| C | 0 | 10 | 5590 | 61.03 | 361 | 364 | 85.6 |
| C | 13 | 61 | 2553 | 25.56 | 361 | 364 | 85.6 |
| D | 1 | 52 | 1059487 | 11881.16 | 357 | 345 | 89.1 |
| D | 1 | 239 | 218954 | 2452.29 | 357 | 345 | 89.1 |
| D | 1 | 20 | 97812 | 1093.35 | 357 | 345 | 89.1 |
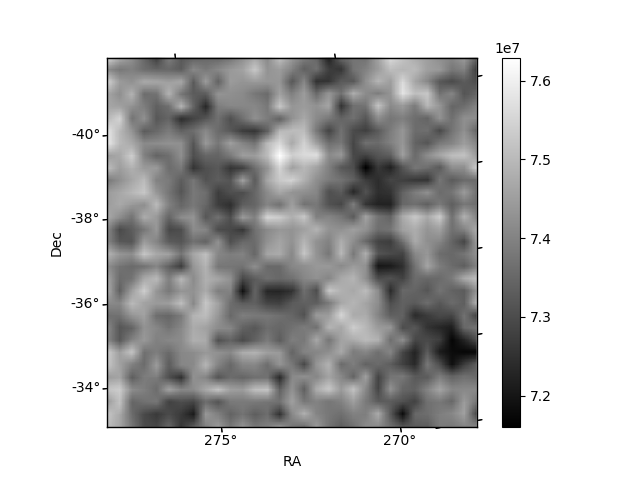
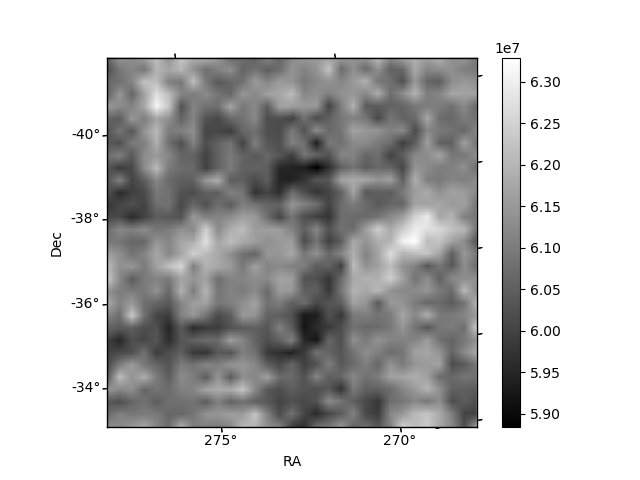
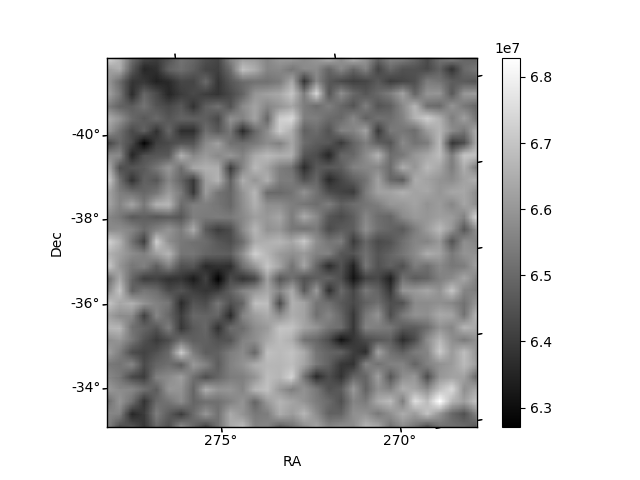
Histogram calculated using DETX and DETY for each event in the final _common_clean file
| Quadrant A | 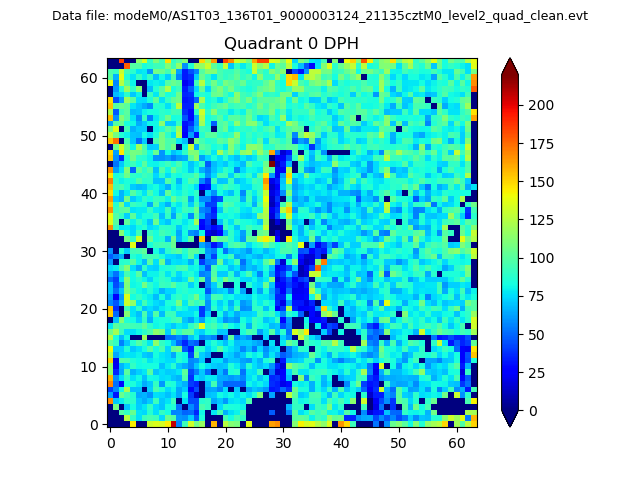 |
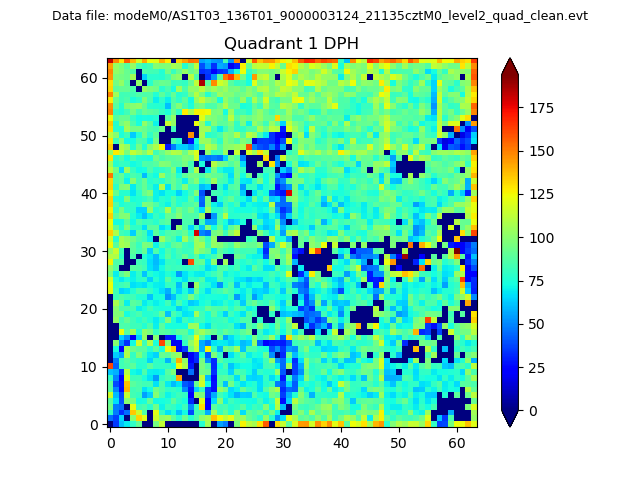 |
Quadrant B |
|---|---|---|---|
| Quadrant D | 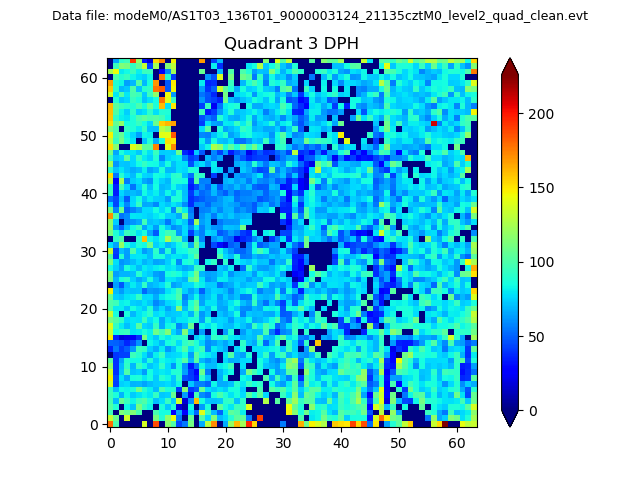 |
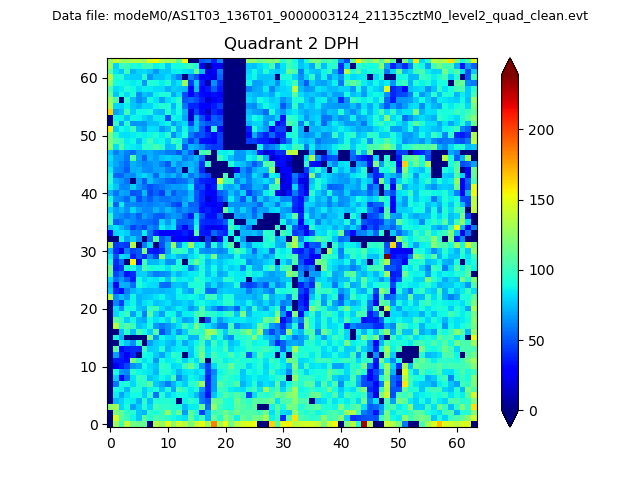 |
Quadrant C |
| Plot type | Count rate plots | Images |
|---|---|---|
| Comparison with Poisson distribution Blue bars denote a histogram of data divided into 1 sec bins. Red curve is a Poisson curve with rate = median count rate of data. |
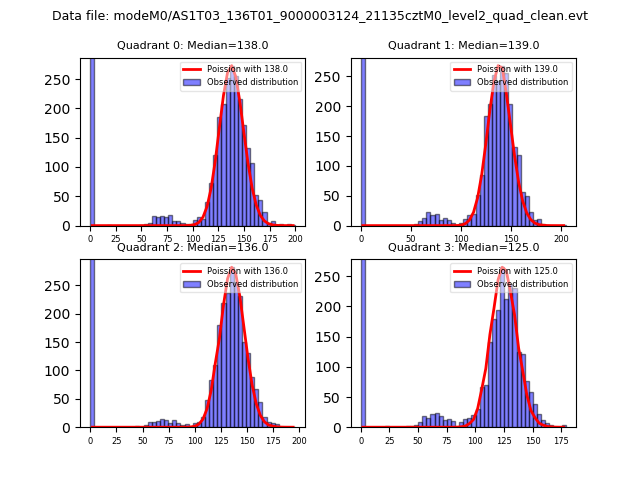 |
 |
| Quadrant-wise count rates Data is divided into 100 sec bins |
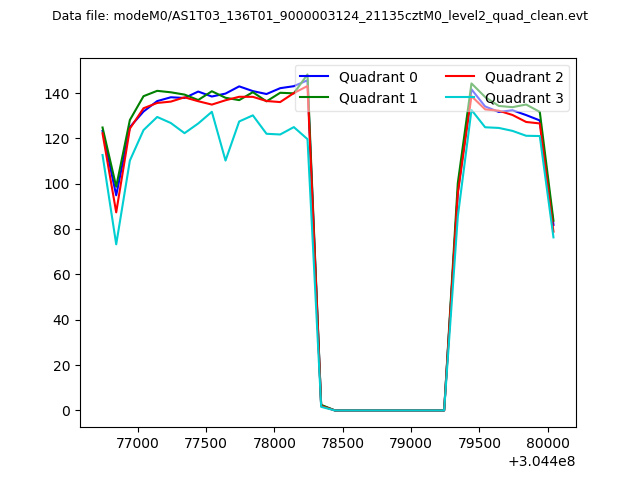 |
|
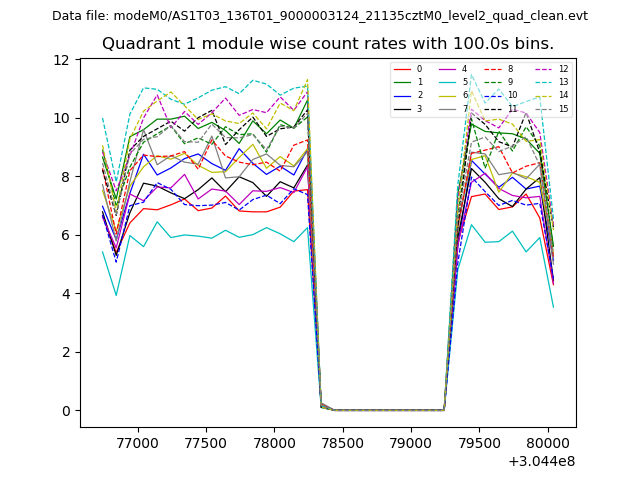
| Module-wise count rates for Quadrant A Data is divided into 100 sec bins |
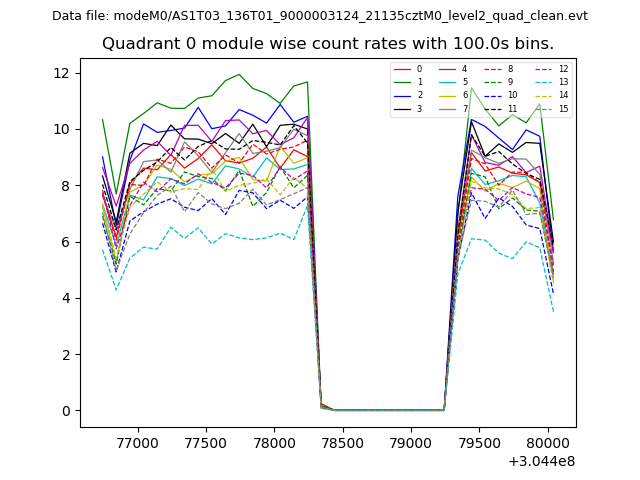 |
 |
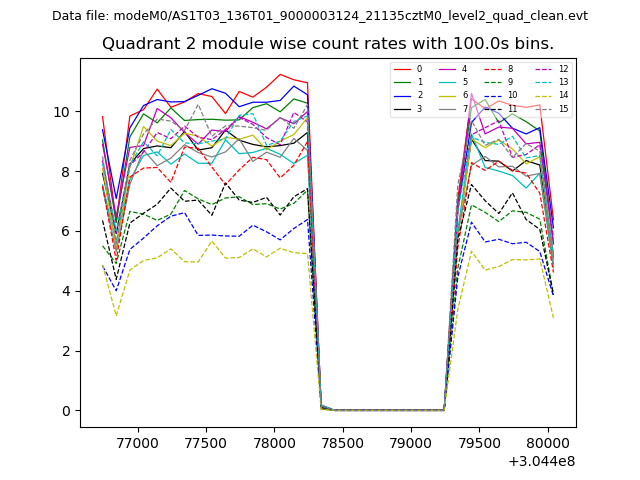
| Module-wise count rates for Quadrant B Data is divided into 100 sec bins |
 |
 |
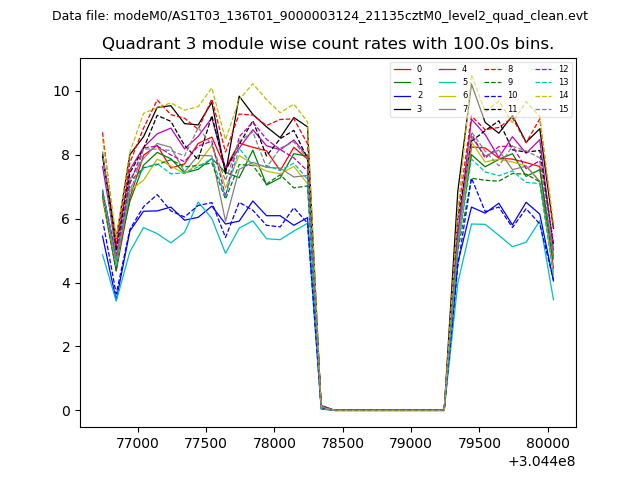
| Module-wise count rates for Quadrant C Data is divided into 100 sec bins |
 |
 |
| Module-wise count rates for Quadrant D Data is divided into 100 sec bins |
 |
 |
| Parameter | Plot |
|---|---|
| CZT HV Monitor | 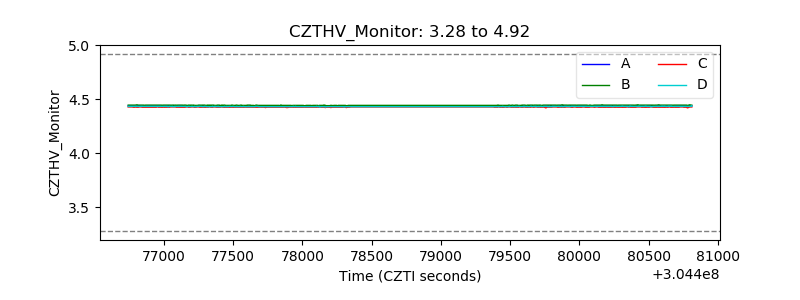 |
| D_VDD | 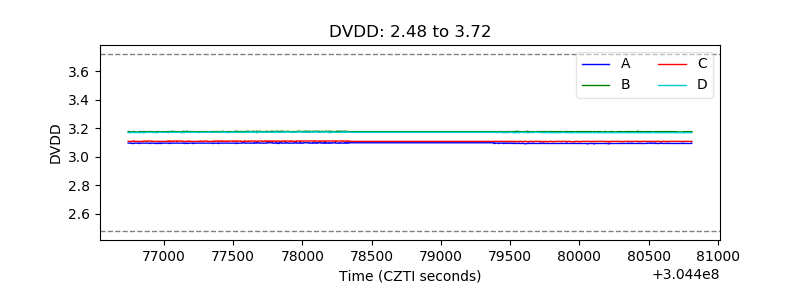 |
| Temperature 1 | 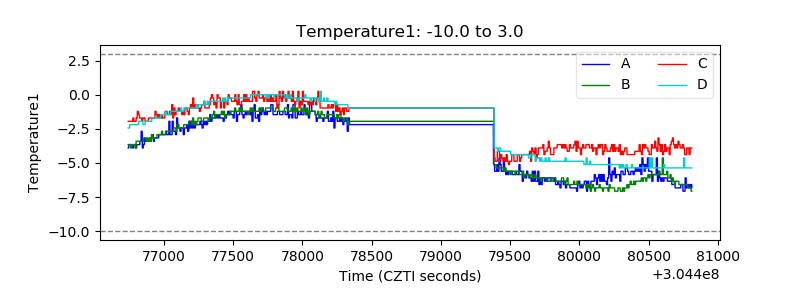 |
| Veto HV Monitor | 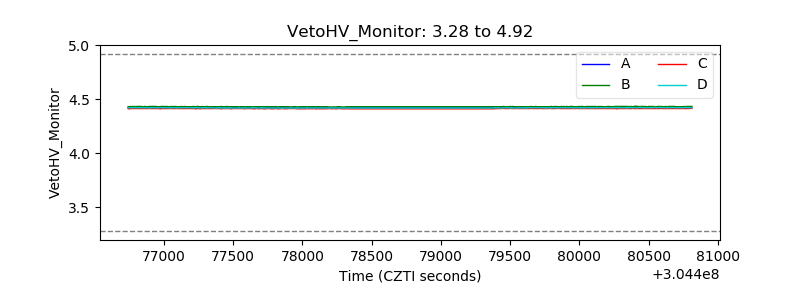 |
| Veto LLD | 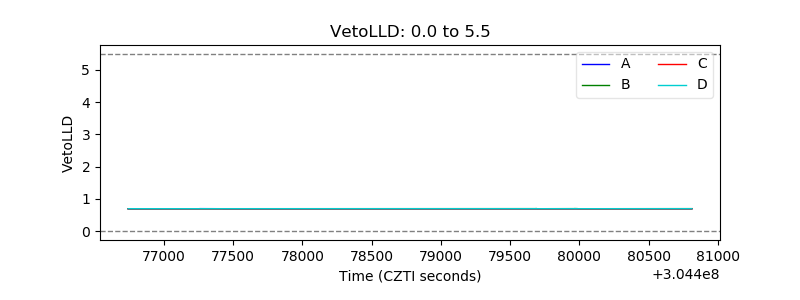 |
| Alpha Counter | 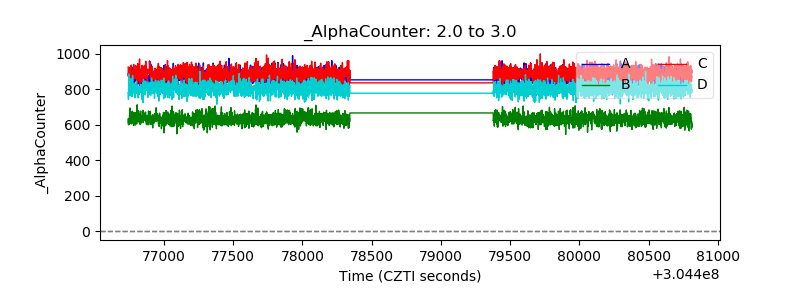 |
| _CPM_Rate | 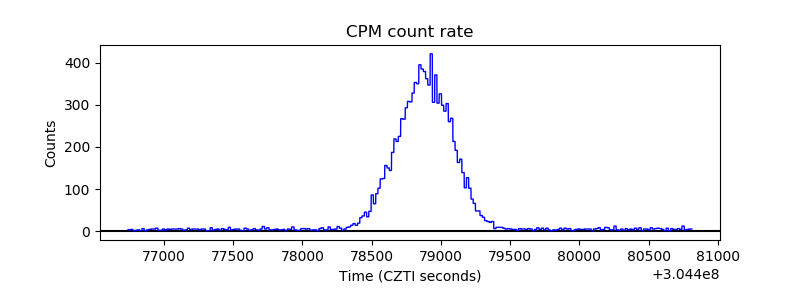 |
| CZT Counter |  |
| +2.5 Volts monitor | 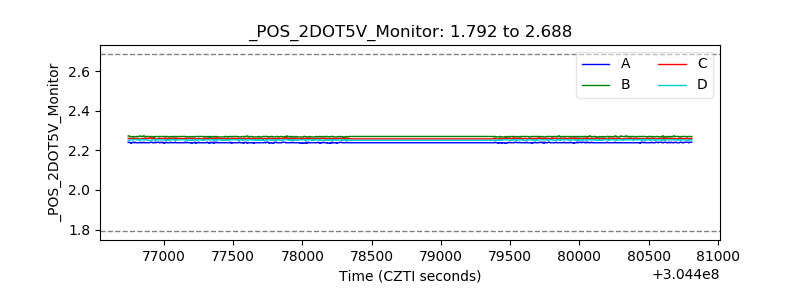 |
| +5 Volts monitor |  |
| _ROLL_ROT | 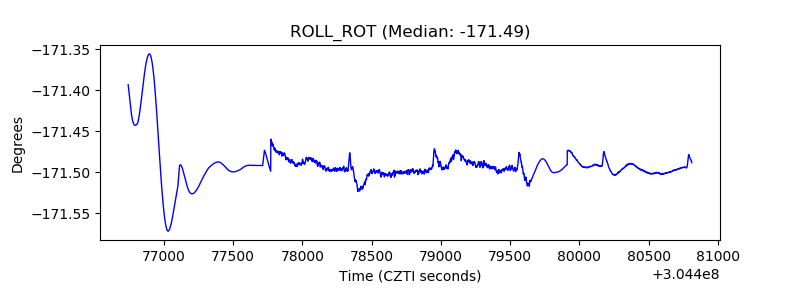 |
| _Roll_DEC | 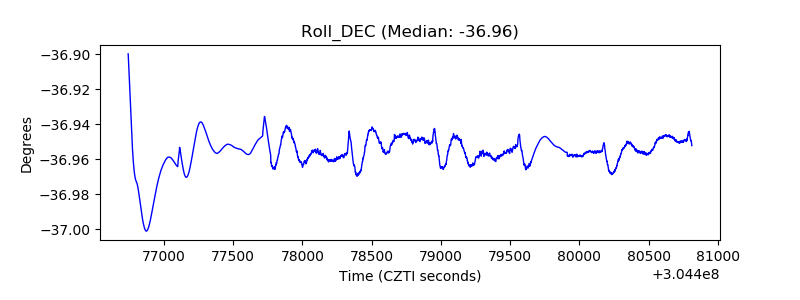 |
| _Roll_RA |  |
| Veto Counter | 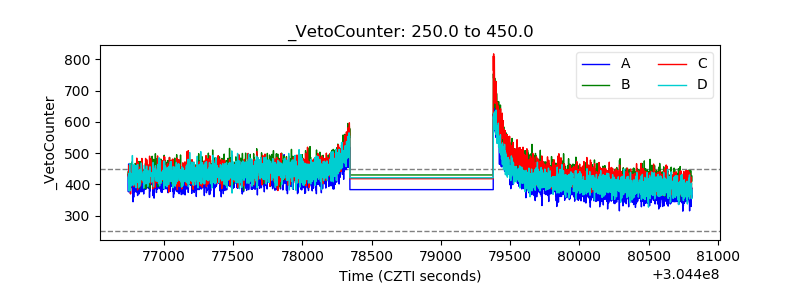 |