| Param | Original file | Final file |
|---|---|---|
| Filename | modeM0/AS1T03_136T01_9000003124_21138cztM0_level2.evt | modeM0/AS1T03_136T01_9000003124_21138cztM0_level2_quad_clean.evt |
| Size (bytes) | 659,229,120 | 92,352,960 |
| Size | 628.7 MB | 88.1 MB |
| Events in quadrant A | 4,224,095 | 562,949 |
| Events in quadrant B | 4,313,998 | 572,575 |
| Events in quadrant C | 4,013,827 | 559,810 |
| Events in quadrant D | 6,849,069 | 522,875 |
| Mode M0 | |||
|---|---|---|---|
| Quadrant | BADHDUFLAG | Total packets | Discarded packets |
| A | 0 | 17876 | 2 |
| B | 0 | 18140 | 2 |
| C | 0 | 17333 | 2 |
| D | 0 | 25977 | 2 |
| Mode SS | |||
|---|---|---|---|
| Quadrant | BADHDUFLAG | Total packets | Discarded packets |
| A | 0 | 170 | 0 |
| B | 0 | 170 | 0 |
| C | 0 | 170 | 0 |
| D | 0 | 170 | 0 |
| Mode M9 | |||
|---|---|---|---|
| Quadrant | BADHDUFLAG | Total packets | Discarded packets |
| A | 0 | 6 | 0 |
| B | 0 | 6 | 0 |
| C | 0 | 6 | 0 |
| D | 0 | 6 | 0 |
| Quadrant | Total seconds | Saturated seconds | Saturation percentage |
|---|---|---|---|
| A | 8325 | 176 | 2.114114% |
| B | 8325 | 242 | 2.906907% |
| C | 8325 | 235 | 2.822823% |
| D | 8325 | 620 | 7.447447% |
Noise dominated data is calculated using 1-second bins in cleaned event files. If a bin has >2000 counts, and if more than 50% of those come from <1% of pixels, then it is considered to be noise-dominated and hence unusable.
| Quadrant | # 1 sec bins | Bins with >0 counts | Bins with >2000 counts | High rate bins dominated by noise | Noise dominated (total time) | Noise dominated (detector-on time) | Marked lightcurve |
|---|---|---|---|---|---|---|---|
| A | 8885 | 8328 | 0 | 0 | 0.00% | 0.00% | 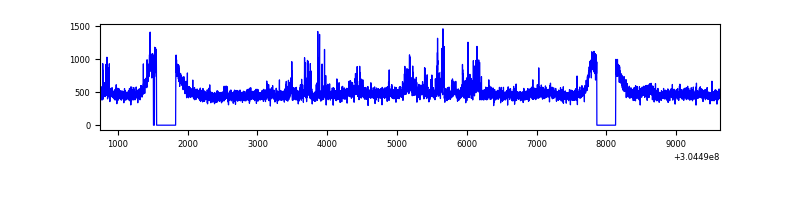 |
| B | 8885 | 8328 | 25 | 25 | 0.28% | 0.30% | 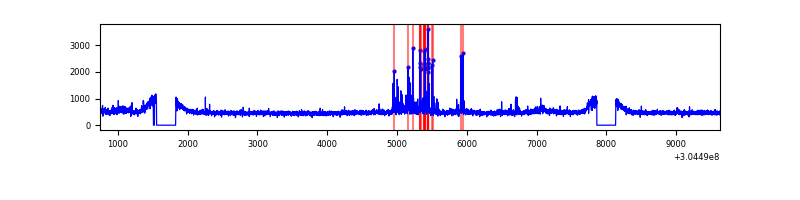 |
| C | 8885 | 8328 | 0 | 0 | 0.00% | 0.00% | 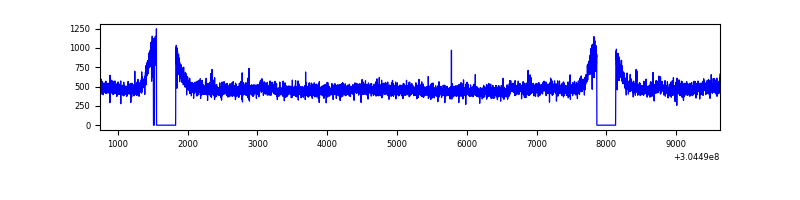 |
| D | 8885 | 8328 | 407 | 407 | 4.58% | 4.89% | 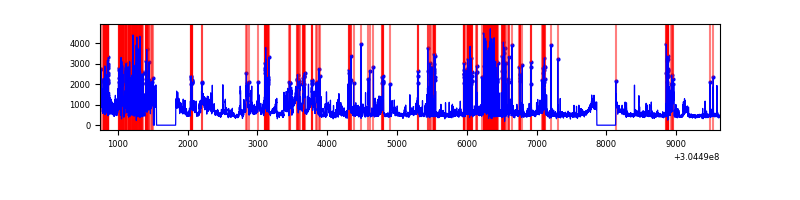 |
Top three noisy pixels from each quadrant. If the there are fewer than three noisy pixels in the level2.evt file, extra rows are filled as -1
| Pixel properties | Quadrant properties | ||||||
|---|---|---|---|---|---|---|---|
| Quadrant | DetID | PixID | Counts | Sigma | Mean | Median | Sigma |
| A | 15 | 192 | 250246 | 1200.25 | 1022 | 1001 | 207.7 |
| A | 13 | 252 | 29409 | 136.8 | 1022 | 1001 | 207.7 |
| A | 13 | 254 | 11796 | 51.98 | 1022 | 1001 | 207.7 |
| B | 7 | 220 | 165830 | 831.83 | 1022 | 996 | 198.2 |
| B | 0 | 230 | 67093 | 333.56 | 1022 | 996 | 198.2 |
| B | 12 | 111 | 24495 | 118.59 | 1022 | 996 | 198.2 |
| C | 14 | 238 | 149837 | 638.43 | 984 | 988 | 233.1 |
| C | 4 | 223 | 24743 | 101.89 | 984 | 988 | 233.1 |
| C | 3 | 233 | 6909 | 25.4 | 984 | 988 | 233.1 |
| D | 1 | 52 | 2089457 | 8745.09 | 976 | 947 | 238.8 |
| D | 5 | 222 | 411481 | 1719.0 | 976 | 947 | 238.8 |
| D | 13 | 174 | 153078 | 637.01 | 976 | 947 | 238.8 |
Histogram calculated using DETX and DETY for each event in the final _common_clean file
| Quadrant A |  |
 |
Quadrant B |
|---|---|---|---|
| Quadrant D | 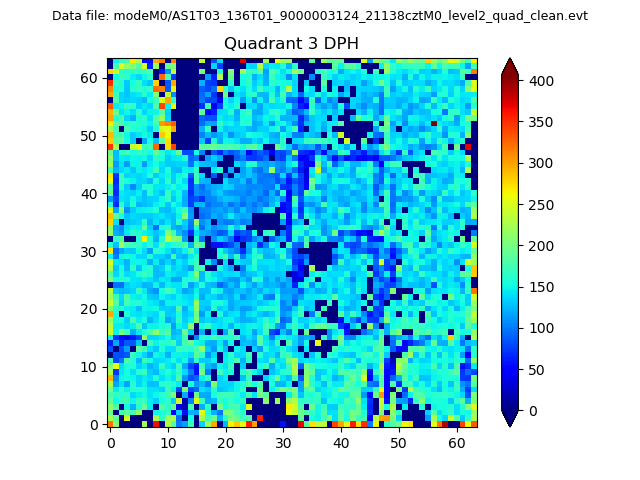 |
 |
Quadrant C |
| Plot type | Count rate plots | Images |
|---|---|---|
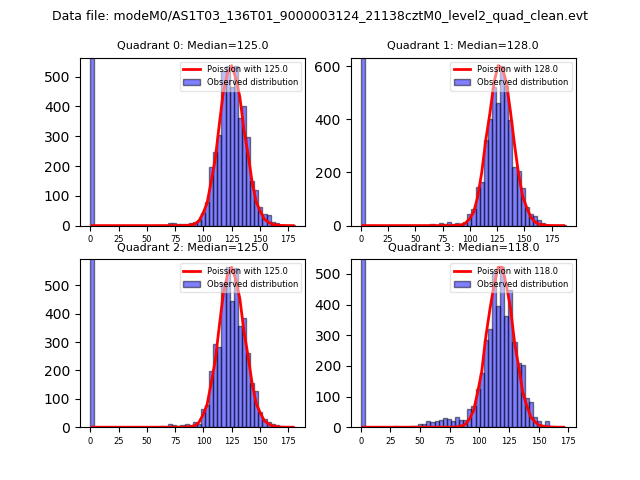
| Comparison with Poisson distribution Blue bars denote a histogram of data divided into 1 sec bins. Red curve is a Poisson curve with rate = median count rate of data. |
 |
 |
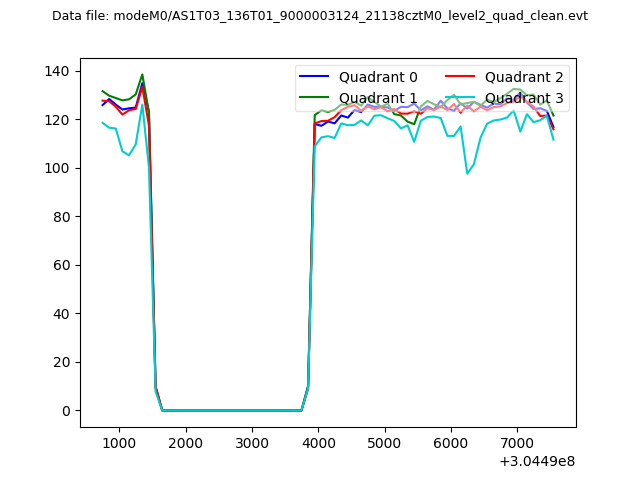
| Quadrant-wise count rates Data is divided into 100 sec bins |
 |
|
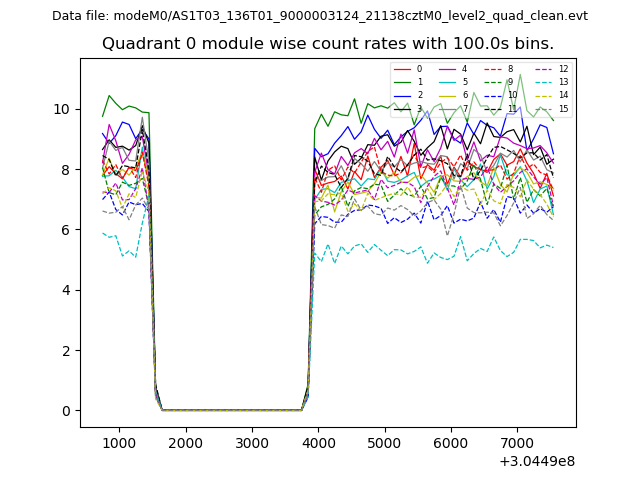
| Module-wise count rates for Quadrant A Data is divided into 100 sec bins |
 |
 |
| Module-wise count rates for Quadrant B Data is divided into 100 sec bins |
 |
 |
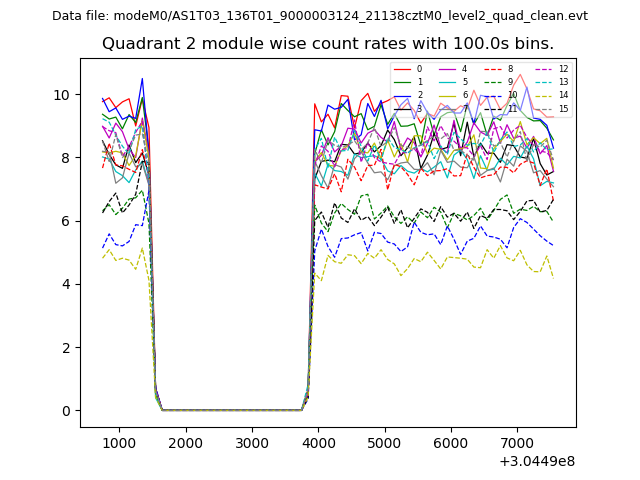
| Module-wise count rates for Quadrant C Data is divided into 100 sec bins |
 |
 |
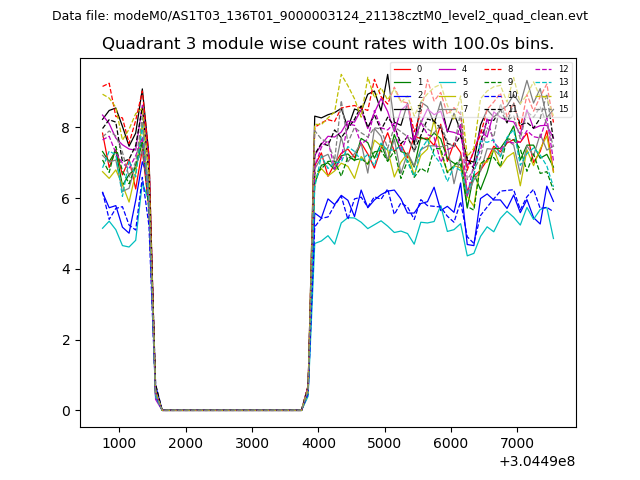
| Module-wise count rates for Quadrant D Data is divided into 100 sec bins |
 |
 |
| Parameter | Plot |
|---|---|
| CZT HV Monitor | 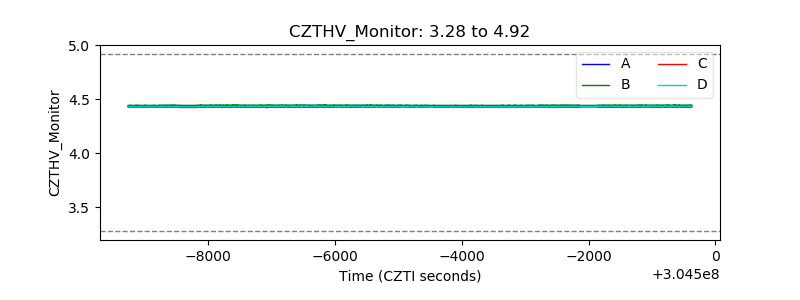 |
| D_VDD | 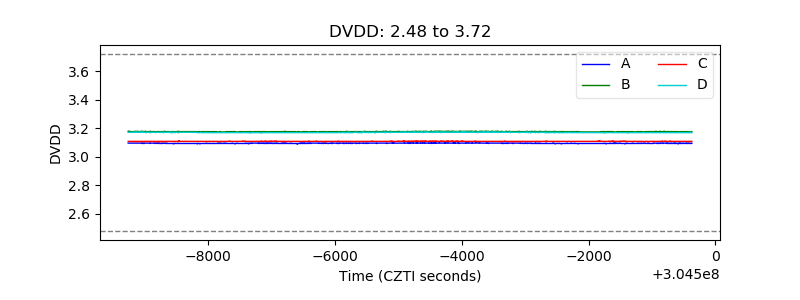 |
| Temperature 1 | 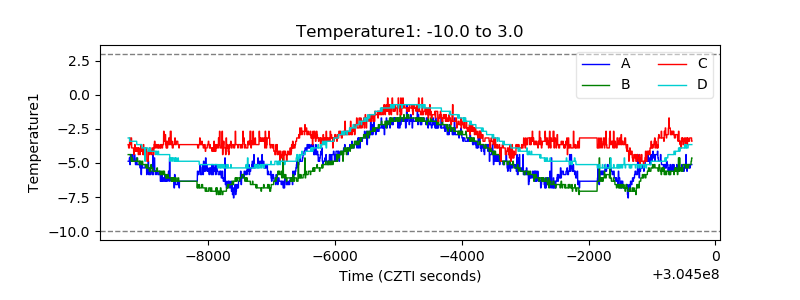 |
| Veto HV Monitor | 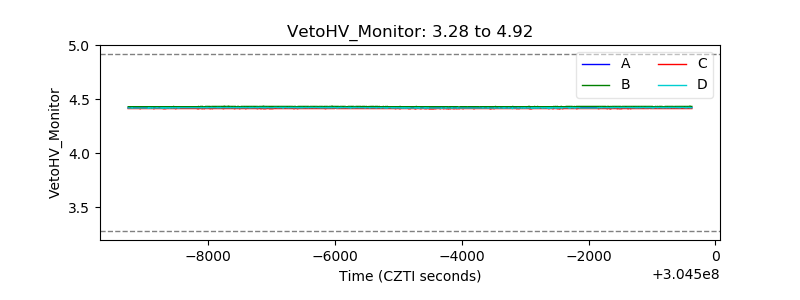 |
| Veto LLD | 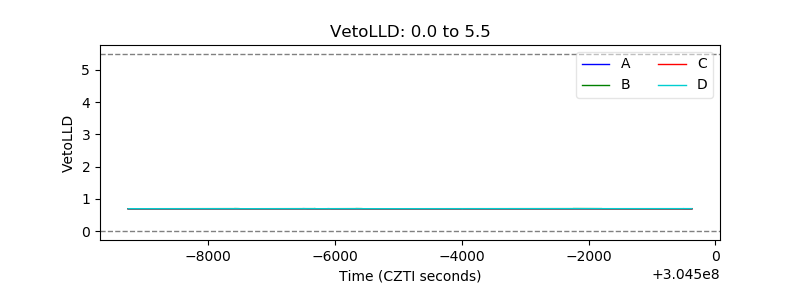 |
| Alpha Counter |  |
| _CPM_Rate | 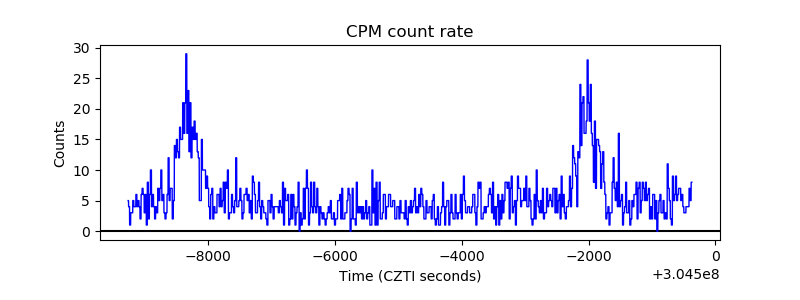 |
| CZT Counter |  |
| +2.5 Volts monitor | 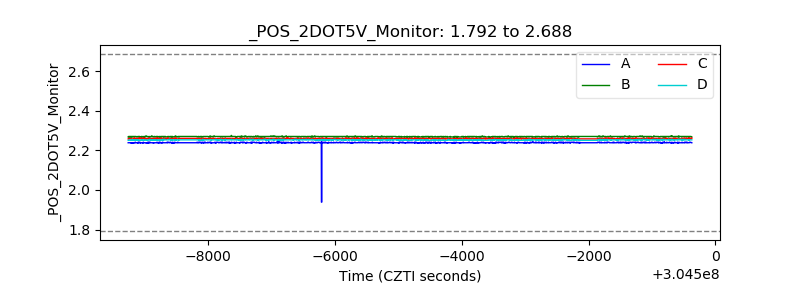 |
| +5 Volts monitor |  |
| _ROLL_ROT | 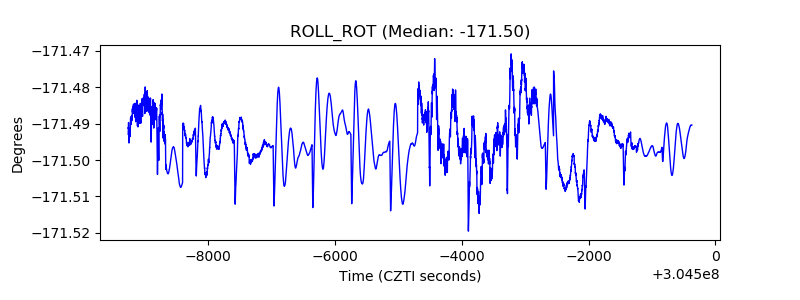 |
| _Roll_DEC | 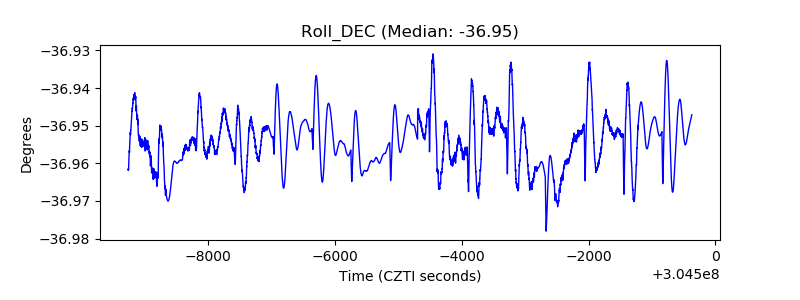 |
| _Roll_RA |  |
| Veto Counter | 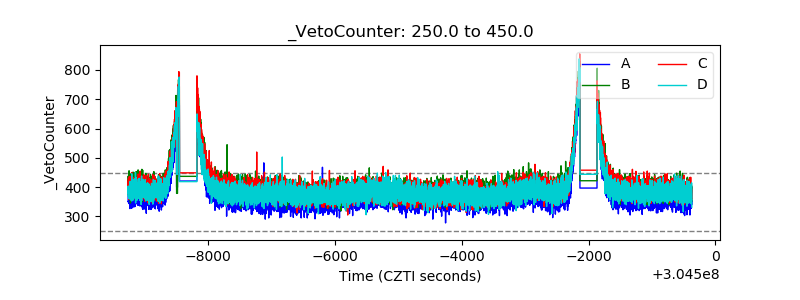 |