| Param | Original file | Final file |
|---|---|---|
| Filename | modeM0/AS1T03_136T01_9000003124_21141cztM0_level2.evt | modeM0/AS1T03_136T01_9000003124_21141cztM0_level2_quad_clean.evt |
| Size (bytes) | 1,479,545,280 | 216,924,480 |
| Size | 1.4 GB | 206.9 MB |
| Events in quadrant A | 7,645,646 | 1,424,185 |
| Events in quadrant B | 9,039,828 | 1,429,168 |
| Events in quadrant C | 7,649,285 | 1,410,422 |
| Events in quadrant D | 19,380,843 | 1,188,036 |
| Mode M0 | |||
|---|---|---|---|
| Quadrant | BADHDUFLAG | Total packets | Discarded packets |
| A | 0 | 33471 | 271 |
| B | 0 | 37298 | 295 |
| C | 0 | 33437 | 263 |
| D | 0 | 69139 | 632 |
| Mode SS | |||
|---|---|---|---|
| Quadrant | BADHDUFLAG | Total packets | Discarded packets |
| A | 0 | 332 | 4 |
| B | 0 | 332 | 6 |
| C | 0 | 332 | 2 |
| D | 0 | 332 | 4 |
| Mode M9 | |||
|---|---|---|---|
| Quadrant | BADHDUFLAG | Total packets | Discarded packets |
| A | 0 | 17 | 0 |
| B | 0 | 17 | 0 |
| C | 0 | 17 | 0 |
| D | 0 | 17 | 0 |
| Quadrant | Total seconds | Saturated seconds | Saturation percentage |
|---|---|---|---|
| A | 16205 | 218 | 1.345264% |
| B | 16206 | 491 | 3.029742% |
| C | 16203 | 295 | 1.820650% |
| D | 16184 | 3778 | 23.344043% |
Noise dominated data is calculated using 1-second bins in cleaned event files. If a bin has >2000 counts, and if more than 50% of those come from <1% of pixels, then it is considered to be noise-dominated and hence unusable.
| Quadrant | # 1 sec bins | Bins with >0 counts | Bins with >2000 counts | High rate bins dominated by noise | Noise dominated (total time) | Noise dominated (detector-on time) | Marked lightcurve |
|---|---|---|---|---|---|---|---|
| A | 21640 | 16229 | 0 | 0 | 0.00% | 0.00% | 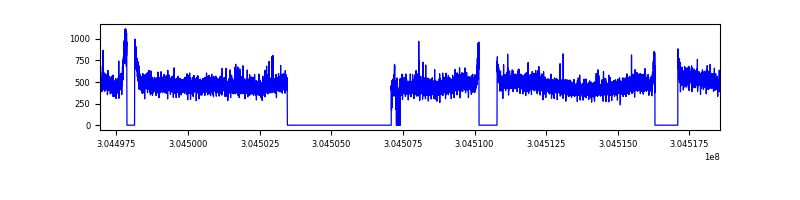 |
| B | 21640 | 16237 | 183 | 183 | 0.85% | 1.13% | 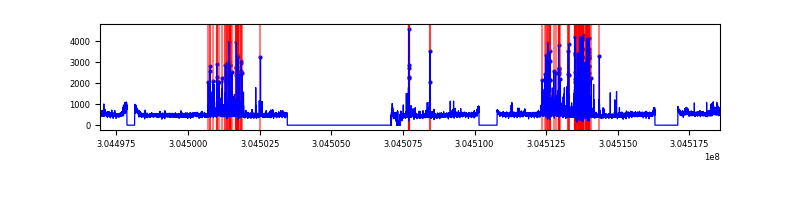 |
| C | 21640 | 16233 | 0 | 0 | 0.00% | 0.00% | 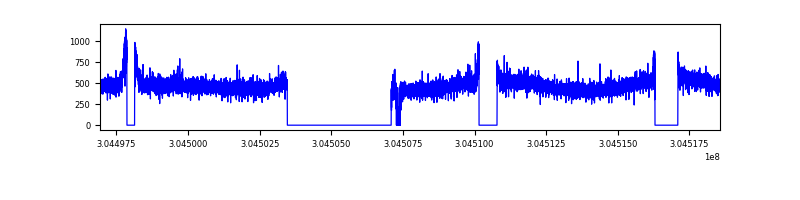 |
| D | 21639 | 16216 | 3526 | 3526 | 16.29% | 21.74% | 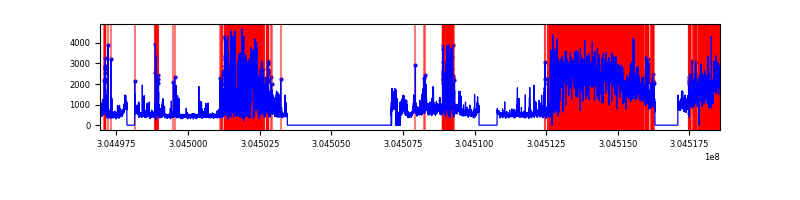 |
Top three noisy pixels from each quadrant. If the there are fewer than three noisy pixels in the level2.evt file, extra rows are filled as -1
| Pixel properties | Quadrant properties | ||||||
|---|---|---|---|---|---|---|---|
| Quadrant | DetID | PixID | Counts | Sigma | Mean | Median | Sigma |
| A | 15 | 192 | 54354 | 133.1 | 1955 | 1914 | 394.0 |
| A | 13 | 252 | 33763 | 80.84 | 1955 | 1914 | 394.0 |
| A | 13 | 254 | 24377 | 57.02 | 1955 | 1914 | 394.0 |
| B | 7 | 220 | 528032 | 1413.81 | 1946 | 1892 | 372.1 |
| B | 0 | 228 | 513144 | 1373.81 | 1946 | 1892 | 372.1 |
| B | 0 | 190 | 83705 | 219.84 | 1946 | 1892 | 372.1 |
| C | 14 | 238 | 288988 | 652.94 | 1875 | 1884 | 439.7 |
| C | 3 | 233 | 21703 | 45.07 | 1875 | 1884 | 439.7 |
| C | 4 | 223 | 16359 | 32.92 | 1875 | 1884 | 439.7 |
| D | 1 | 239 | 7961207 | 18543.51 | 1768 | 1721 | 429.2 |
| D | 5 | 222 | 1232291 | 2866.9 | 1768 | 1721 | 429.2 |
| D | 1 | 52 | 964938 | 2244.04 | 1768 | 1721 | 429.2 |
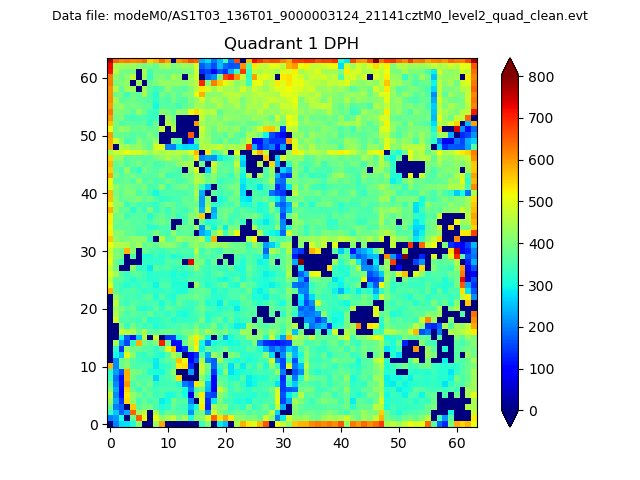
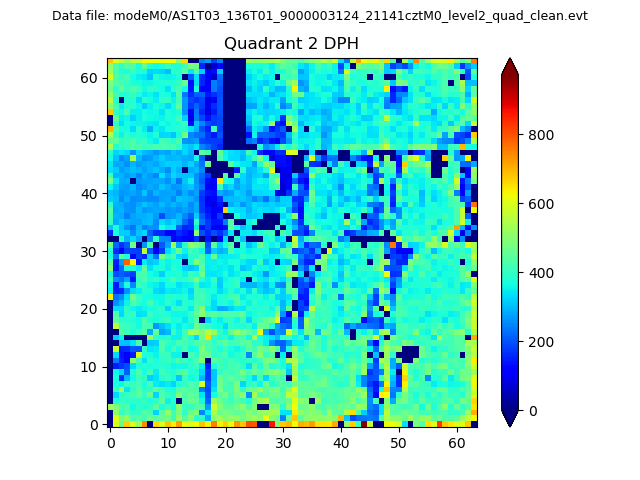
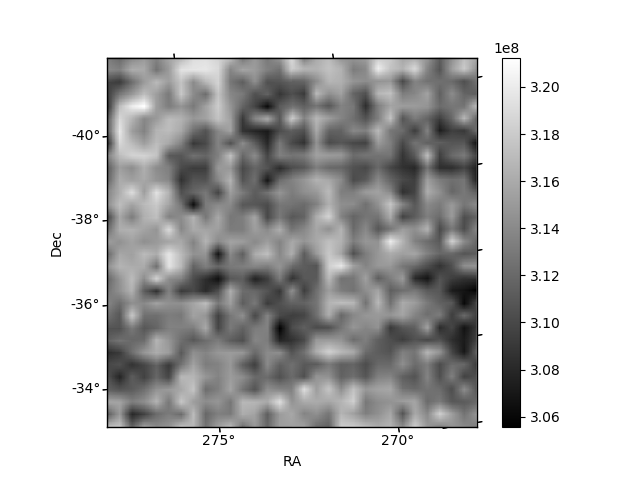
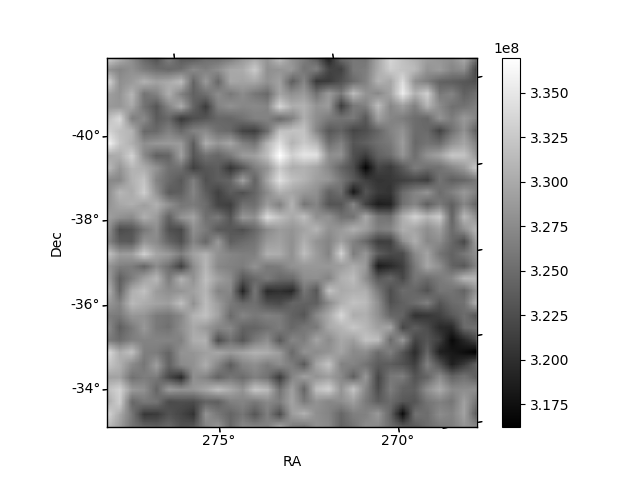
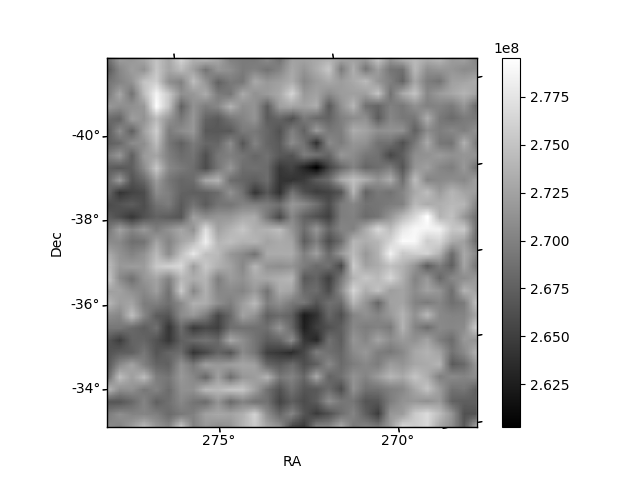
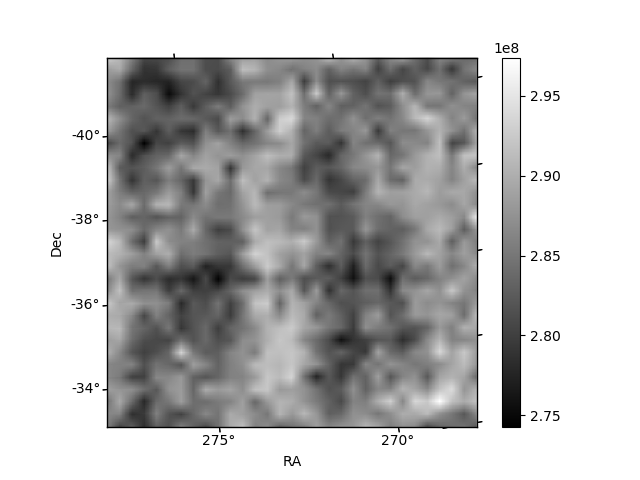
Histogram calculated using DETX and DETY for each event in the final _common_clean file
| Quadrant A |  |
 |
Quadrant B |
|---|---|---|---|
| Quadrant D | 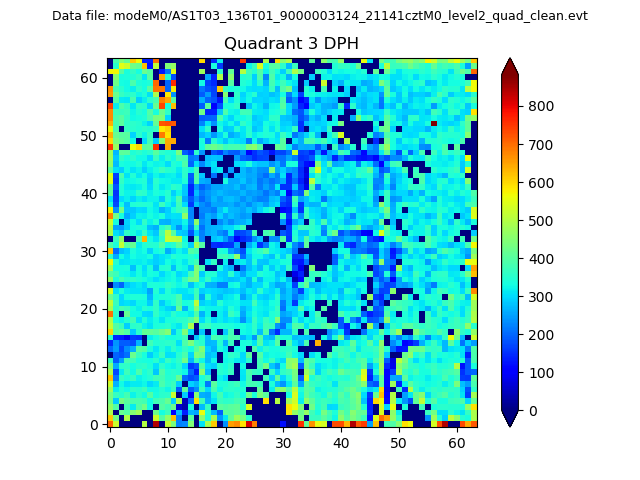 |
 |
Quadrant C |
| Plot type | Count rate plots | Images |
|---|---|---|
| Comparison with Poisson distribution Blue bars denote a histogram of data divided into 1 sec bins. Red curve is a Poisson curve with rate = median count rate of data. |
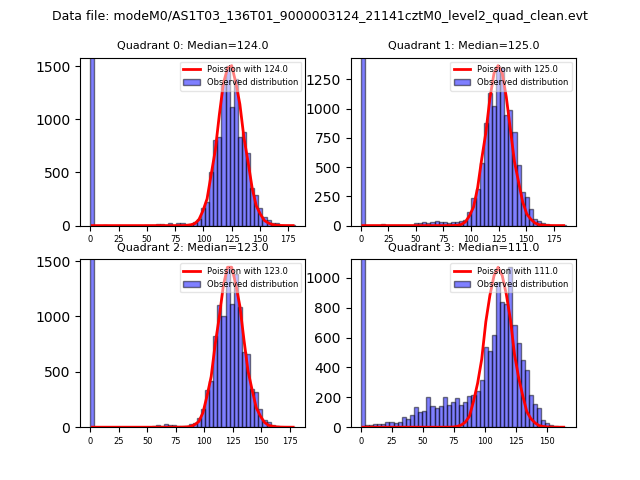 |
 |
| Quadrant-wise count rates Data is divided into 100 sec bins |
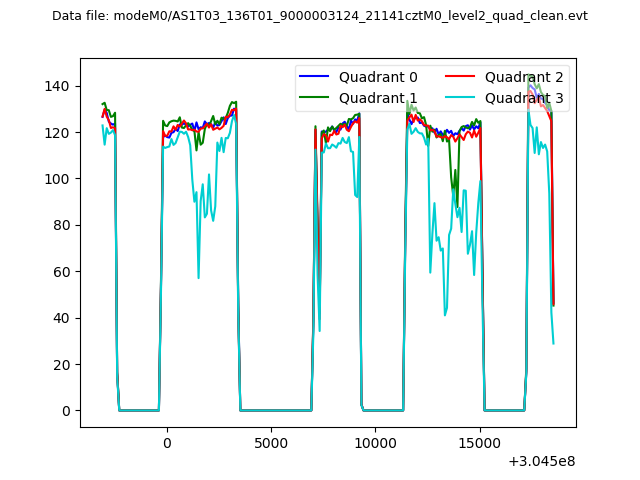 |
|
| Module-wise count rates for Quadrant A Data is divided into 100 sec bins |
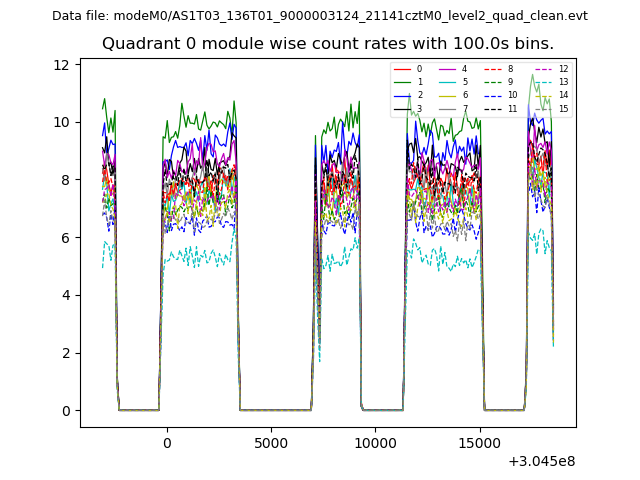 |
 |
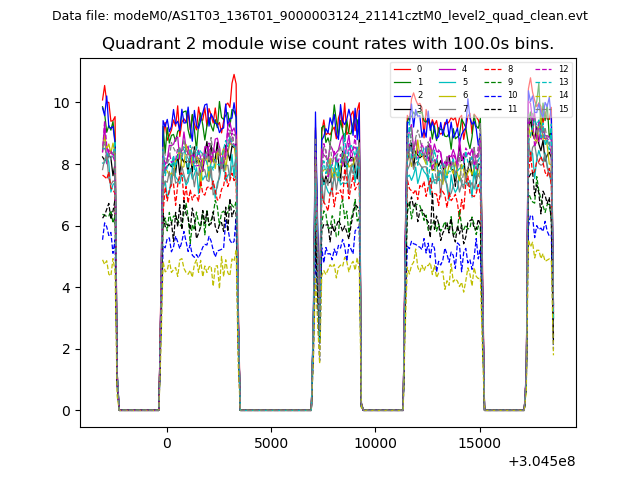
| Module-wise count rates for Quadrant B Data is divided into 100 sec bins |
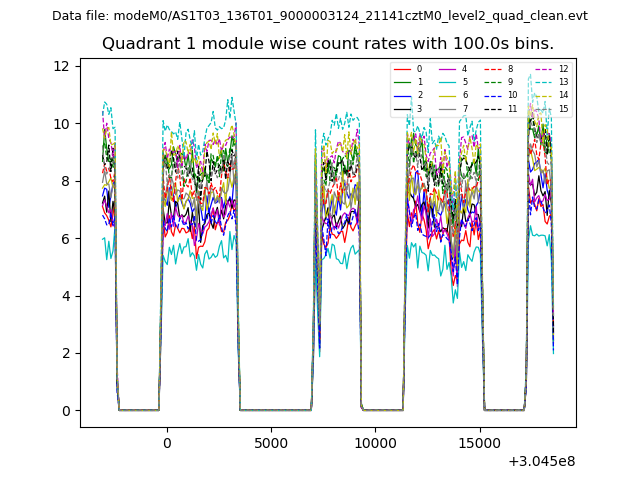 |
 |
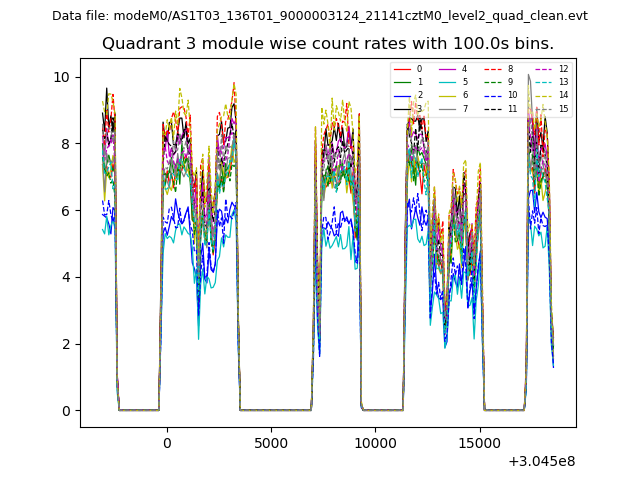
| Module-wise count rates for Quadrant C Data is divided into 100 sec bins |
 |
 |
| Module-wise count rates for Quadrant D Data is divided into 100 sec bins |
 |
 |
| Parameter | Plot |
|---|---|
| CZT HV Monitor | 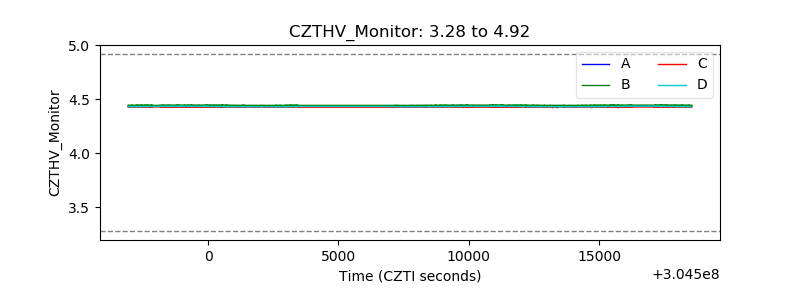 |
| D_VDD | 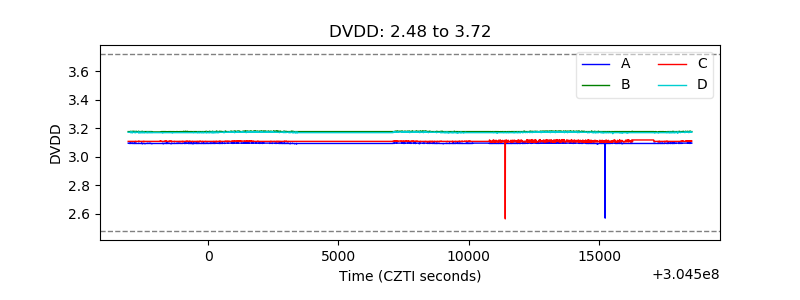 |
| Temperature 1 | 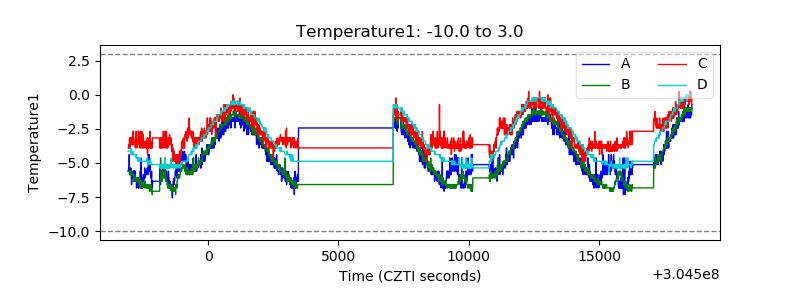 |
| Veto HV Monitor | 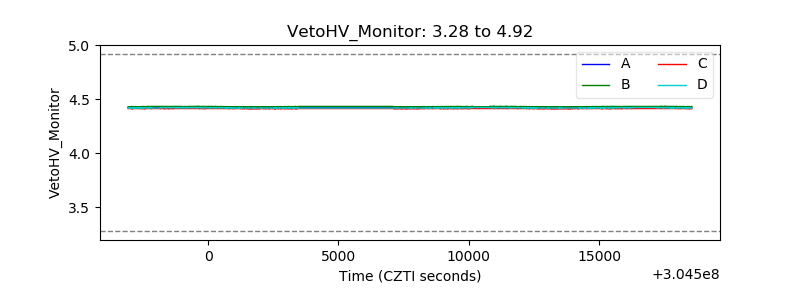 |
| Veto LLD | 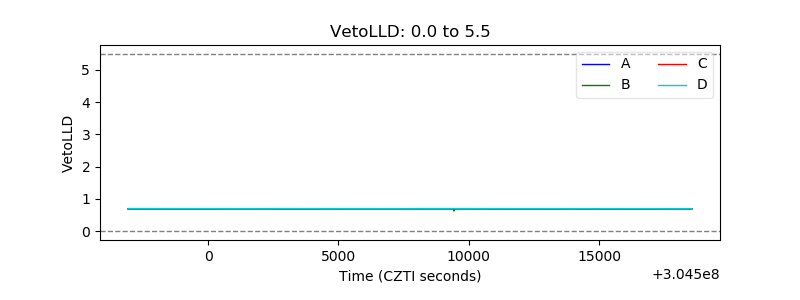 |
| Alpha Counter |  |
| _CPM_Rate | 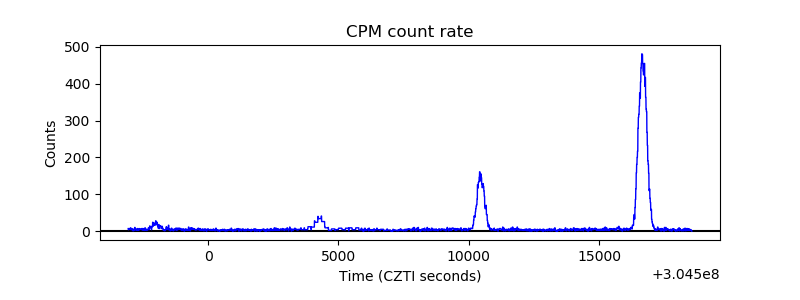 |
| CZT Counter | 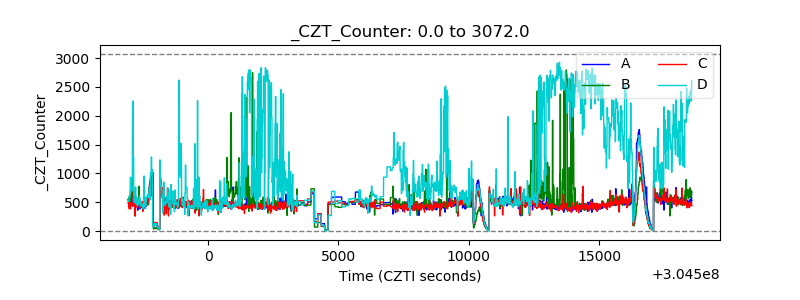 |
| +2.5 Volts monitor |  |
| +5 Volts monitor |  |
| _ROLL_ROT | 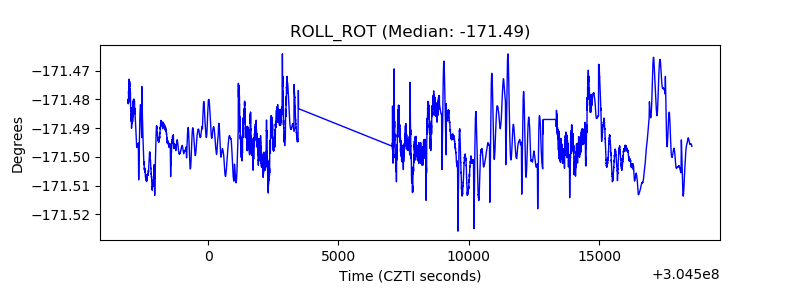 |
| _Roll_DEC | 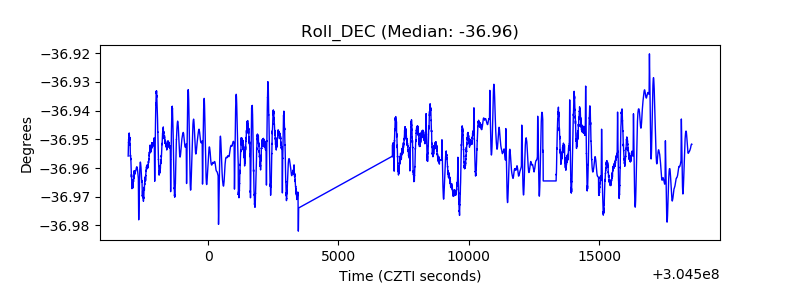 |
| _Roll_RA |  |
| Veto Counter | 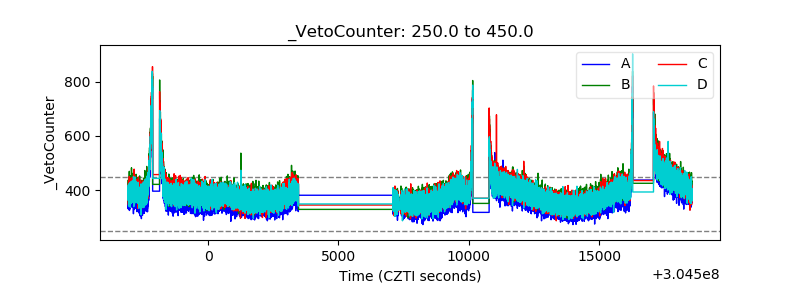 |