| Param | Original file | Final file |
|---|---|---|
| Filename | modeM0/AS1T03_136T01_9000003124_21142cztM0_level2.evt | modeM0/AS1T03_136T01_9000003124_21142cztM0_level2_quad_clean.evt |
| Size (bytes) | 742,674,240 | 79,986,240 |
| Size | 708.3 MB | 76.3 MB |
| Events in quadrant A | 2,735,346 | 569,017 |
| Events in quadrant B | 3,134,141 | 573,525 |
| Events in quadrant C | 2,725,845 | 554,065 |
| Events in quadrant D | 13,508,020 | 322,984 |
| Mode M0 | |||
|---|---|---|---|
| Quadrant | BADHDUFLAG | Total packets | Discarded packets |
| A | 0 | 11980 | 3 |
| B | 0 | 13129 | 4 |
| C | 0 | 11907 | 5 |
| D | 0 | 44000 | 7 |
| Mode SS | |||
|---|---|---|---|
| Quadrant | BADHDUFLAG | Total packets | Discarded packets |
| A | 0 | 116 | 0 |
| B | 0 | 116 | 0 |
| C | 0 | 116 | 0 |
| D | 0 | 116 | 0 |
| Mode M9 | |||
|---|---|---|---|
| Quadrant | BADHDUFLAG | Total packets | Discarded packets |
| A | 0 | 10 | 0 |
| B | 0 | 10 | 0 |
| C | 0 | 10 | 0 |
| D | 0 | 10 | 0 |
| Quadrant | Total seconds | Saturated seconds | Saturation percentage |
|---|---|---|---|
| A | 5736 | 49 | 0.854254% |
| B | 5737 | 64 | 1.115566% |
| C | 5736 | 76 | 1.324965% |
| D | 5737 | 4933 | 85.985707% |
Noise dominated data is calculated using 1-second bins in cleaned event files. If a bin has >2000 counts, and if more than 50% of those come from <1% of pixels, then it is considered to be noise-dominated and hence unusable.
| Quadrant | # 1 sec bins | Bins with >0 counts | Bins with >2000 counts | High rate bins dominated by noise | Noise dominated (total time) | Noise dominated (detector-on time) | Marked lightcurve |
|---|---|---|---|---|---|---|---|
| A | 6701 | 5736 | 0 | 0 | 0.00% | 0.00% | 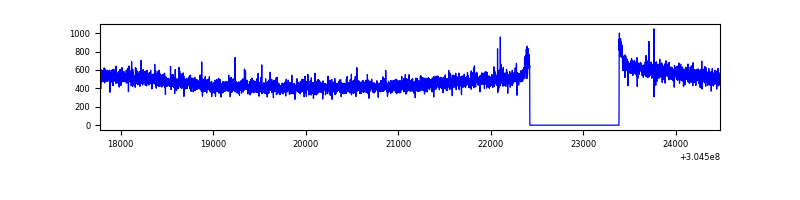 |
| B | 6702 | 5737 | 16 | 16 | 0.24% | 0.28% | 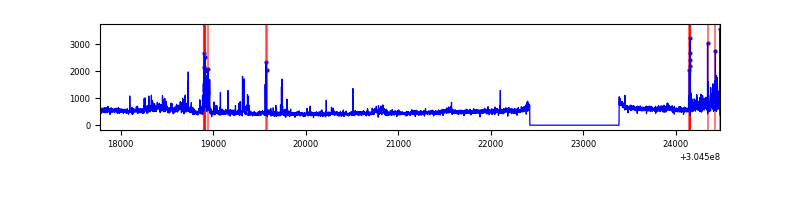 |
| C | 6701 | 5736 | 0 | 0 | 0.00% | 0.00% | 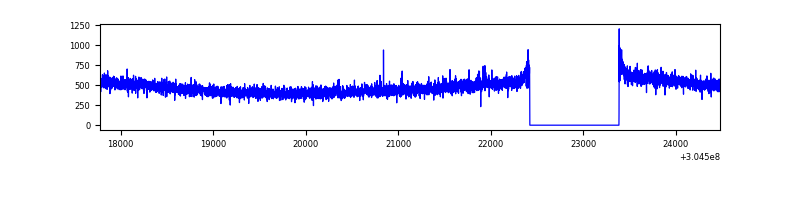 |
| D | 6701 | 5736 | 4531 | 4531 | 67.62% | 78.99% | 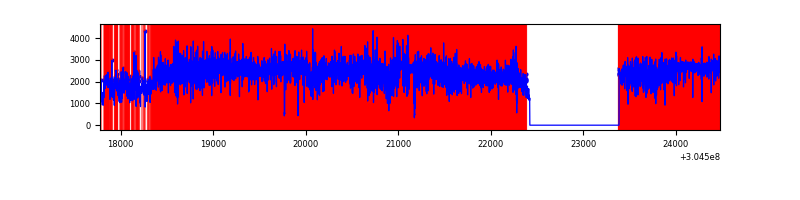 |
Top three noisy pixels from each quadrant. If the there are fewer than three noisy pixels in the level2.evt file, extra rows are filled as -1
| Pixel properties | Quadrant properties | ||||||
|---|---|---|---|---|---|---|---|
| Quadrant | DetID | PixID | Counts | Sigma | Mean | Median | Sigma |
| A | 8 | 6 | 8974 | 58.1 | 706 | 692 | 142.5 |
| A | 13 | 254 | 8273 | 53.19 | 706 | 692 | 142.5 |
| A | 0 | 226 | 6254 | 39.02 | 706 | 692 | 142.5 |
| B | 7 | 220 | 88995 | 649.59 | 701 | 683 | 136.0 |
| B | 0 | 190 | 81616 | 595.31 | 701 | 683 | 136.0 |
| B | 0 | 189 | 51114 | 370.95 | 701 | 683 | 136.0 |
| C | 14 | 238 | 105722 | 667.45 | 671 | 675 | 157.4 |
| C | 13 | 61 | 4659 | 25.31 | 671 | 675 | 157.4 |
| C | 3 | 233 | 2535 | 11.82 | 671 | 675 | 157.4 |
| D | 1 | 239 | 10242383 | 87903.53 | 474 | 459 | 116.5 |
| D | 9 | 65 | 805494 | 6909.39 | 474 | 459 | 116.5 |
| D | 1 | 52 | 439721 | 3770.06 | 474 | 459 | 116.5 |
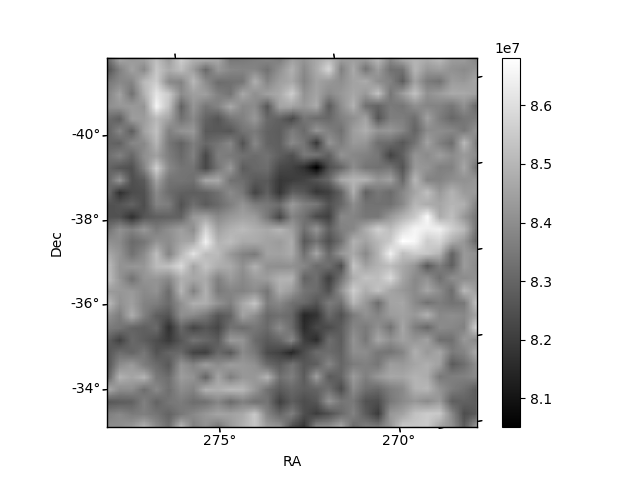
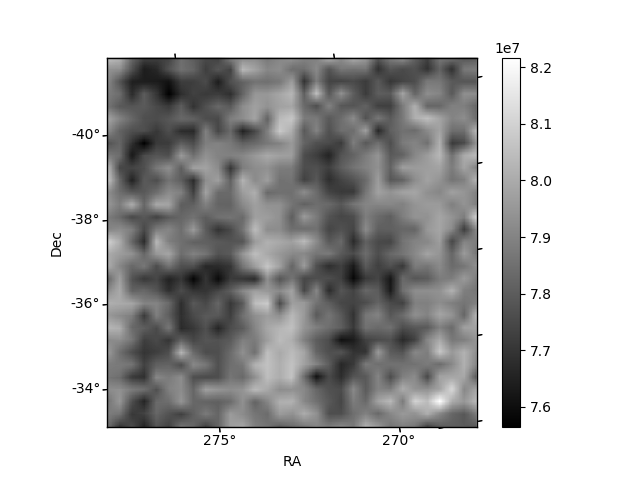
Histogram calculated using DETX and DETY for each event in the final _common_clean file
| Quadrant A |  |
 |
Quadrant B |
|---|---|---|---|
| Quadrant D |  |
 |
Quadrant C |
| Plot type | Count rate plots | Images |
|---|---|---|
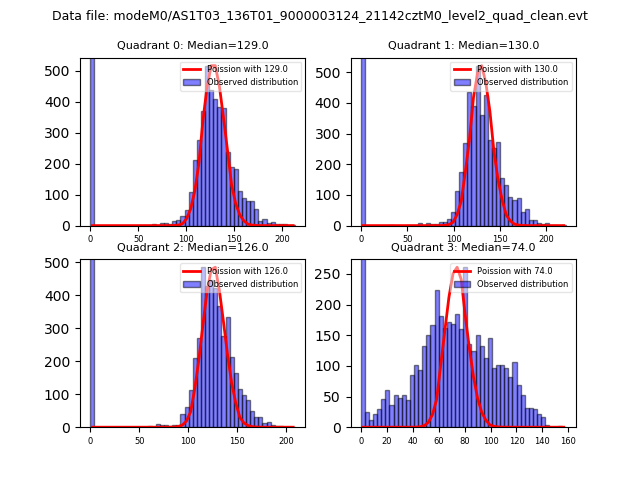
| Comparison with Poisson distribution Blue bars denote a histogram of data divided into 1 sec bins. Red curve is a Poisson curve with rate = median count rate of data. |
 |
 |
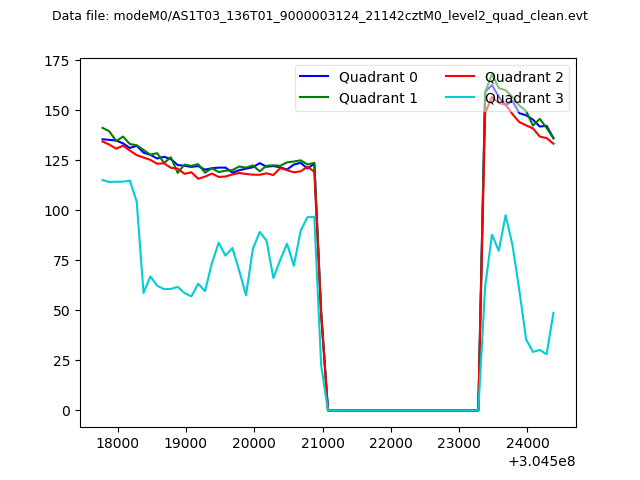
| Quadrant-wise count rates Data is divided into 100 sec bins |
 |
|
| Module-wise count rates for Quadrant A Data is divided into 100 sec bins |
 |
 |
| Module-wise count rates for Quadrant B Data is divided into 100 sec bins |
 |
 |
| Module-wise count rates for Quadrant C Data is divided into 100 sec bins |
 |
 |
| Module-wise count rates for Quadrant D Data is divided into 100 sec bins |
 |
 |
| Parameter | Plot |
|---|---|
| CZT HV Monitor |  |
| D_VDD | 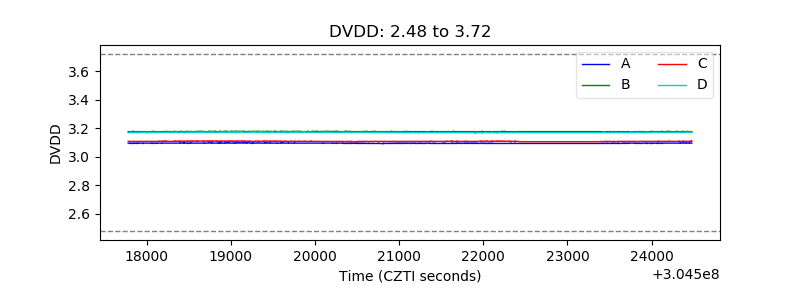 |
| Temperature 1 |  |
| Veto HV Monitor |  |
| Veto LLD |  |
| Alpha Counter |  |
| _CPM_Rate | 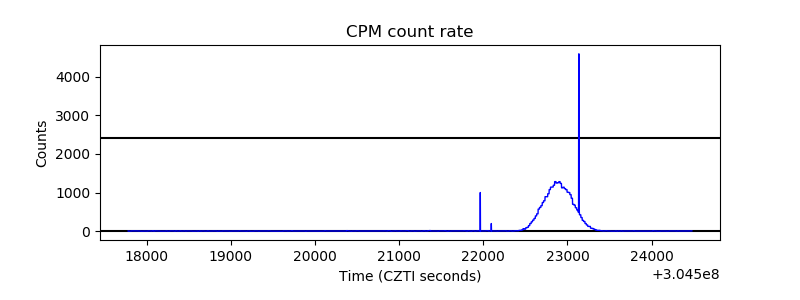 |
| CZT Counter |  |
| +2.5 Volts monitor |  |
| +5 Volts monitor |  |
| _ROLL_ROT |  |
| _Roll_DEC |  |
| _Roll_RA |  |
| Veto Counter |  |