| Param | Original file | Final file |
|---|---|---|
| Filename | modeM0/AS1T03_136T01_9000003124_21144cztM0_level2.evt | modeM0/AS1T03_136T01_9000003124_21144cztM0_level2_quad_clean.evt |
| Size (bytes) | 2,752,142,400 | 379,497,600 |
| Size | 2.6 GB | 361.9 MB |
| Events in quadrant A | 13,605,688 | 2,529,347 |
| Events in quadrant B | 16,084,486 | 2,533,628 |
| Events in quadrant C | 13,575,685 | 2,478,280 |
| Events in quadrant D | 38,141,266 | 1,968,299 |
| Mode M0 | |||
|---|---|---|---|
| Quadrant | BADHDUFLAG | Total packets | Discarded packets |
| A | 0 | 59385 | 5 |
| B | 0 | 66243 | 5 |
| C | 0 | 59204 | 5 |
| D | 0 | 132701 | 7 |
| Mode SS | |||
|---|---|---|---|
| Quadrant | BADHDUFLAG | Total packets | Discarded packets |
| A | 0 | 588 | 0 |
| B | 0 | 588 | 0 |
| C | 0 | 588 | 0 |
| D | 0 | 588 | 0 |
| Mode M9 | |||
|---|---|---|---|
| Quadrant | BADHDUFLAG | Total packets | Discarded packets |
| A | 0 | 39 | 0 |
| B | 0 | 39 | 0 |
| C | 0 | 39 | 0 |
| D | 0 | 39 | 0 |
| Quadrant | Total seconds | Saturated seconds | Saturation percentage |
|---|---|---|---|
| A | 28821 | 280 | 0.971514% |
| B | 28822 | 675 | 2.341961% |
| C | 28822 | 407 | 1.412116% |
| D | 28821 | 9192 | 31.893411% |
Noise dominated data is calculated using 1-second bins in cleaned event files. If a bin has >2000 counts, and if more than 50% of those come from <1% of pixels, then it is considered to be noise-dominated and hence unusable.
| Quadrant | # 1 sec bins | Bins with >0 counts | Bins with >2000 counts | High rate bins dominated by noise | Noise dominated (total time) | Noise dominated (detector-on time) | Marked lightcurve |
|---|---|---|---|---|---|---|---|
| A | 32786 | 28823 | 0 | 0 | 0.00% | 0.00% | 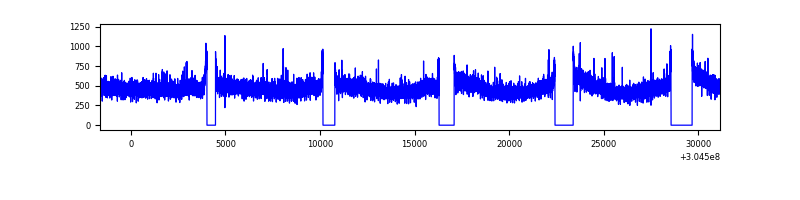 |
| B | 32787 | 28826 | 283 | 283 | 0.86% | 0.98% | 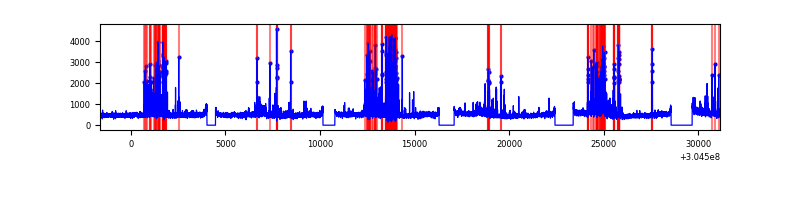 |
| C | 32787 | 28826 | 0 | 0 | 0.00% | 0.00% | 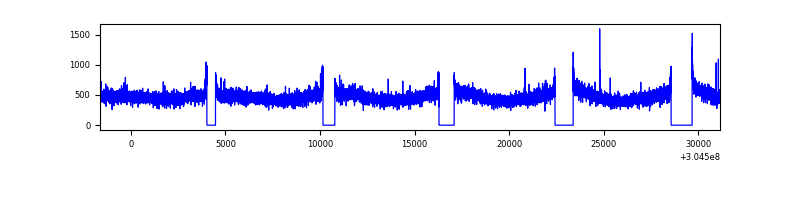 |
| D | 32786 | 28823 | 8626 | 8626 | 26.31% | 29.93% | 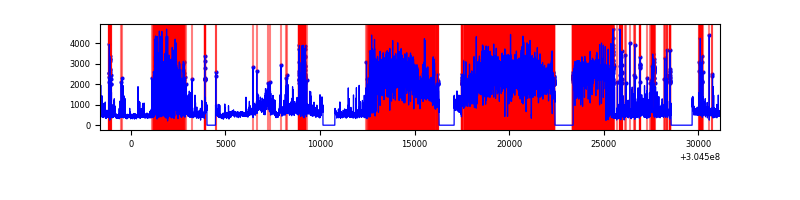 |
Top three noisy pixels from each quadrant. If the there are fewer than three noisy pixels in the level2.evt file, extra rows are filled as -1
| Pixel properties | Quadrant properties | ||||||
|---|---|---|---|---|---|---|---|
| Quadrant | DetID | PixID | Counts | Sigma | Mean | Median | Sigma |
| A | 15 | 192 | 74640 | 101.66 | 3490 | 3415 | 700.6 |
| A | 13 | 252 | 43225 | 56.82 | 3490 | 3415 | 700.6 |
| A | 13 | 254 | 42232 | 55.4 | 3490 | 3415 | 700.6 |
| B | 7 | 220 | 796157 | 1205.57 | 3466 | 3381 | 657.6 |
| B | 0 | 228 | 725640 | 1098.34 | 3466 | 3381 | 657.6 |
| B | 0 | 190 | 258817 | 388.44 | 3466 | 3381 | 657.6 |
| C | 14 | 238 | 518864 | 662.74 | 3333 | 3349 | 777.9 |
| C | 3 | 233 | 33068 | 38.21 | 3333 | 3349 | 777.9 |
| C | 13 | 61 | 23211 | 25.53 | 3333 | 3349 | 777.9 |
| D | 1 | 239 | 18701236 | 25680.18 | 2998 | 2914 | 728.1 |
| D | 9 | 65 | 1910211 | 2619.47 | 2998 | 2914 | 728.1 |
| D | 1 | 52 | 1867354 | 2560.61 | 2998 | 2914 | 728.1 |
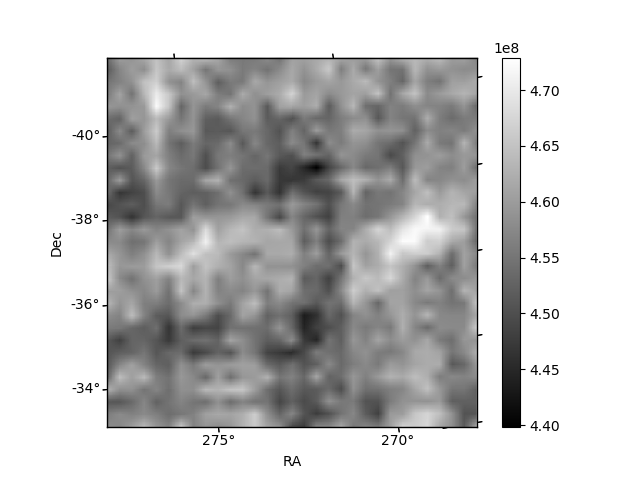
Histogram calculated using DETX and DETY for each event in the final _common_clean file
| Quadrant A | 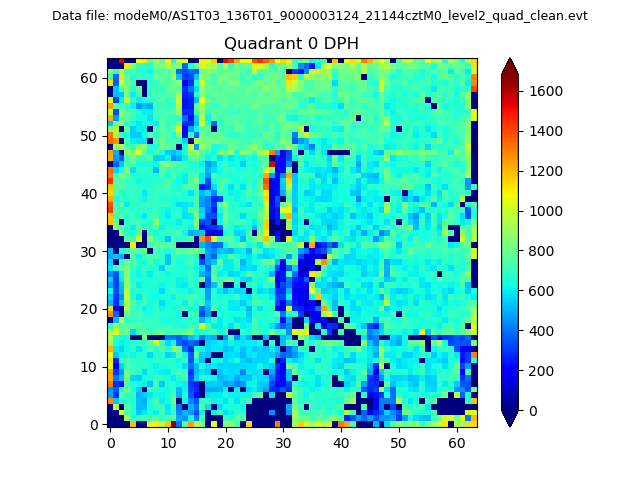 |
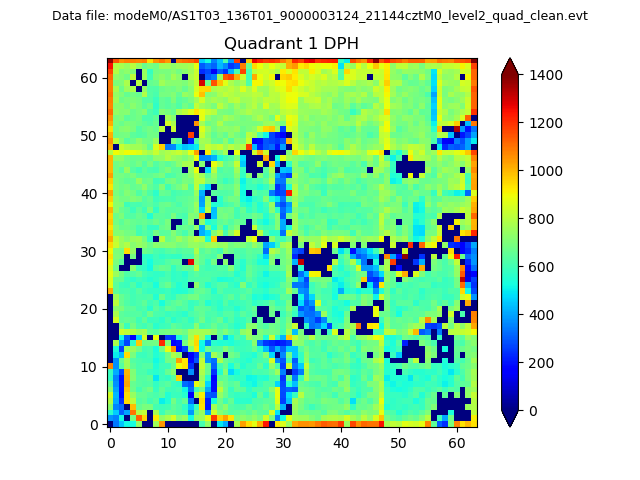 |
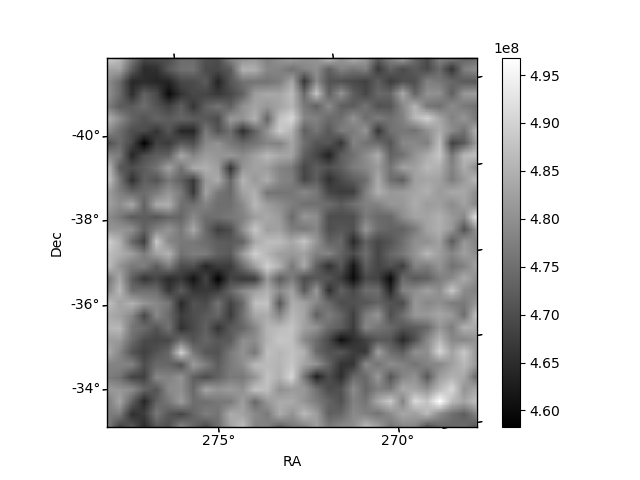
Quadrant B |
|---|---|---|---|
| Quadrant D | 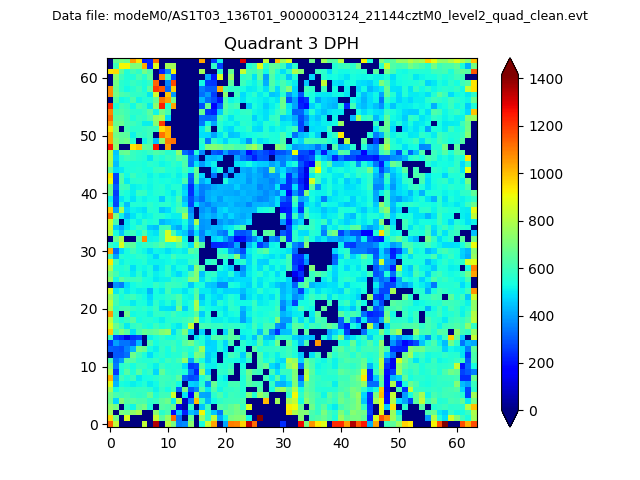 |
 |
Quadrant C |
| Plot type | Count rate plots | Images |
|---|---|---|
| Comparison with Poisson distribution Blue bars denote a histogram of data divided into 1 sec bins. Red curve is a Poisson curve with rate = median count rate of data. |
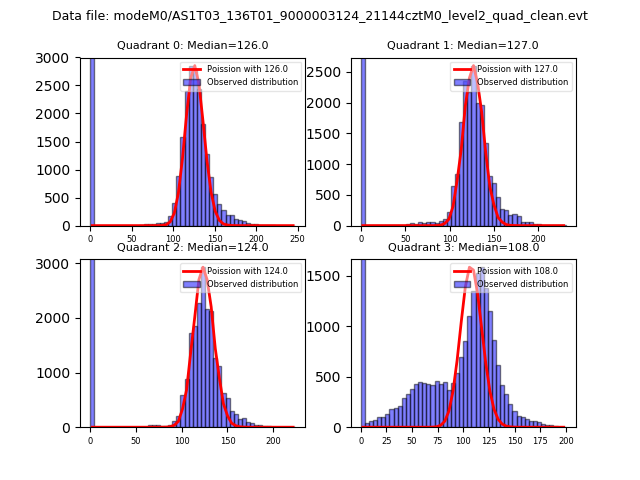 |
 |
| Quadrant-wise count rates Data is divided into 100 sec bins |
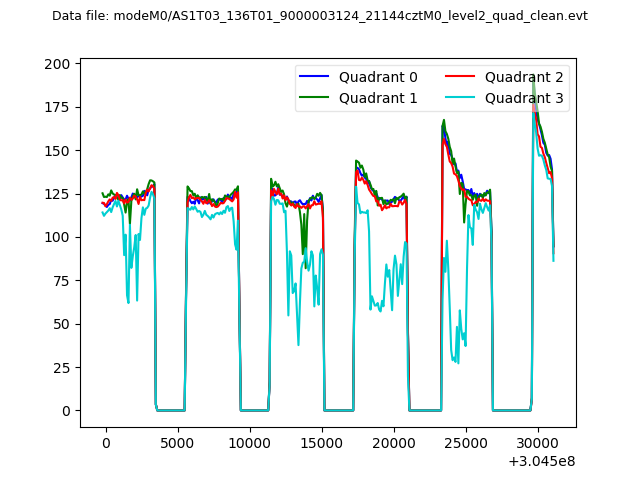 |
|
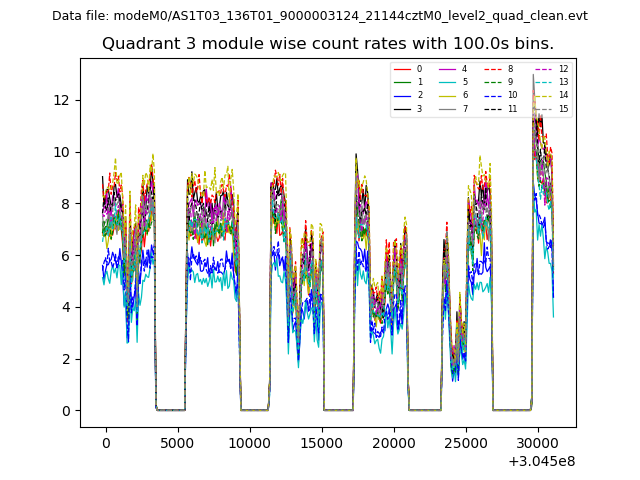
| Module-wise count rates for Quadrant A Data is divided into 100 sec bins |
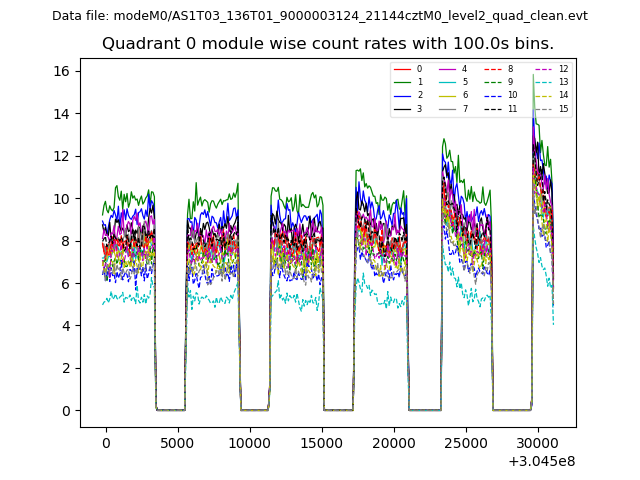 |
 |
| Module-wise count rates for Quadrant B Data is divided into 100 sec bins |
 |
 |
| Module-wise count rates for Quadrant C Data is divided into 100 sec bins |
 |
 |
| Module-wise count rates for Quadrant D Data is divided into 100 sec bins |
 |
 |
| Parameter | Plot |
|---|---|
| CZT HV Monitor | 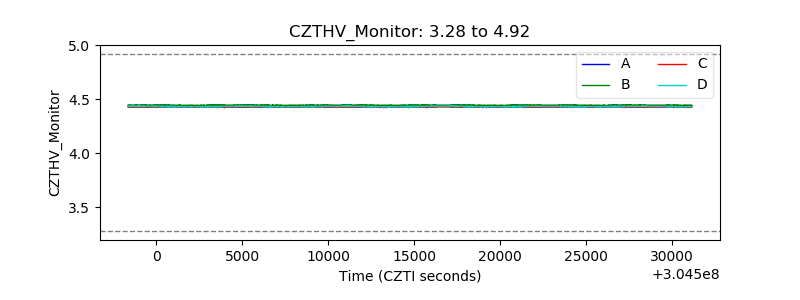 |
| D_VDD | 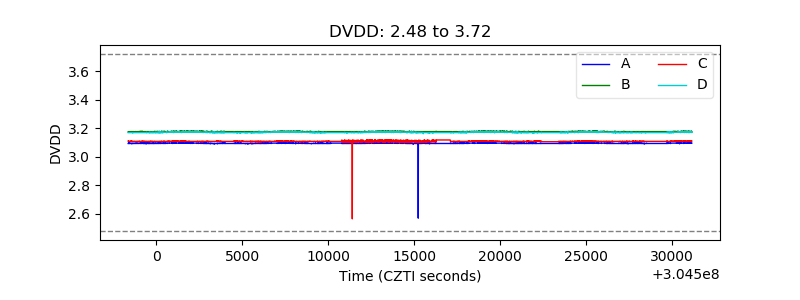 |
| Temperature 1 | 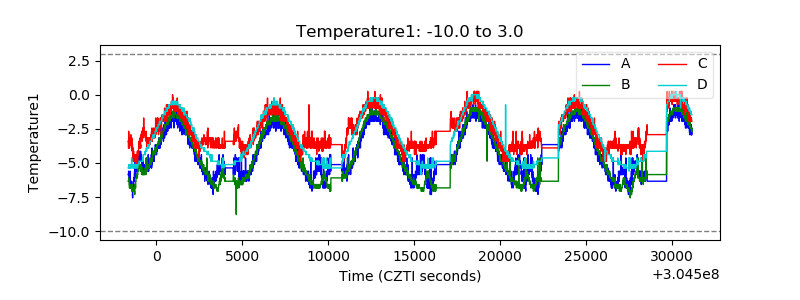 |
| Veto HV Monitor | 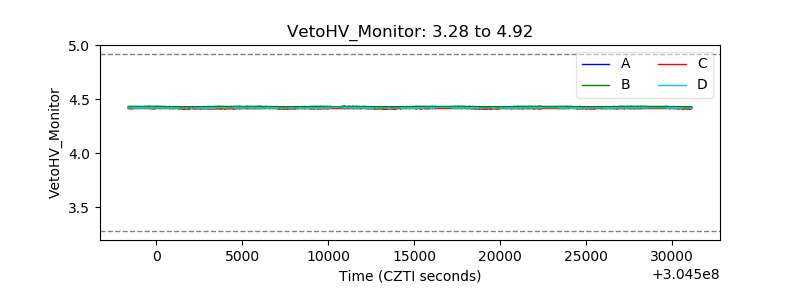 |
| Veto LLD | 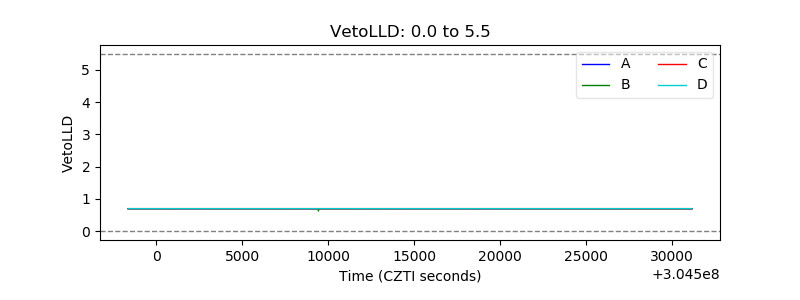 |
| Alpha Counter |  |
| _CPM_Rate | 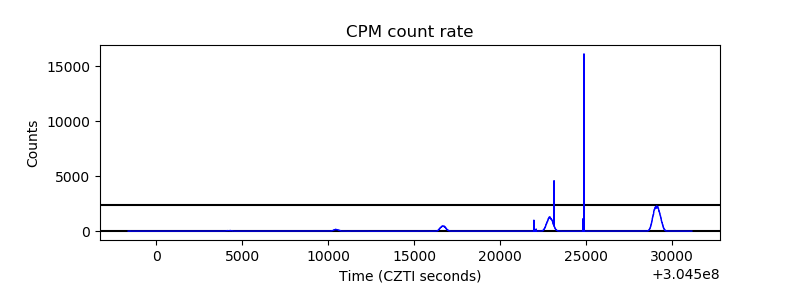 |
| CZT Counter |  |
| +2.5 Volts monitor | 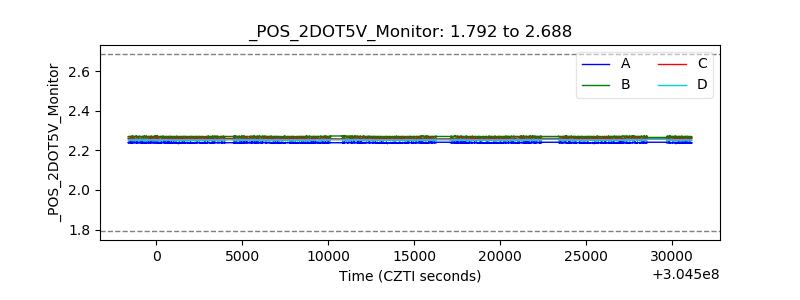 |
| +5 Volts monitor |  |
| _ROLL_ROT | 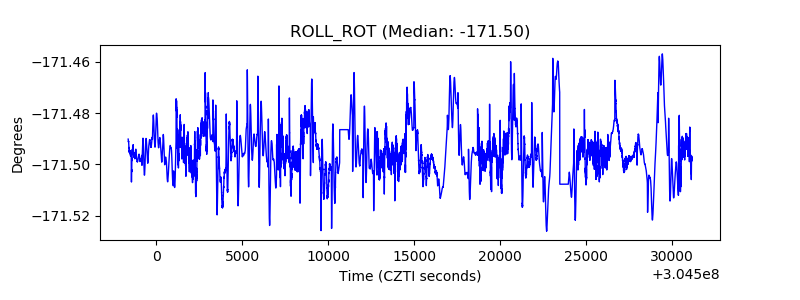 |
| _Roll_DEC | 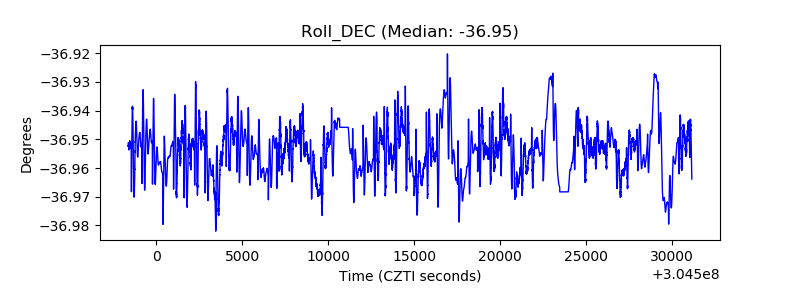 |
| _Roll_RA |  |
| Veto Counter | 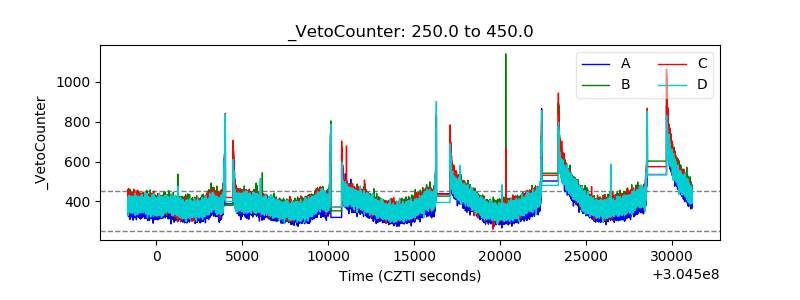 |