| Param | Original file | Final file |
|---|---|---|
| Filename | modeM0/AS1T03_136T01_9000003124_21145cztM0_level2.evt | modeM0/AS1T03_136T01_9000003124_21145cztM0_level2_quad_clean.evt |
| Size (bytes) | 539,801,280 | 97,493,760 |
| Size | 514.8 MB | 93.0 MB |
| Events in quadrant A | 3,229,857 | 658,436 |
| Events in quadrant B | 3,523,403 | 663,264 |
| Events in quadrant C | 3,196,346 | 627,057 |
| Events in quadrant D | 5,967,425 | 559,943 |
| Mode M0 | |||
|---|---|---|---|
| Quadrant | BADHDUFLAG | Total packets | Discarded packets |
| A | 0 | 13800 | 2 |
| B | 0 | 14726 | 2 |
| C | 0 | 13617 | 3 |
| D | 0 | 22091 | 2 |
| Mode SS | |||
|---|---|---|---|
| Quadrant | BADHDUFLAG | Total packets | Discarded packets |
| A | 0 | 130 | 0 |
| B | 0 | 130 | 0 |
| C | 0 | 130 | 0 |
| D | 0 | 130 | 0 |
| Mode M9 | |||
|---|---|---|---|
| Quadrant | BADHDUFLAG | Total packets | Discarded packets |
| A | 0 | 14 | 0 |
| B | 0 | 15 | 0 |
| C | 0 | 15 | 0 |
| D | 0 | 15 | 0 |
| Quadrant | Total seconds | Saturated seconds | Saturation percentage |
|---|---|---|---|
| A | 6354 | 61 | 0.960025% |
| B | 6354 | 86 | 1.353478% |
| C | 6353 | 93 | 1.463875% |
| D | 6353 | 714 | 11.238785% |
Noise dominated data is calculated using 1-second bins in cleaned event files. If a bin has >2000 counts, and if more than 50% of those come from <1% of pixels, then it is considered to be noise-dominated and hence unusable.
| Quadrant | # 1 sec bins | Bins with >0 counts | Bins with >2000 counts | High rate bins dominated by noise | Noise dominated (total time) | Noise dominated (detector-on time) | Marked lightcurve |
|---|---|---|---|---|---|---|---|
| A | 7604 | 6355 | 0 | 0 | 0.00% | 0.00% | 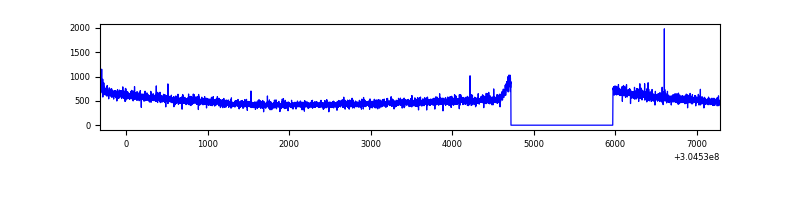 |
| B | 7604 | 6355 | 11 | 11 | 0.14% | 0.17% | 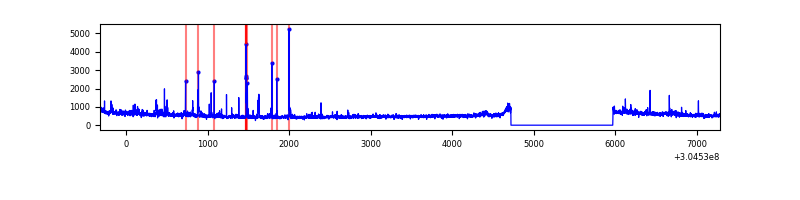 |
| C | 7603 | 6354 | 2 | 2 | 0.03% | 0.03% |  |
| D | 7603 | 6354 | 669 | 669 | 8.80% | 10.53% | 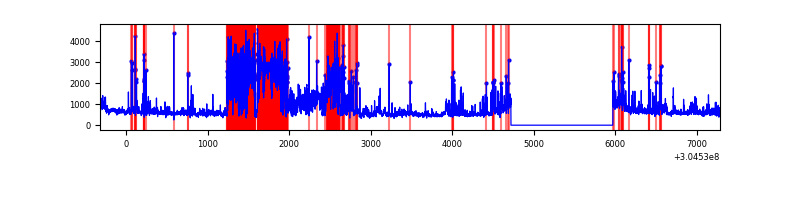 |
Top three noisy pixels from each quadrant. If the there are fewer than three noisy pixels in the level2.evt file, extra rows are filled as -1
| Pixel properties | Quadrant properties | ||||||
|---|---|---|---|---|---|---|---|
| Quadrant | DetID | PixID | Counts | Sigma | Mean | Median | Sigma |
| A | 8 | 6 | 11035 | 61.1 | 833 | 819 | 167.2 |
| A | 13 | 254 | 8607 | 46.58 | 833 | 819 | 167.2 |
| A | 0 | 226 | 7458 | 39.71 | 833 | 819 | 167.2 |
| B | 0 | 230 | 59375 | 379.73 | 827 | 810 | 154.2 |
| B | 0 | 228 | 53052 | 338.73 | 827 | 810 | 154.2 |
| B | 3 | 64 | 52221 | 333.34 | 827 | 810 | 154.2 |
| C | 14 | 238 | 123820 | 681.22 | 780 | 787 | 180.6 |
| C | 0 | 10 | 25703 | 137.96 | 780 | 787 | 180.6 |
| C | 13 | 61 | 5654 | 26.95 | 780 | 787 | 180.6 |
| D | 1 | 52 | 2268736 | 12241.15 | 761 | 737 | 185.3 |
| D | 9 | 65 | 226905 | 1220.7 | 761 | 737 | 185.3 |
| D | 5 | 222 | 153567 | 824.87 | 761 | 737 | 185.3 |
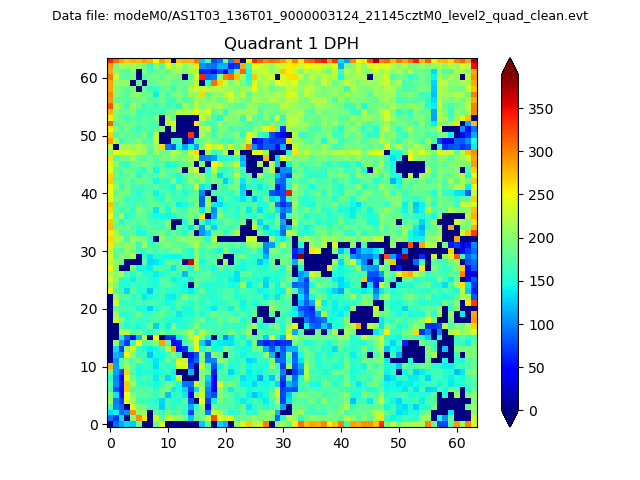
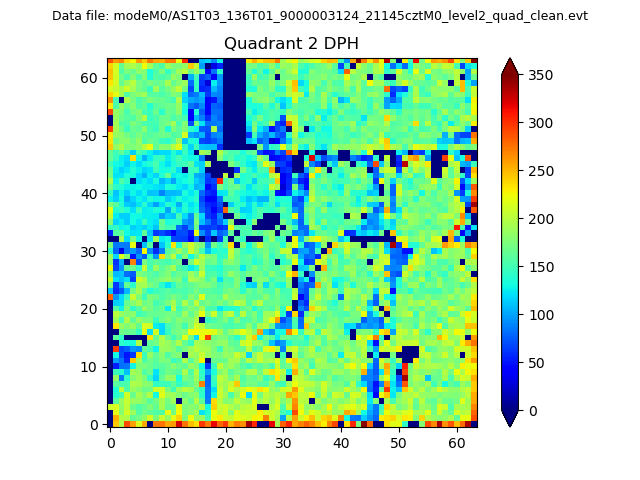
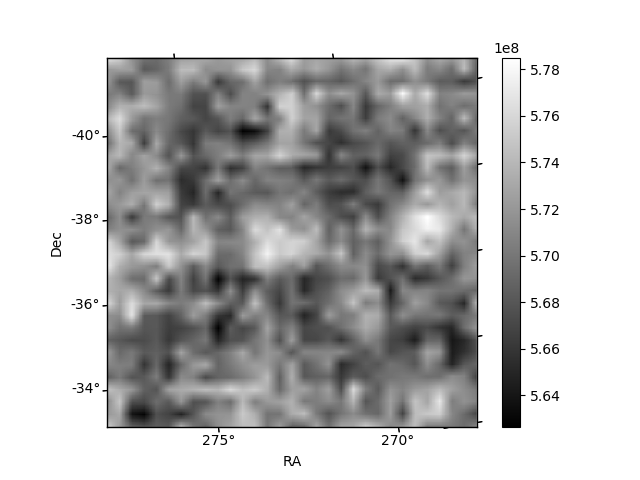
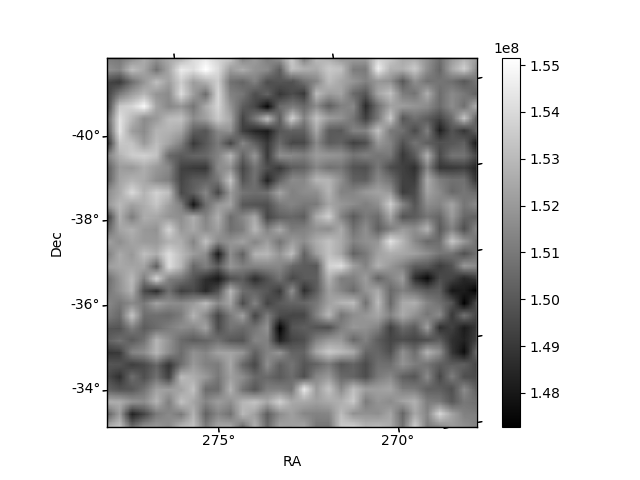
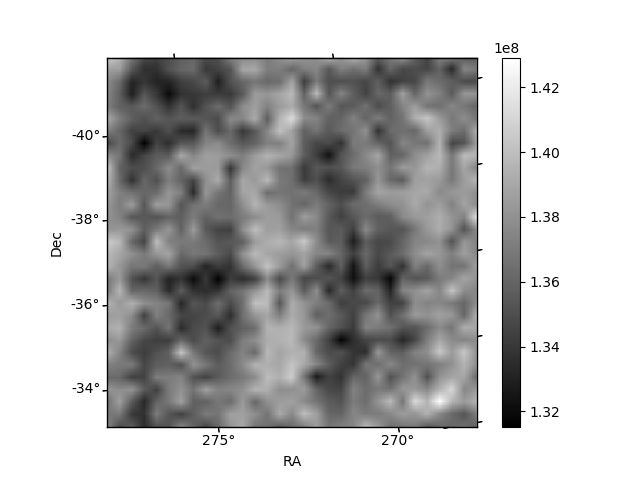
Histogram calculated using DETX and DETY for each event in the final _common_clean file
| Quadrant A | 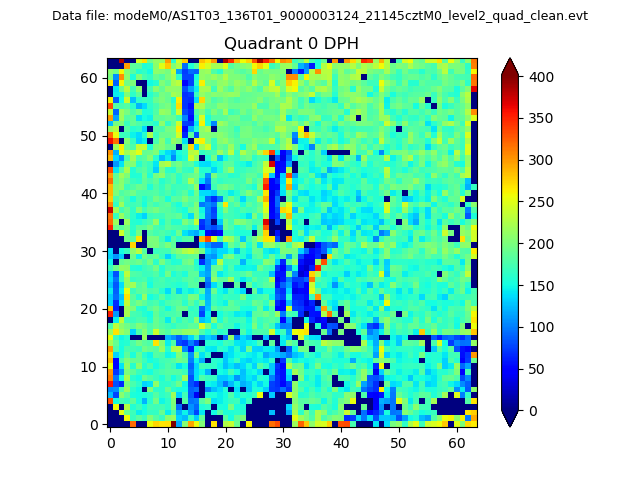 |
 |
Quadrant B |
|---|---|---|---|
| Quadrant D | 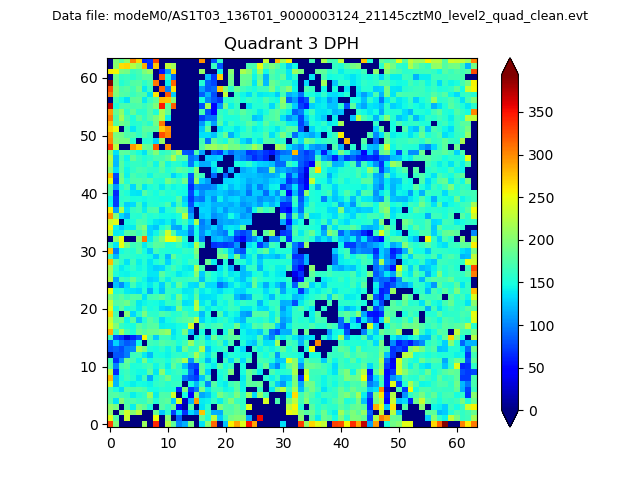 |
 |
Quadrant C |
| Plot type | Count rate plots | Images |
|---|---|---|
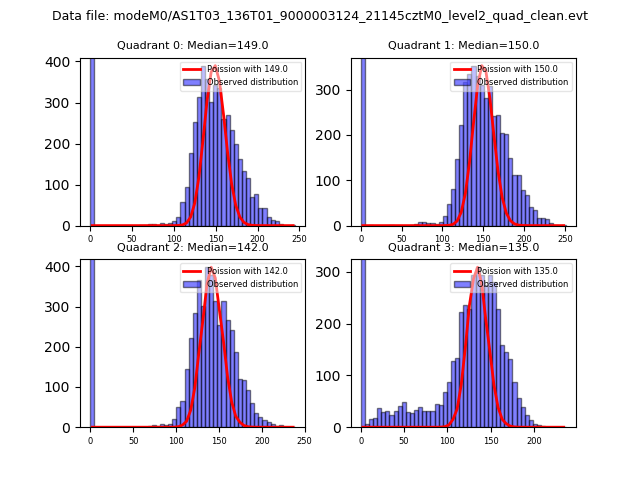
| Comparison with Poisson distribution Blue bars denote a histogram of data divided into 1 sec bins. Red curve is a Poisson curve with rate = median count rate of data. |
 |
 |
| Quadrant-wise count rates Data is divided into 100 sec bins |
 |
|
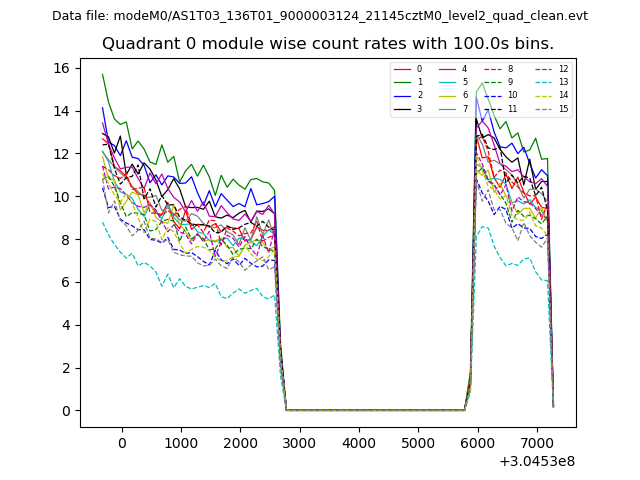
| Module-wise count rates for Quadrant A Data is divided into 100 sec bins |
 |
 |
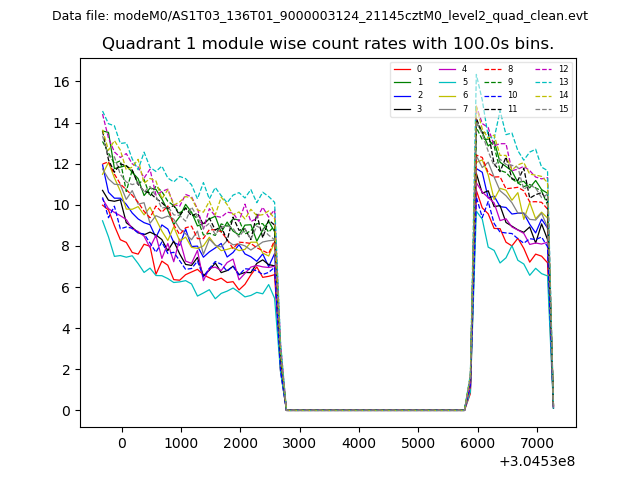
| Module-wise count rates for Quadrant B Data is divided into 100 sec bins |
 |
 |
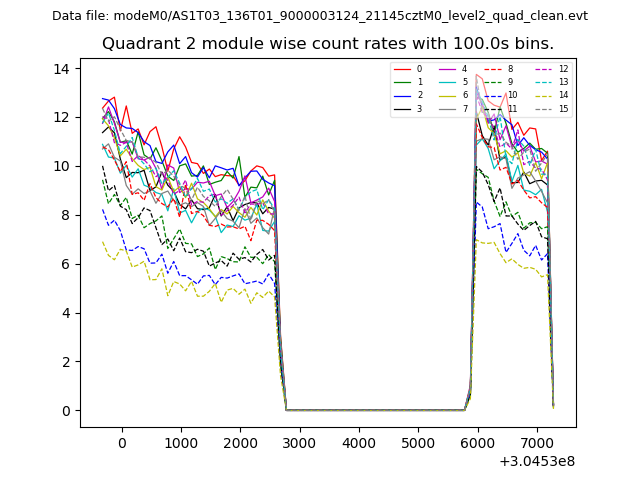
| Module-wise count rates for Quadrant C Data is divided into 100 sec bins |
 |
 |
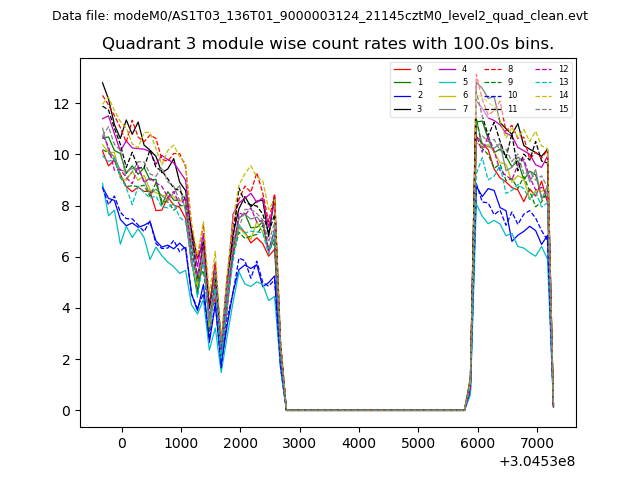
| Module-wise count rates for Quadrant D Data is divided into 100 sec bins |
 |
 |
| Parameter | Plot |
|---|---|
| CZT HV Monitor | 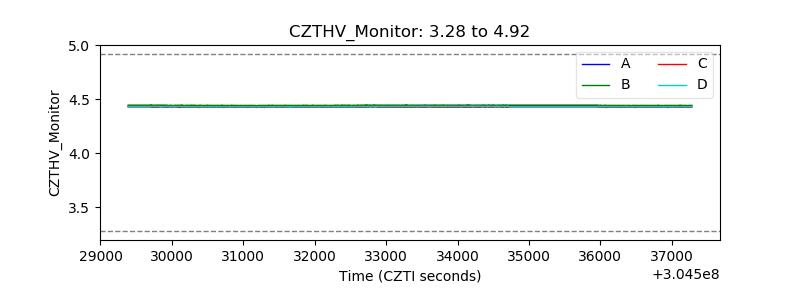 |
| D_VDD | 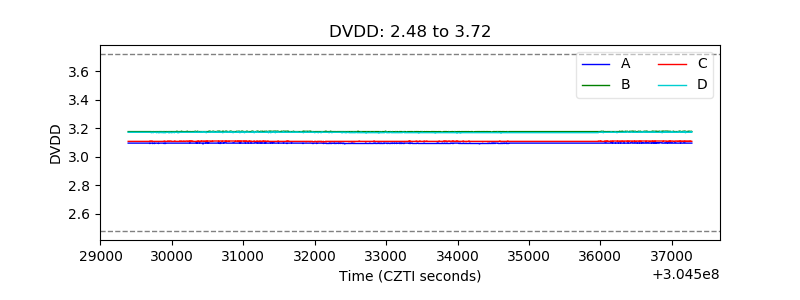 |
| Temperature 1 | 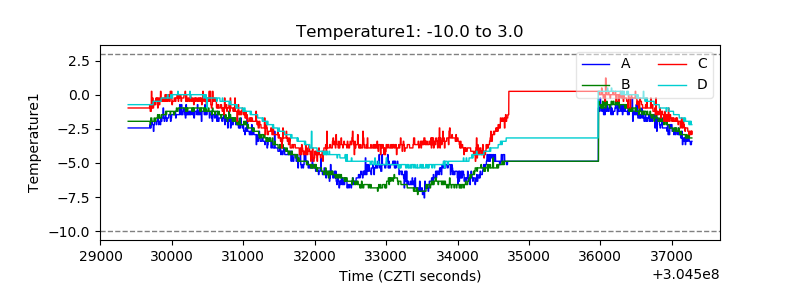 |
| Veto HV Monitor | 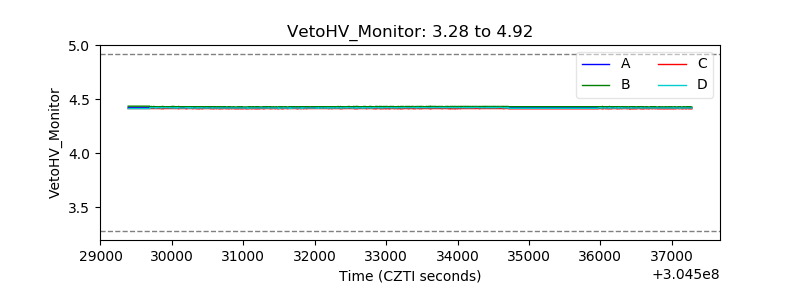 |
| Veto LLD |  |
| Alpha Counter | 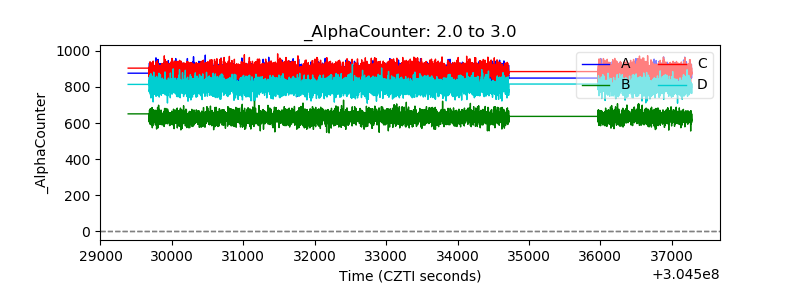 |
| _CPM_Rate | 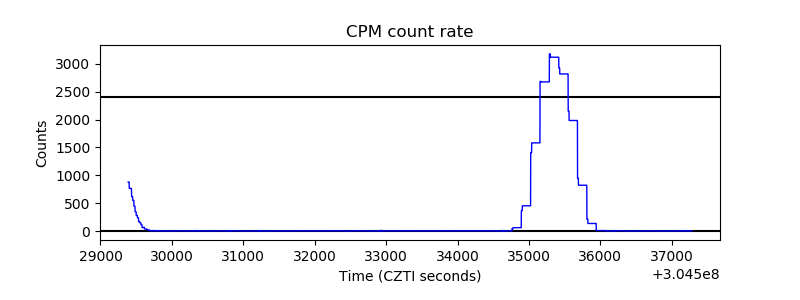 |
| CZT Counter | 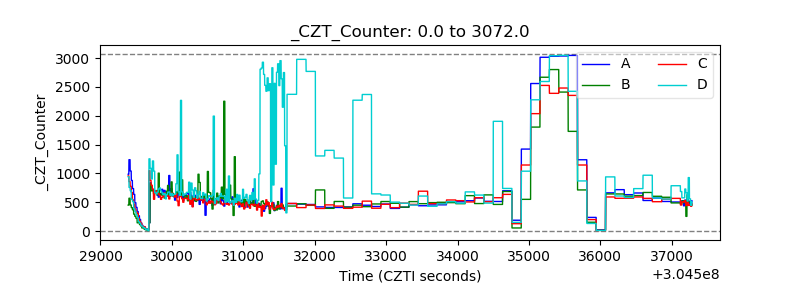 |
| +2.5 Volts monitor |  |
| +5 Volts monitor |  |
| _ROLL_ROT | 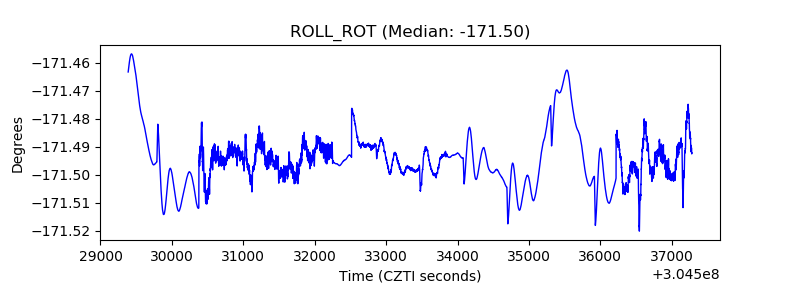 |
| _Roll_DEC | 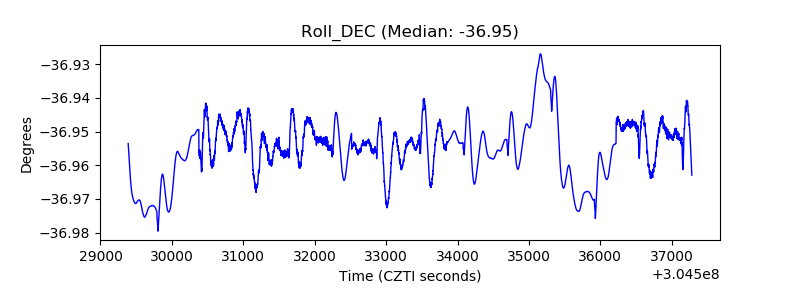 |
| _Roll_RA | 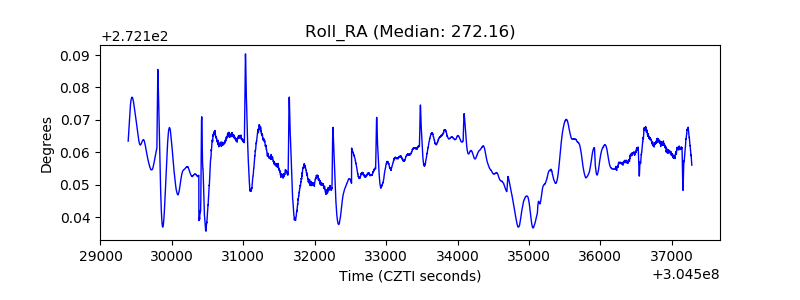 |
| Veto Counter | 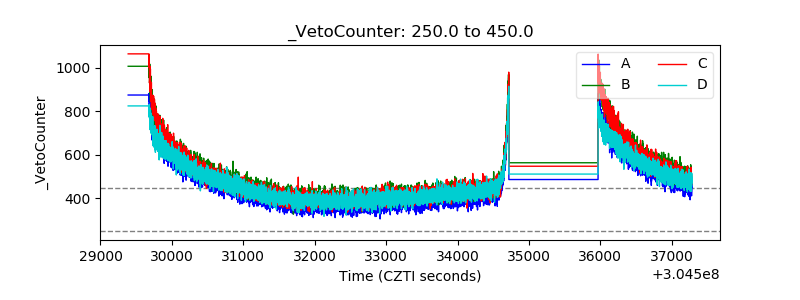 |