| Param | Original file | Final file |
|---|---|---|
| Filename | modeM0/AS1T03_136T01_9000003124_21146cztM0_level2.evt | modeM0/AS1T03_136T01_9000003124_21146cztM0_level2_quad_clean.evt |
| Size (bytes) | 488,848,320 | 95,486,400 |
| Size | 466.2 MB | 91.1 MB |
| Events in quadrant A | 3,459,082 | 630,995 |
| Events in quadrant B | 3,395,345 | 647,996 |
| Events in quadrant C | 3,210,485 | 608,217 |
| Events in quadrant D | 4,323,049 | 575,473 |
| Mode M0 | |||
|---|---|---|---|
| Quadrant | BADHDUFLAG | Total packets | Discarded packets |
| A | 0 | 14201 | 3 |
| B | 0 | 14029 | 2 |
| C | 0 | 13438 | 2 |
| D | 0 | 16923 | 2 |
| Mode SS | |||
|---|---|---|---|
| Quadrant | BADHDUFLAG | Total packets | Discarded packets |
| A | 0 | 124 | 0 |
| B | 0 | 124 | 0 |
| C | 0 | 124 | 0 |
| D | 0 | 124 | 0 |
| Mode M9 | |||
|---|---|---|---|
| Quadrant | BADHDUFLAG | Total packets | Discarded packets |
| A | 0 | 17 | 0 |
| B | 0 | 18 | 0 |
| C | 0 | 18 | 0 |
| D | 0 | 18 | 0 |
| Quadrant | Total seconds | Saturated seconds | Saturation percentage |
|---|---|---|---|
| A | 6148 | 125 | 2.033182% |
| B | 6148 | 73 | 1.187378% |
| C | 6148 | 88 | 1.431360% |
| D | 6148 | 188 | 3.057905% |
Noise dominated data is calculated using 1-second bins in cleaned event files. If a bin has >2000 counts, and if more than 50% of those come from <1% of pixels, then it is considered to be noise-dominated and hence unusable.
| Quadrant | # 1 sec bins | Bins with >0 counts | Bins with >2000 counts | High rate bins dominated by noise | Noise dominated (total time) | Noise dominated (detector-on time) | Marked lightcurve |
|---|---|---|---|---|---|---|---|
| A | 7468 | 6149 | 53 | 53 | 0.71% | 0.86% | 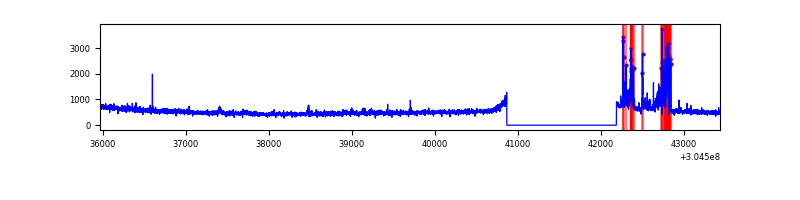 |
| B | 7468 | 6149 | 2 | 2 | 0.03% | 0.03% | 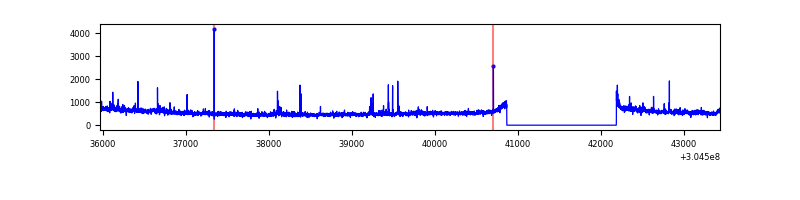 |
| C | 7468 | 6149 | 6 | 6 | 0.08% | 0.10% | 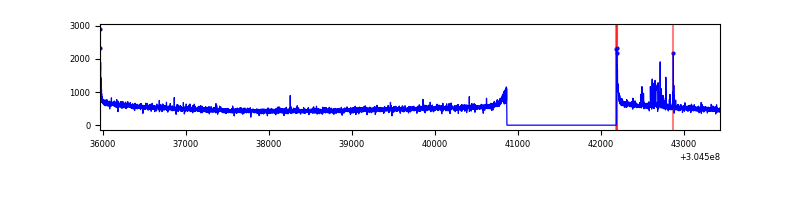 |
| D | 7468 | 6149 | 124 | 124 | 1.66% | 2.02% | 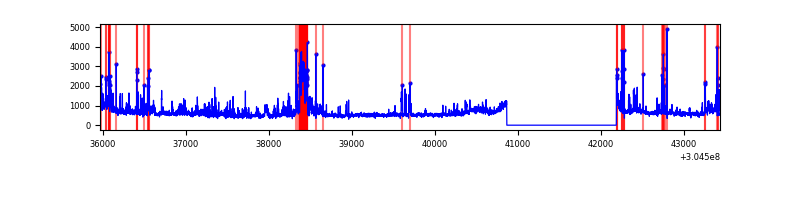 |
Top three noisy pixels from each quadrant. If the there are fewer than three noisy pixels in the level2.evt file, extra rows are filled as -1
| Pixel properties | Quadrant properties | ||||||
|---|---|---|---|---|---|---|---|
| Quadrant | DetID | PixID | Counts | Sigma | Mean | Median | Sigma |
| A | 15 | 236 | 276695 | 1690.09 | 814 | 798 | 163.2 |
| A | 15 | 192 | 31602 | 188.7 | 814 | 798 | 163.2 |
| A | 8 | 6 | 10617 | 60.15 | 814 | 798 | 163.2 |
| B | 3 | 64 | 38179 | 246.83 | 816 | 799 | 151.4 |
| B | 0 | 230 | 36629 | 236.6 | 816 | 799 | 151.4 |
| B | 0 | 190 | 24928 | 159.33 | 816 | 799 | 151.4 |
| C | 14 | 238 | 122430 | 682.09 | 768 | 774 | 178.4 |
| C | 3 | 233 | 48217 | 266.0 | 768 | 774 | 178.4 |
| C | 0 | 10 | 41762 | 229.8 | 768 | 774 | 178.4 |
| D | 1 | 52 | 329712 | 1760.23 | 771 | 748 | 186.9 |
| D | 7 | 238 | 285347 | 1522.84 | 771 | 748 | 186.9 |
| D | 7 | 223 | 194349 | 1035.93 | 771 | 748 | 186.9 |
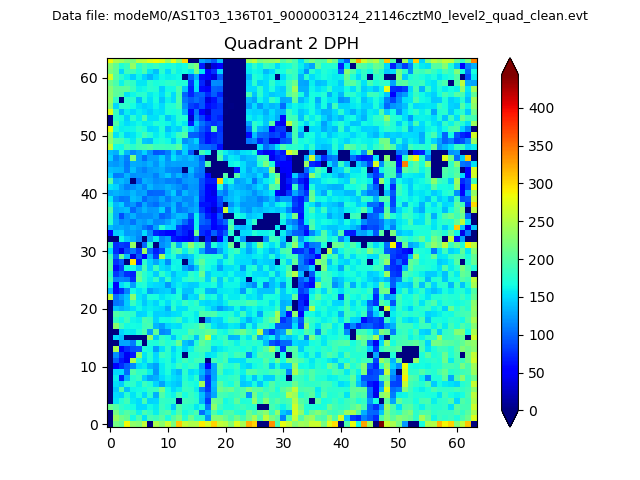
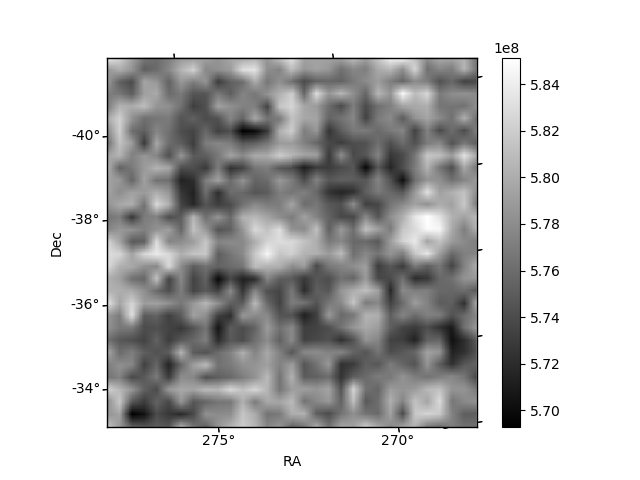
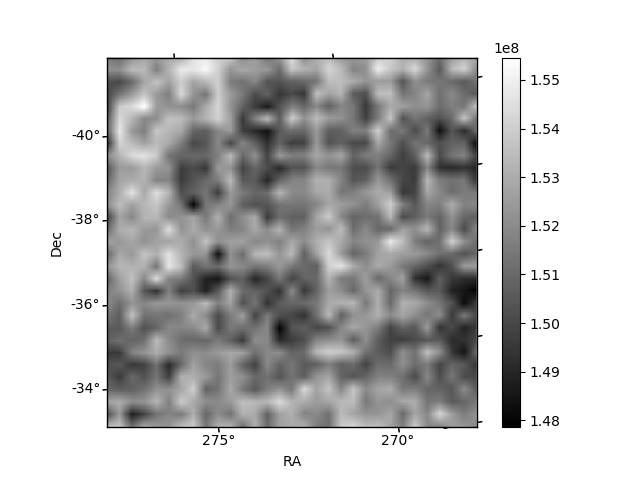
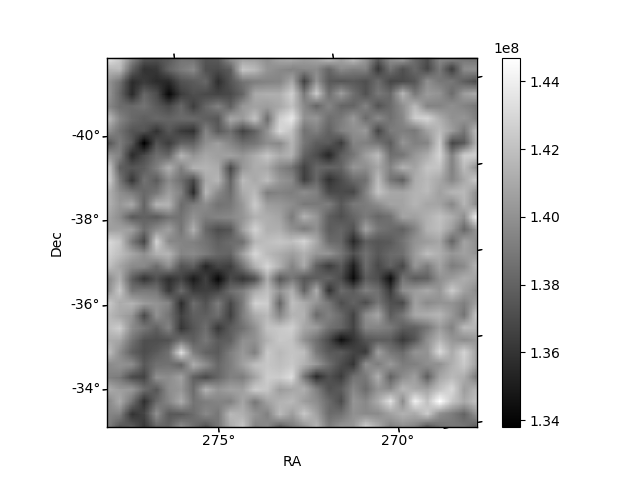
Histogram calculated using DETX and DETY for each event in the final _common_clean file
| Quadrant A | 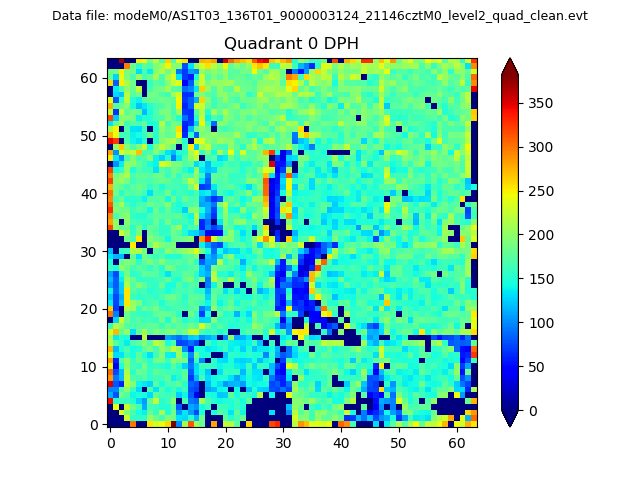 |
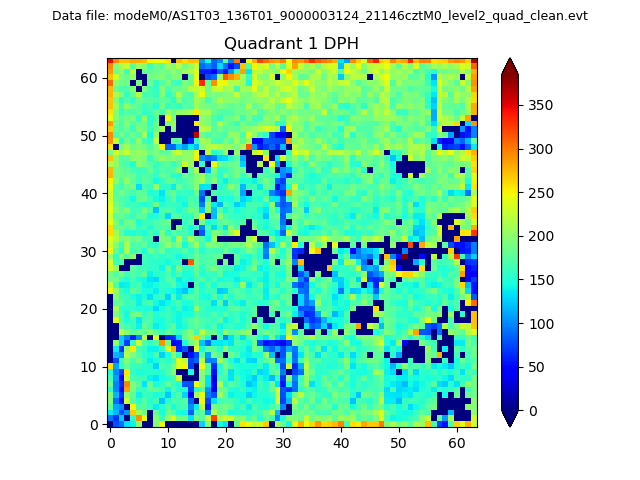 |
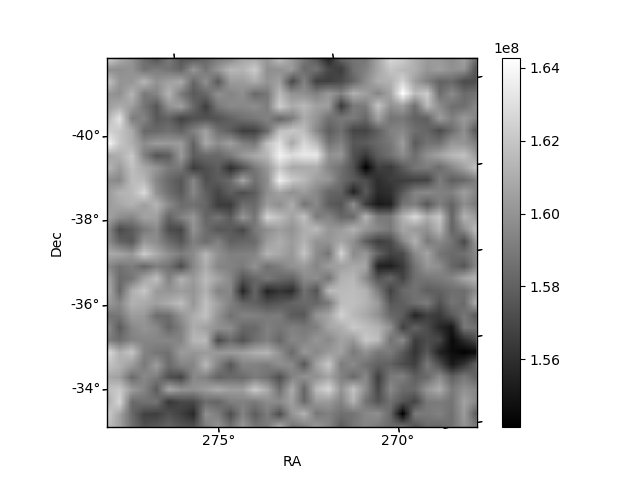
Quadrant B |
|---|---|---|---|
| Quadrant D | 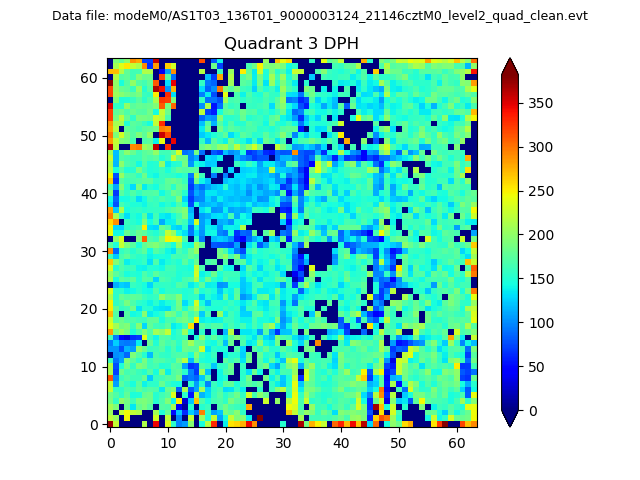 |
 |
Quadrant C |
| Plot type | Count rate plots | Images |
|---|---|---|
| Comparison with Poisson distribution Blue bars denote a histogram of data divided into 1 sec bins. Red curve is a Poisson curve with rate = median count rate of data. |
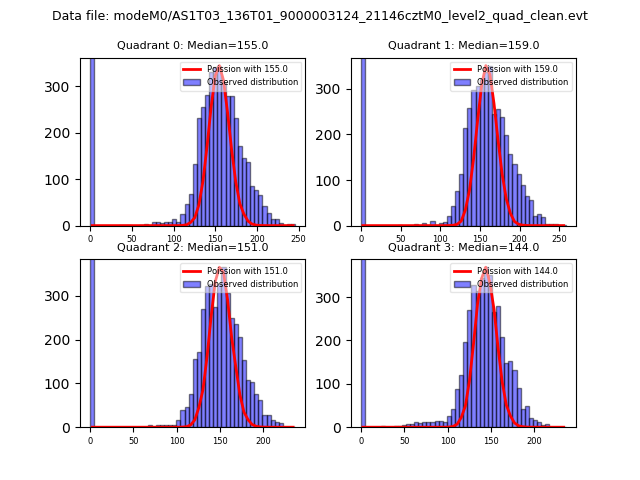 |
 |
| Quadrant-wise count rates Data is divided into 100 sec bins |
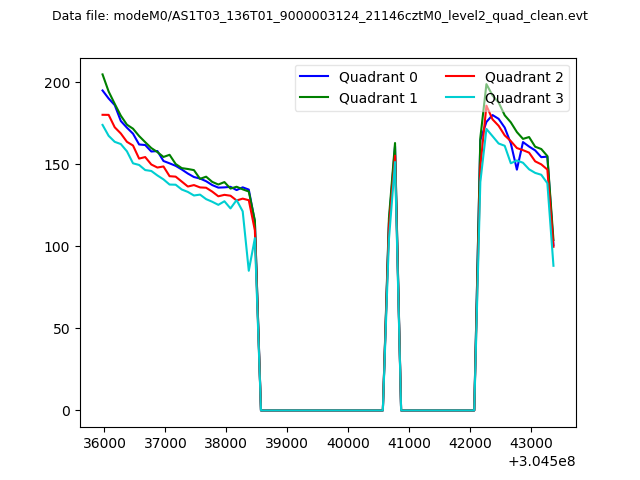 |
|
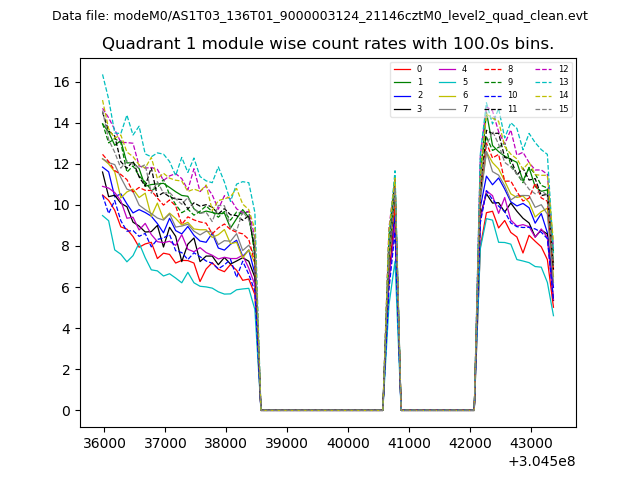
| Module-wise count rates for Quadrant A Data is divided into 100 sec bins |
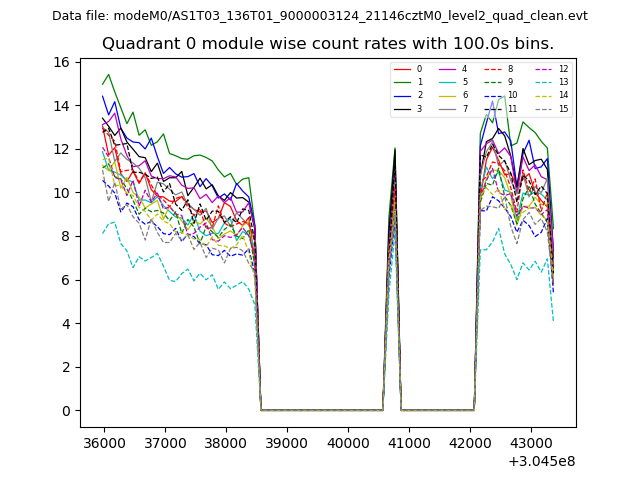 |
 |
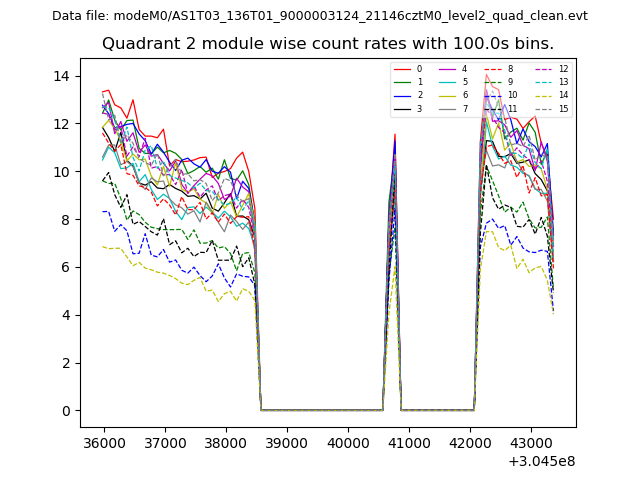
| Module-wise count rates for Quadrant B Data is divided into 100 sec bins |
 |
 |
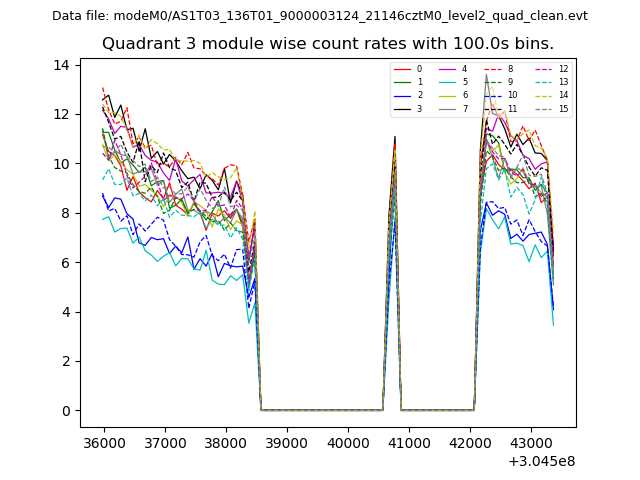
| Module-wise count rates for Quadrant C Data is divided into 100 sec bins |
 |
 |
| Module-wise count rates for Quadrant D Data is divided into 100 sec bins |
 |
 |
| Parameter | Plot |
|---|---|
| CZT HV Monitor | 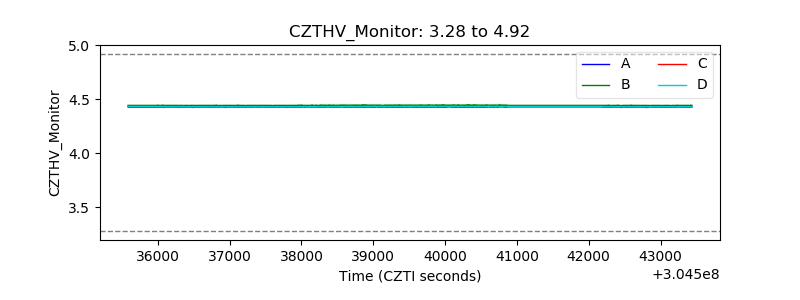 |
| D_VDD | 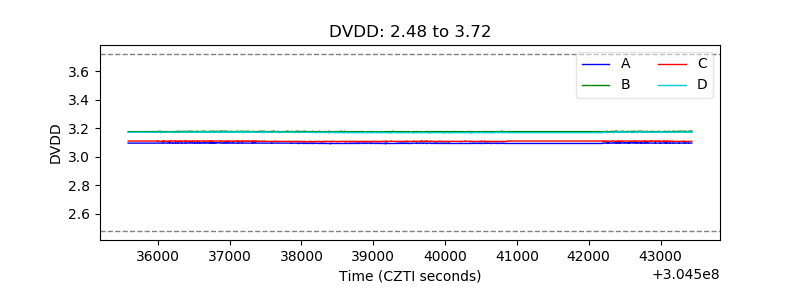 |
| Temperature 1 |  |
| Veto HV Monitor | 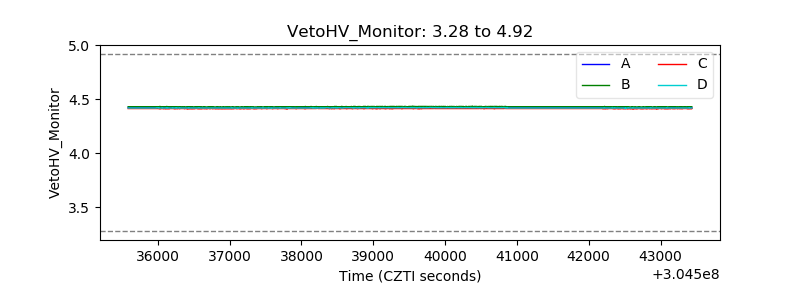 |
| Veto LLD | 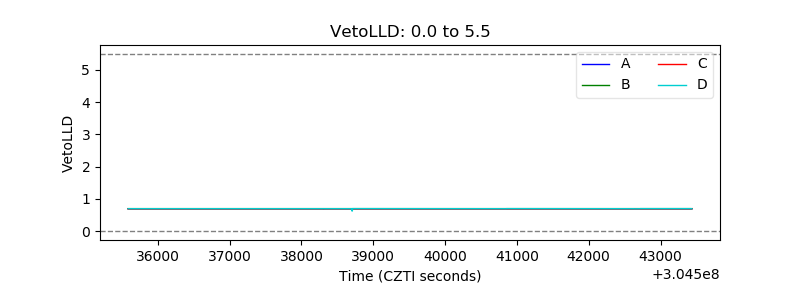 |
| Alpha Counter | 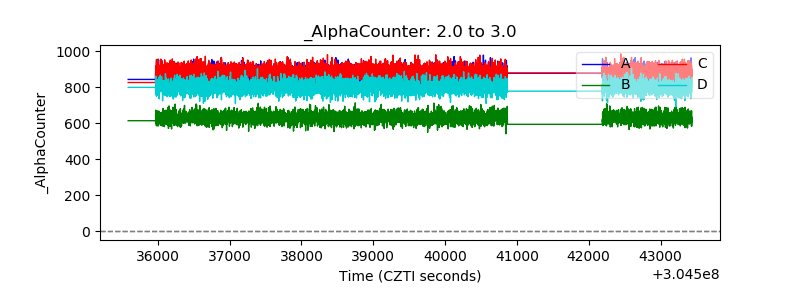 |
| _CPM_Rate | 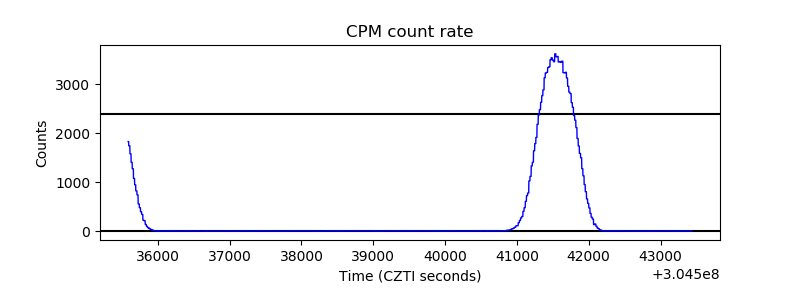 |
| CZT Counter | 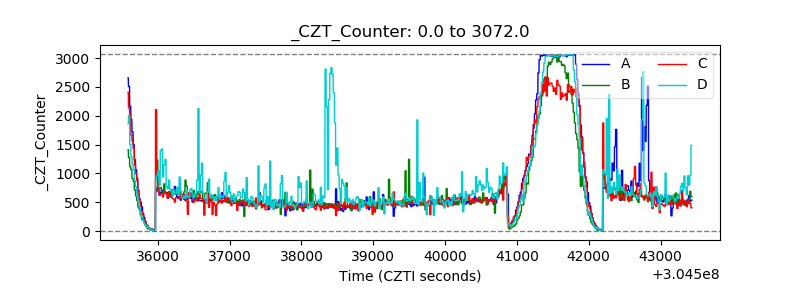 |
| +2.5 Volts monitor |  |
| +5 Volts monitor |  |
| _ROLL_ROT | 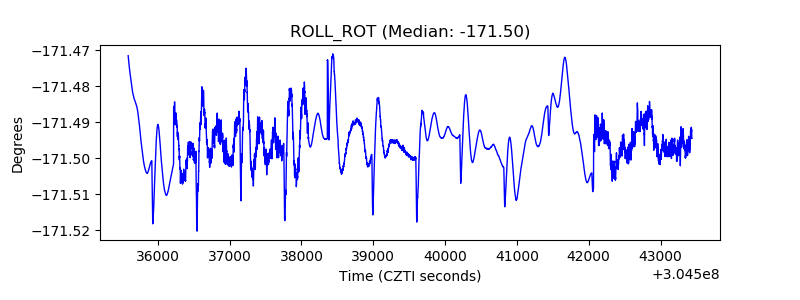 |
| _Roll_DEC | 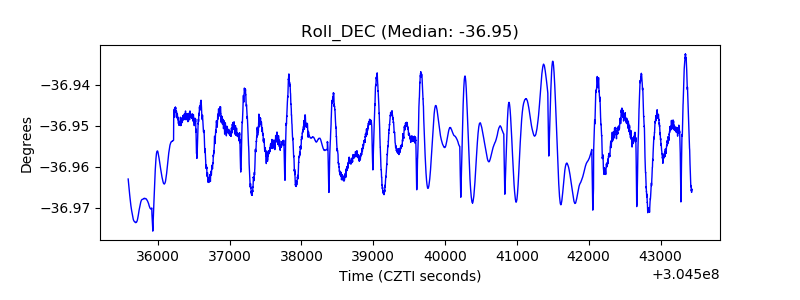 |
| _Roll_RA | 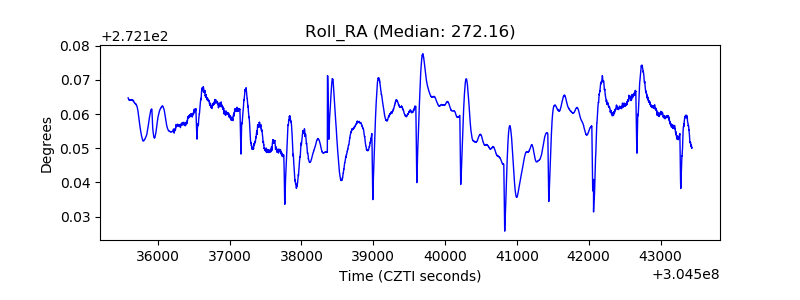 |
| Veto Counter | 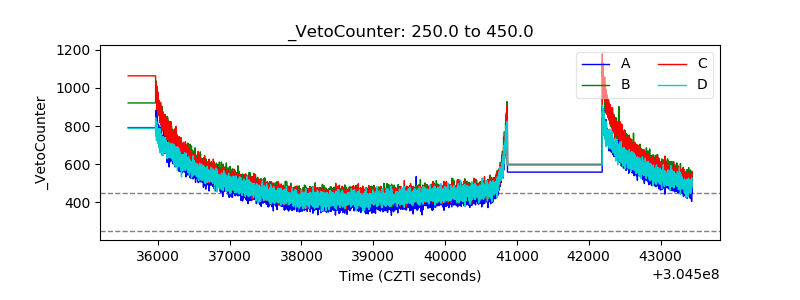 |