| Param | Original file | Final file |
|---|---|---|
| Filename | modeM0/AS1T03_136T01_9000003124_21147cztM0_level2.evt | modeM0/AS1T03_136T01_9000003124_21147cztM0_level2_quad_clean.evt |
| Size (bytes) | 504,728,640 | 93,798,720 |
| Size | 481.3 MB | 89.5 MB |
| Events in quadrant A | 3,370,773 | 618,544 |
| Events in quadrant B | 3,320,630 | 641,908 |
| Events in quadrant C | 3,213,556 | 605,938 |
| Events in quadrant D | 4,969,647 | 550,441 |
| Mode M0 | |||
|---|---|---|---|
| Quadrant | BADHDUFLAG | Total packets | Discarded packets |
| A | 0 | 13814 | 2 |
| B | 0 | 13631 | 2 |
| C | 0 | 13272 | 2 |
| D | 0 | 18818 | 2 |
| Mode SS | |||
|---|---|---|---|
| Quadrant | BADHDUFLAG | Total packets | Discarded packets |
| A | 0 | 122 | 0 |
| B | 0 | 122 | 0 |
| C | 0 | 122 | 0 |
| D | 0 | 122 | 0 |
| Mode M9 | |||
|---|---|---|---|
| Quadrant | BADHDUFLAG | Total packets | Discarded packets |
| A | 0 | 17 | 0 |
| B | 0 | 18 | 0 |
| C | 0 | 18 | 0 |
| D | 0 | 18 | 0 |
| Quadrant | Total seconds | Saturated seconds | Saturation percentage |
|---|---|---|---|
| A | 6069 | 104 | 1.713627% |
| B | 6069 | 57 | 0.939199% |
| C | 6069 | 93 | 1.532378% |
| D | 6069 | 359 | 5.915307% |
Noise dominated data is calculated using 1-second bins in cleaned event files. If a bin has >2000 counts, and if more than 50% of those come from <1% of pixels, then it is considered to be noise-dominated and hence unusable.
| Quadrant | # 1 sec bins | Bins with >0 counts | Bins with >2000 counts | High rate bins dominated by noise | Noise dominated (total time) | Noise dominated (detector-on time) | Marked lightcurve |
|---|---|---|---|---|---|---|---|
| A | 7449 | 6070 | 53 | 53 | 0.71% | 0.87% | 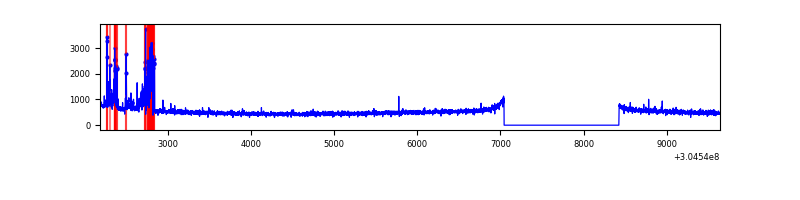 |
| B | 7449 | 6070 | 1 | 1 | 0.01% | 0.02% | 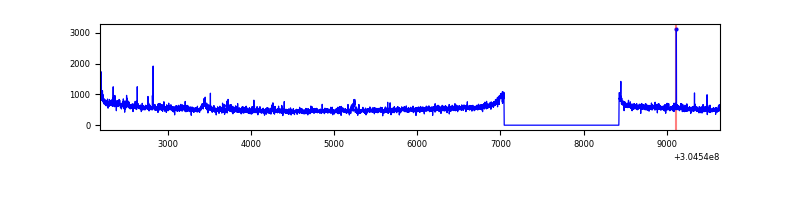 |
| C | 7449 | 6070 | 16 | 16 | 0.21% | 0.26% | 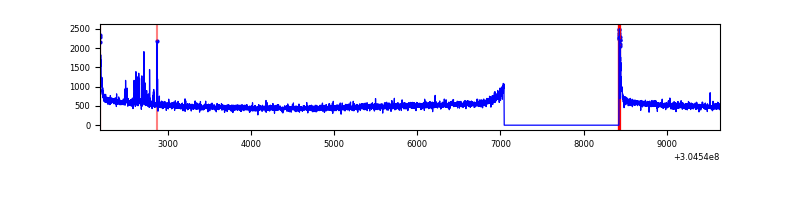 |
| D | 7449 | 6070 | 364 | 364 | 4.89% | 6.00% | 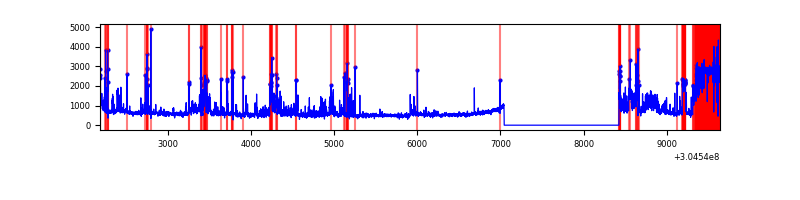 |
Top three noisy pixels from each quadrant. If the there are fewer than three noisy pixels in the level2.evt file, extra rows are filled as -1
| Pixel properties | Quadrant properties | ||||||
|---|---|---|---|---|---|---|---|
| Quadrant | DetID | PixID | Counts | Sigma | Mean | Median | Sigma |
| A | 15 | 236 | 276578 | 1729.6 | 799 | 785 | 159.5 |
| A | 13 | 254 | 9356 | 53.75 | 799 | 785 | 159.5 |
| A | 15 | 192 | 9086 | 52.06 | 799 | 785 | 159.5 |
| B | 0 | 189 | 40995 | 265.57 | 809 | 791 | 151.4 |
| B | 0 | 230 | 36922 | 238.67 | 809 | 791 | 151.4 |
| B | 12 | 111 | 16873 | 106.23 | 809 | 791 | 151.4 |
| C | 14 | 238 | 123157 | 693.94 | 761 | 767 | 176.4 |
| C | 0 | 10 | 65328 | 366.05 | 761 | 767 | 176.4 |
| C | 3 | 233 | 51168 | 285.77 | 761 | 767 | 176.4 |
| D | 7 | 238 | 1056479 | 5772.34 | 746 | 727 | 182.9 |
| D | 1 | 52 | 349463 | 1906.72 | 746 | 727 | 182.9 |
| D | 9 | 65 | 252379 | 1375.91 | 746 | 727 | 182.9 |
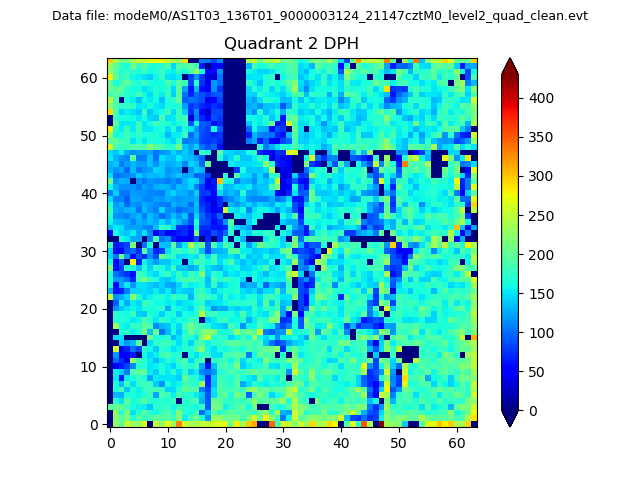
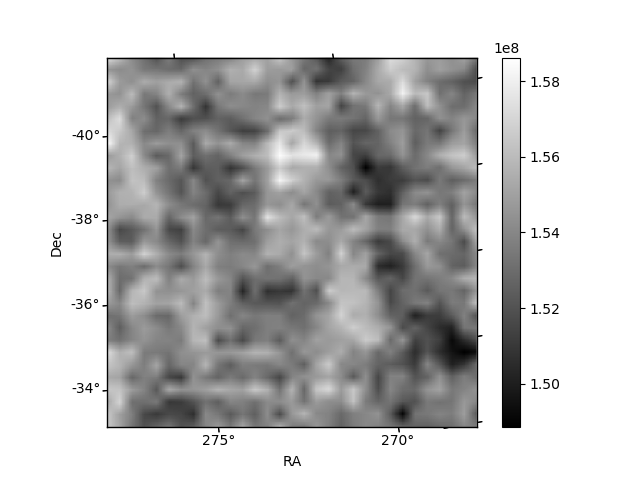
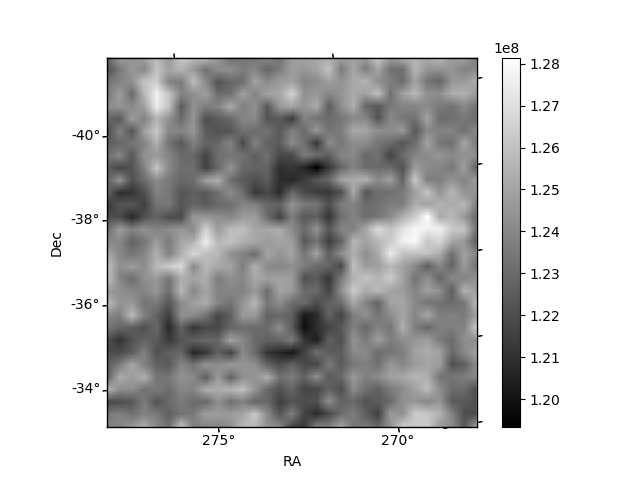
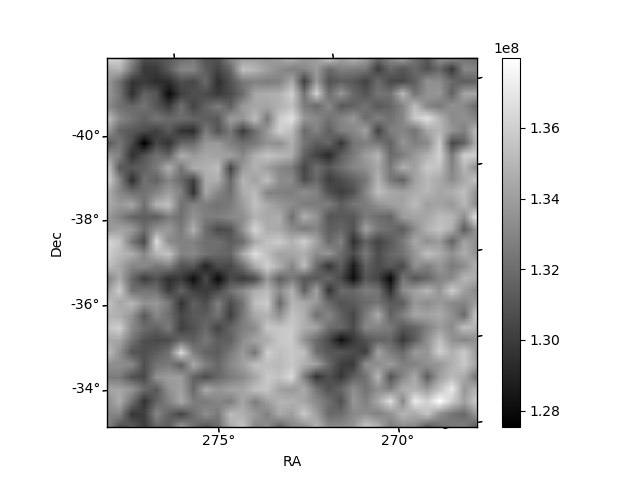
Histogram calculated using DETX and DETY for each event in the final _common_clean file
| Quadrant A | 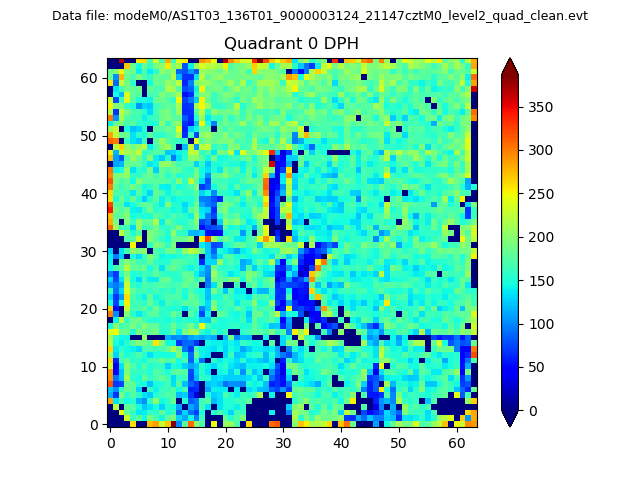 |
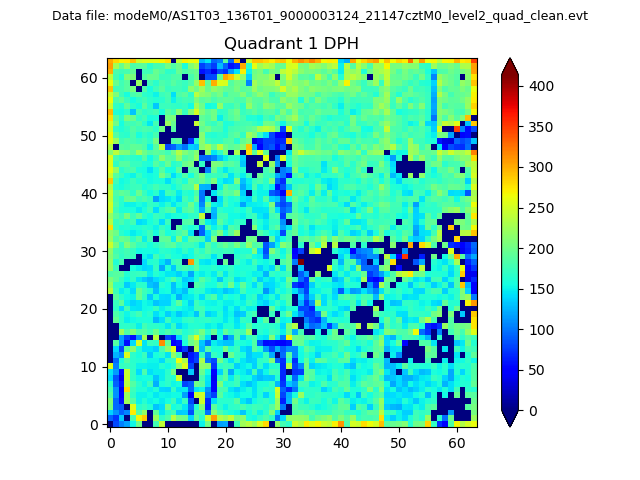 |
Quadrant B |
|---|---|---|---|
| Quadrant D | 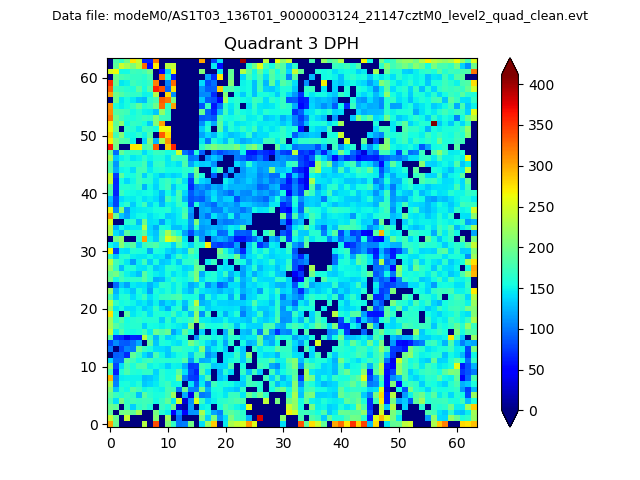 |
 |
Quadrant C |
| Plot type | Count rate plots | Images |
|---|---|---|
| Comparison with Poisson distribution Blue bars denote a histogram of data divided into 1 sec bins. Red curve is a Poisson curve with rate = median count rate of data. |
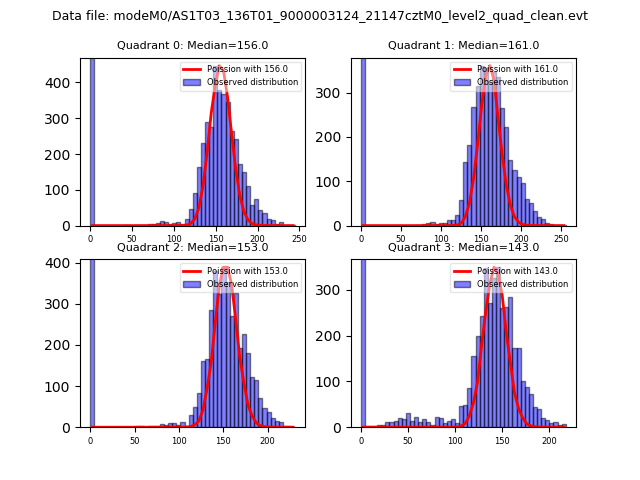 |
 |
| Quadrant-wise count rates Data is divided into 100 sec bins |
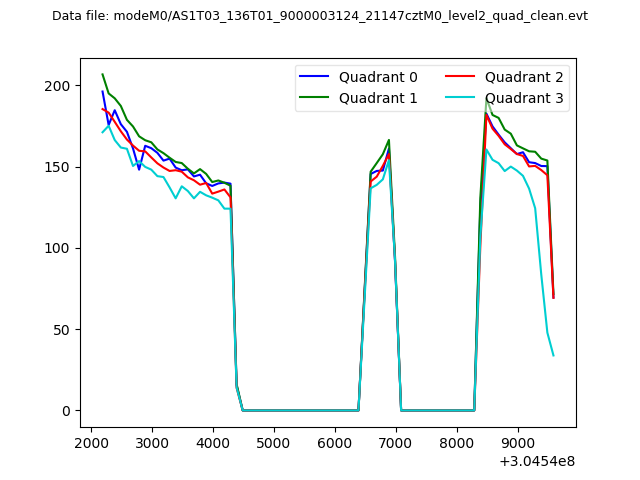 |
|
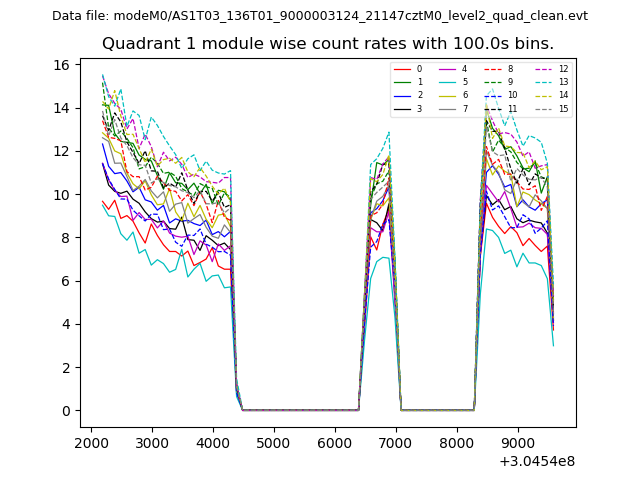
| Module-wise count rates for Quadrant A Data is divided into 100 sec bins |
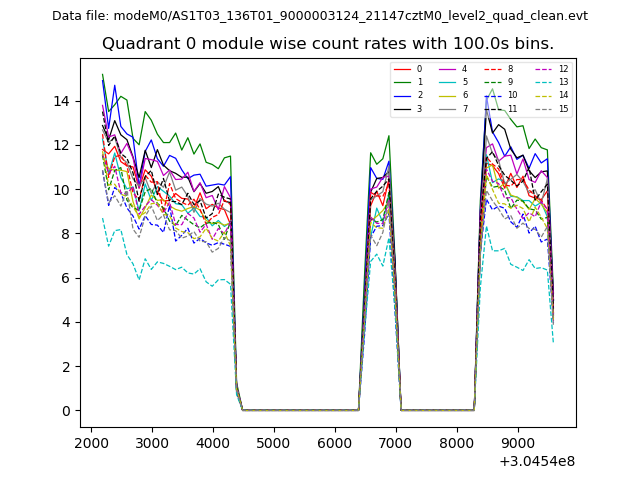 |
 |
| Module-wise count rates for Quadrant B Data is divided into 100 sec bins |
 |
 |
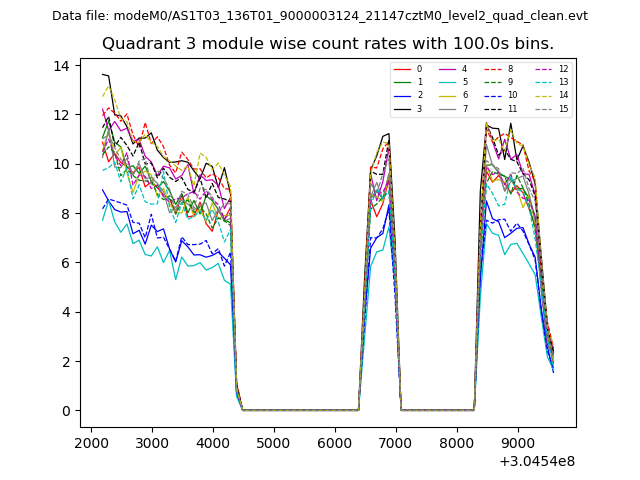
| Module-wise count rates for Quadrant C Data is divided into 100 sec bins |
 |
 |
| Module-wise count rates for Quadrant D Data is divided into 100 sec bins |
 |
 |
| Parameter | Plot |
|---|---|
| CZT HV Monitor | 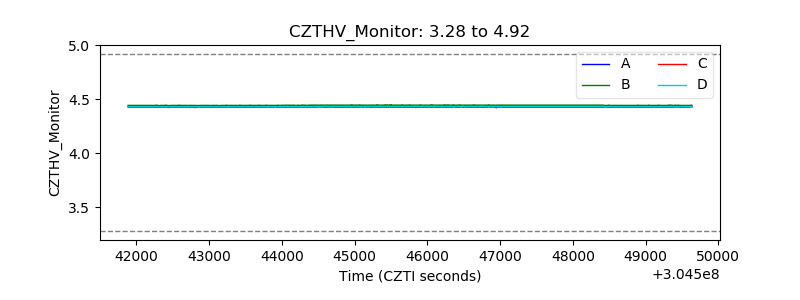 |
| D_VDD | 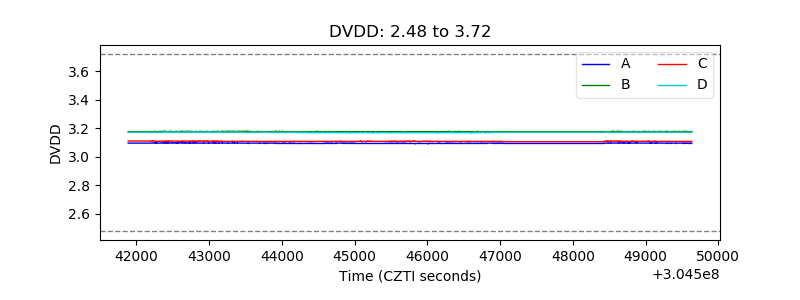 |
| Temperature 1 | 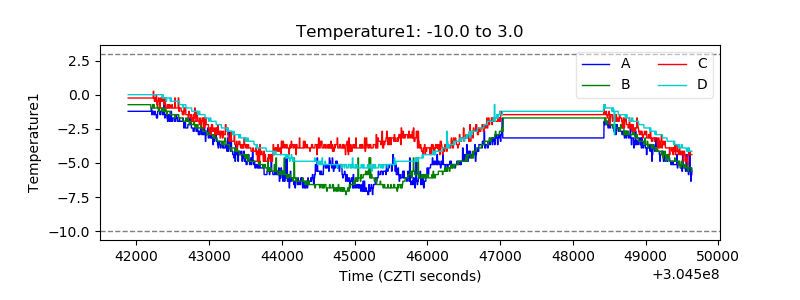 |
| Veto HV Monitor | 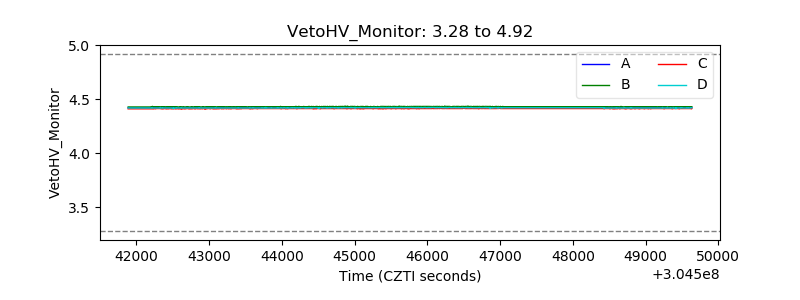 |
| Veto LLD | 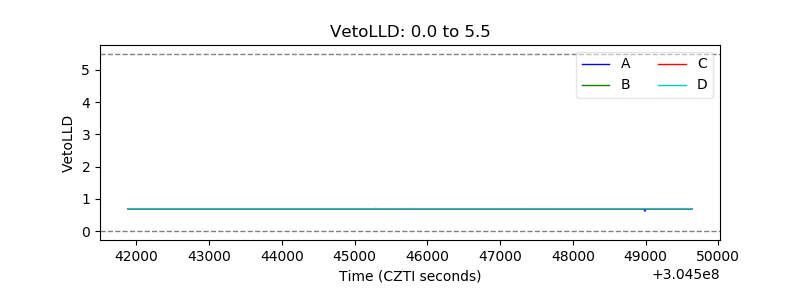 |
| Alpha Counter | 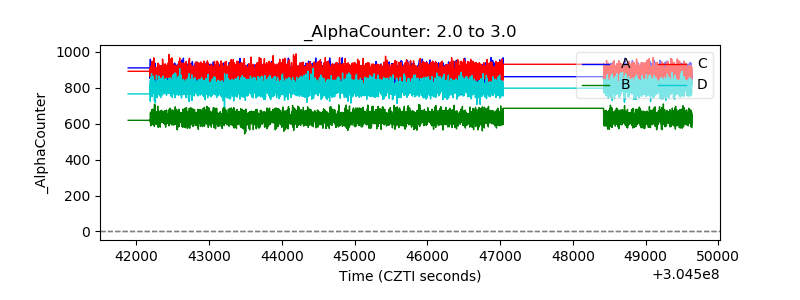 |
| _CPM_Rate | 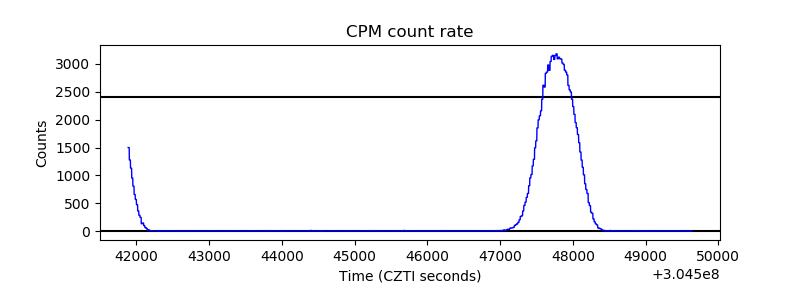 |
| CZT Counter | 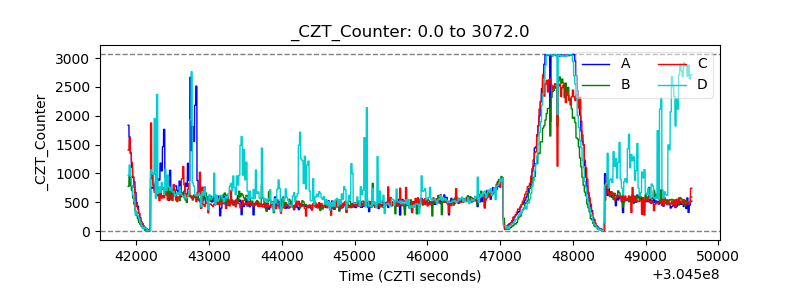 |
| +2.5 Volts monitor |  |
| +5 Volts monitor |  |
| _ROLL_ROT | 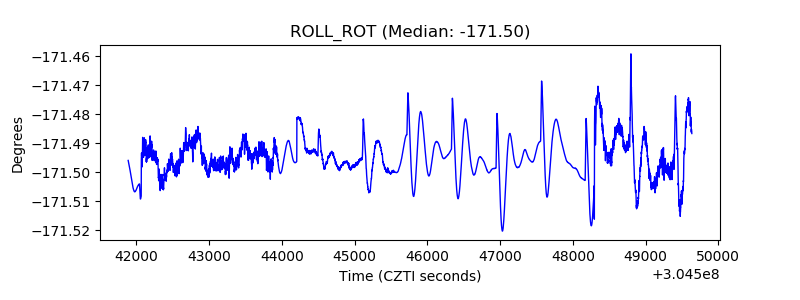 |
| _Roll_DEC | 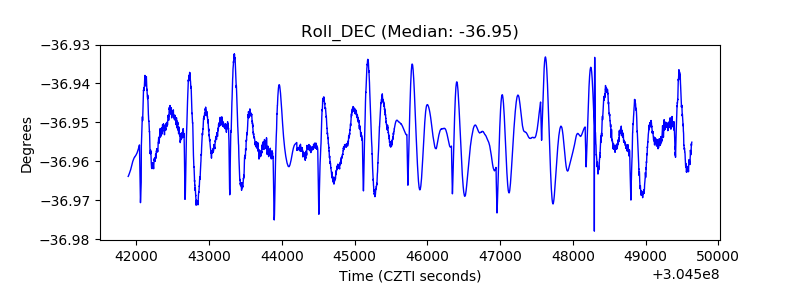 |
| _Roll_RA |  |
| Veto Counter | 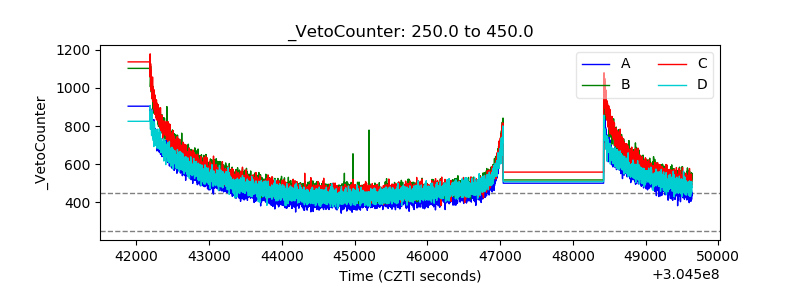 |