| Param | Original file | Final file |
|---|---|---|
| Filename | modeM0/AS1T03_136T01_9000003124_21149cztM0_level2.evt | modeM0/AS1T03_136T01_9000003124_21149cztM0_level2_quad_clean.evt |
| Size (bytes) | 425,822,400 | 74,528,640 |
| Size | 406.1 MB | 71.1 MB |
| Events in quadrant A | 2,705,608 | 473,635 |
| Events in quadrant B | 2,855,094 | 488,593 |
| Events in quadrant C | 2,785,577 | 466,322 |
| Events in quadrant D | 4,166,331 | 433,573 |
| Mode M0 | |||
|---|---|---|---|
| Quadrant | BADHDUFLAG | Total packets | Discarded packets |
| A | 0 | 12847 | 1250 |
| B | 0 | 13238 | 1350 |
| C | 0 | 12992 | 1282 |
| D | 0 | 18198 | 1934 |
| Mode SS | |||
|---|---|---|---|
| Quadrant | BADHDUFLAG | Total packets | Discarded packets |
| A | 0 | 127 | 15 |
| B | 0 | 126 | 12 |
| C | 0 | 127 | 15 |
| D | 0 | 127 | 13 |
| Mode M9 | |||
|---|---|---|---|
| Quadrant | BADHDUFLAG | Total packets | Discarded packets |
| A | 0 | 16 | 5 |
| B | 0 | 16 | 3 |
| C | 0 | 16 | 6 |
| D | 0 | 16 | 4 |
| Quadrant | Total seconds | Saturated seconds | Saturation percentage |
|---|---|---|---|
| A | 5653 | 15 | 0.265346% |
| B | 5645 | 30 | 0.531444% |
| C | 5651 | 56 | 0.990975% |
| D | 5624 | 135 | 2.400427% |
Noise dominated data is calculated using 1-second bins in cleaned event files. If a bin has >2000 counts, and if more than 50% of those come from <1% of pixels, then it is considered to be noise-dominated and hence unusable.
| Quadrant | # 1 sec bins | Bins with >0 counts | Bins with >2000 counts | High rate bins dominated by noise | Noise dominated (total time) | Noise dominated (detector-on time) | Marked lightcurve |
|---|---|---|---|---|---|---|---|
| A | 7449 | 5789 | 0 | 0 | 0.00% | 0.00% | 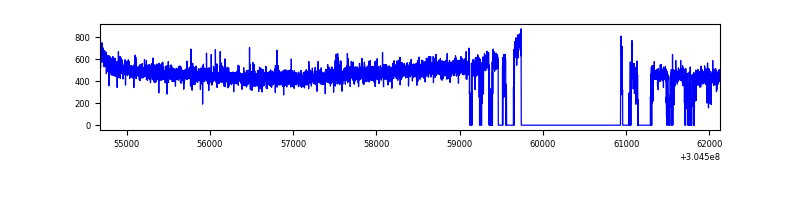 |
| B | 7449 | 5760 | 2 | 2 | 0.03% | 0.03% | 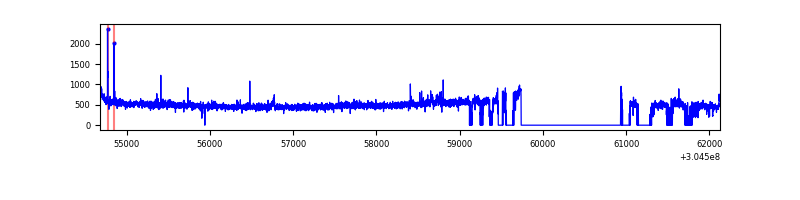 |
| C | 7449 | 5780 | 13 | 13 | 0.17% | 0.22% | 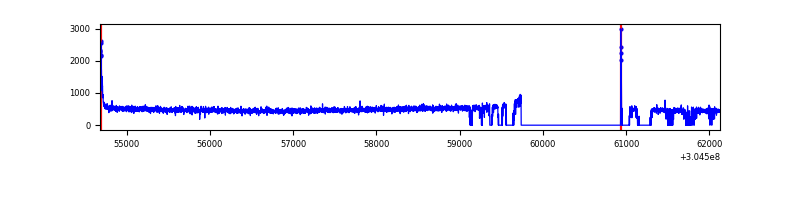 |
| D | 7449 | 5742 | 91 | 91 | 1.22% | 1.58% | 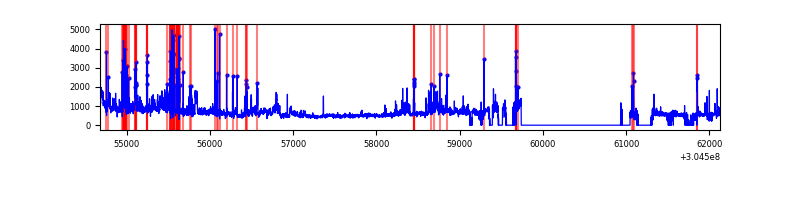 |
Top three noisy pixels from each quadrant. If the there are fewer than three noisy pixels in the level2.evt file, extra rows are filled as -1
| Pixel properties | Quadrant properties | ||||||
|---|---|---|---|---|---|---|---|
| Quadrant | DetID | PixID | Counts | Sigma | Mean | Median | Sigma |
| A | 15 | 192 | 10425 | 69.0 | 697 | 685 | 141.2 |
| A | 13 | 254 | 7300 | 46.86 | 697 | 685 | 141.2 |
| A | 8 | 205 | 6683 | 42.49 | 697 | 685 | 141.2 |
| B | 0 | 230 | 34255 | 252.97 | 704 | 688 | 132.7 |
| B | 12 | 111 | 15539 | 111.92 | 704 | 688 | 132.7 |
| B | 4 | 216 | 14544 | 104.42 | 704 | 688 | 132.7 |
| C | 14 | 238 | 107120 | 675.99 | 672 | 677 | 157.5 |
| C | 0 | 10 | 57736 | 362.37 | 672 | 677 | 157.5 |
| C | 13 | 61 | 4953 | 27.16 | 672 | 677 | 157.5 |
| D | 1 | 239 | 519894 | 3235.34 | 662 | 643 | 160.5 |
| D | 5 | 222 | 388569 | 2417.08 | 662 | 643 | 160.5 |
| D | 1 | 52 | 329947 | 2051.82 | 662 | 643 | 160.5 |
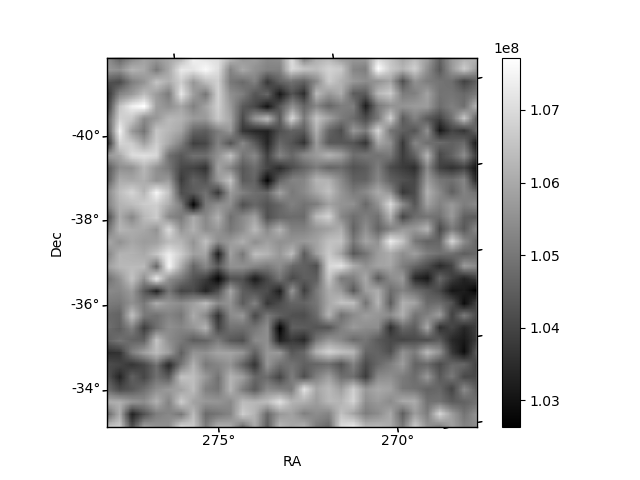
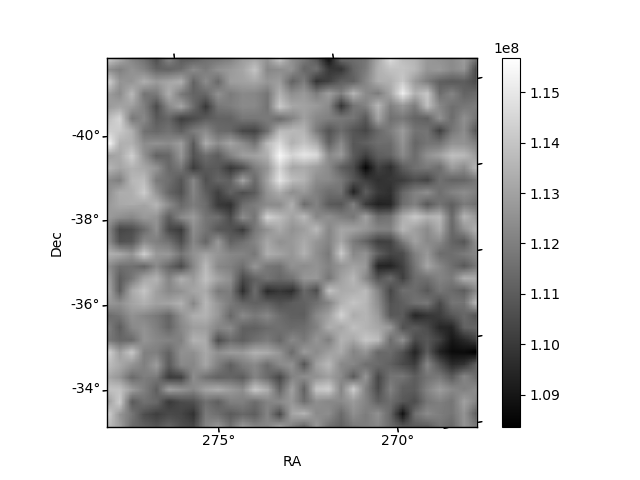
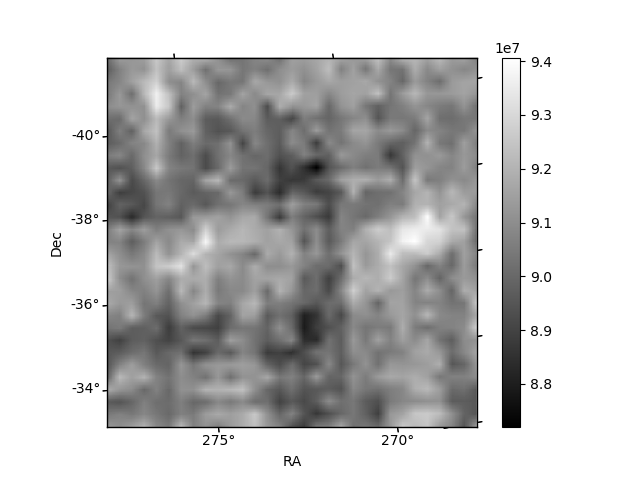
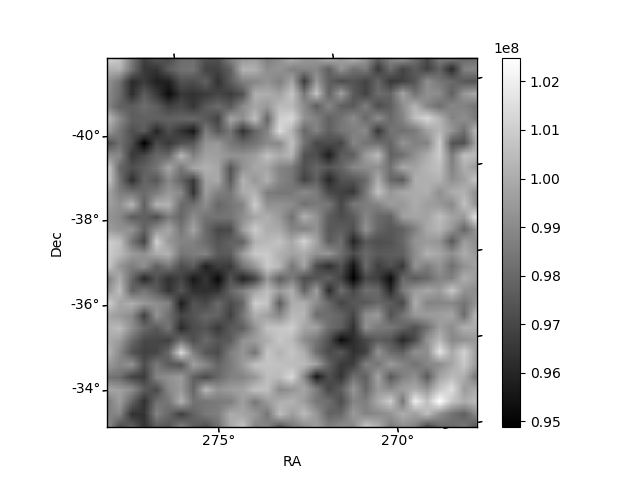
Histogram calculated using DETX and DETY for each event in the final _common_clean file
| Quadrant A | 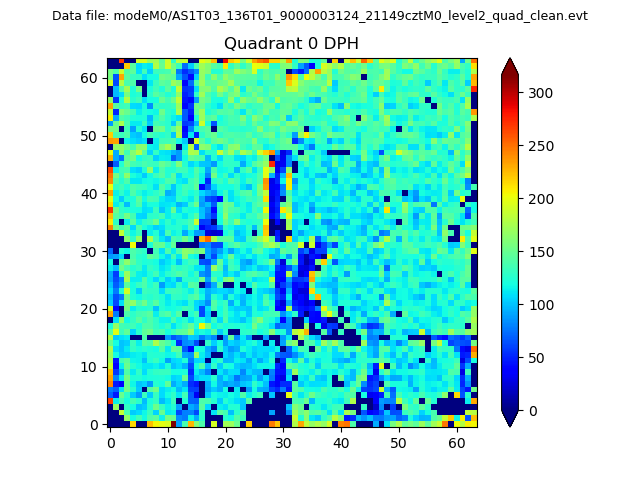 |
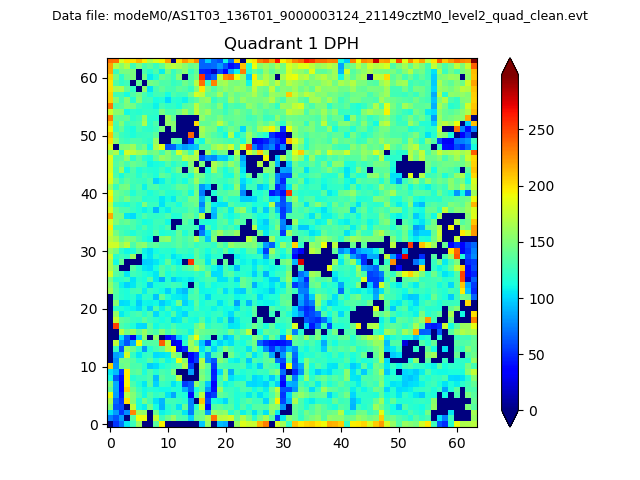 |
Quadrant B |
|---|---|---|---|
| Quadrant D | 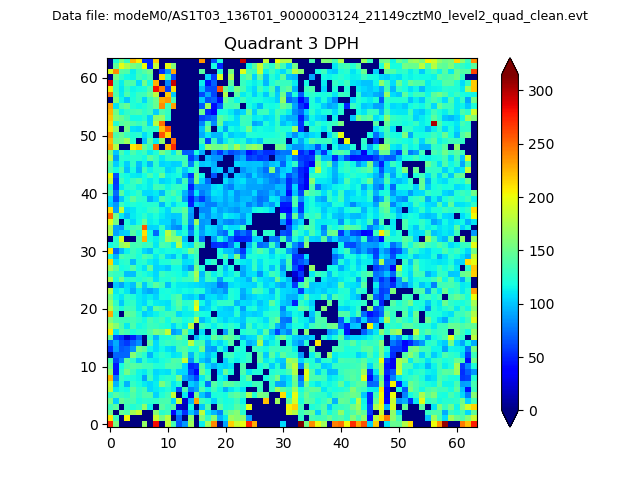 |
 |
Quadrant C |
| Plot type | Count rate plots | Images |
|---|---|---|
| Comparison with Poisson distribution Blue bars denote a histogram of data divided into 1 sec bins. Red curve is a Poisson curve with rate = median count rate of data. |
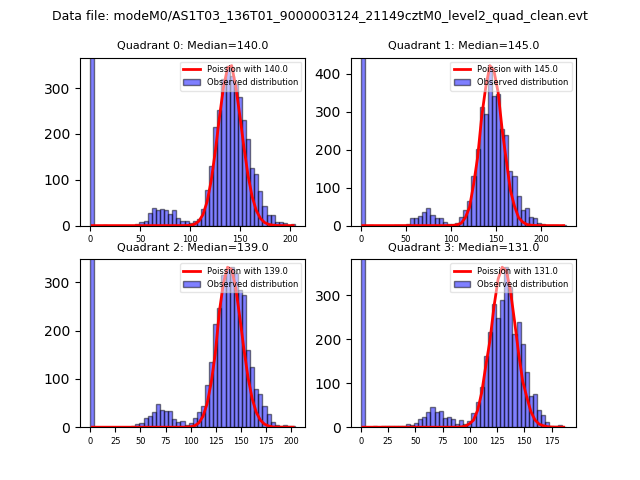 |
 |
| Quadrant-wise count rates Data is divided into 100 sec bins |
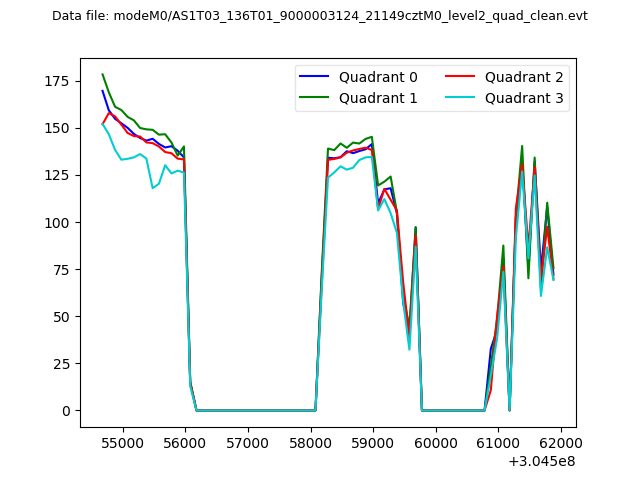 |
|
| Module-wise count rates for Quadrant A Data is divided into 100 sec bins |
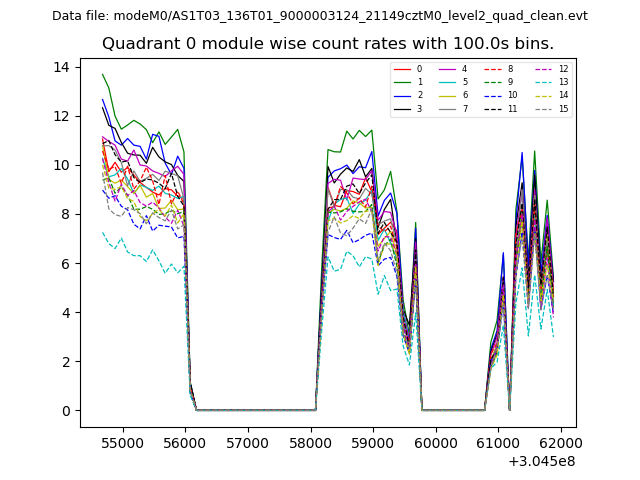 |
 |
| Module-wise count rates for Quadrant B Data is divided into 100 sec bins |
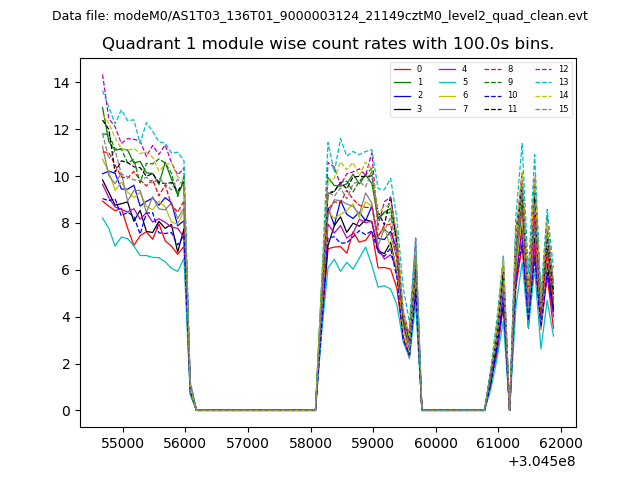 |
 |
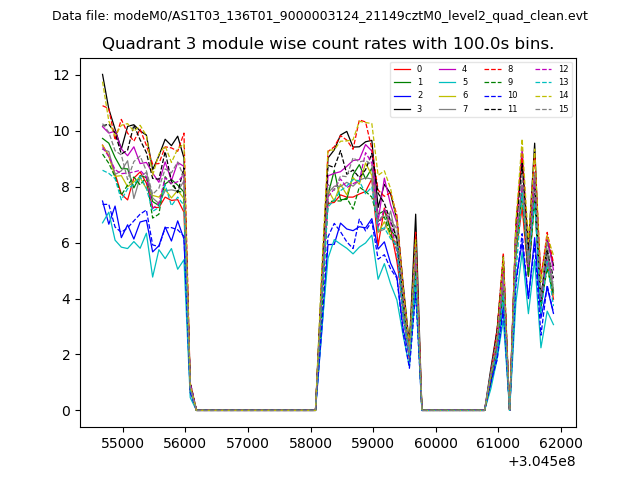
| Module-wise count rates for Quadrant C Data is divided into 100 sec bins |
 |
 |
| Module-wise count rates for Quadrant D Data is divided into 100 sec bins |
 |
 |
| Parameter | Plot |
|---|---|
| CZT HV Monitor | 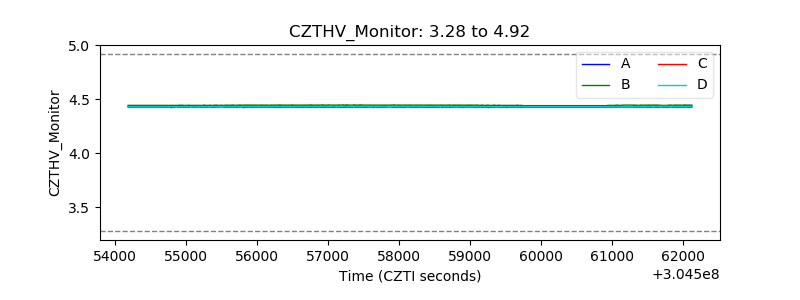 |
| D_VDD | 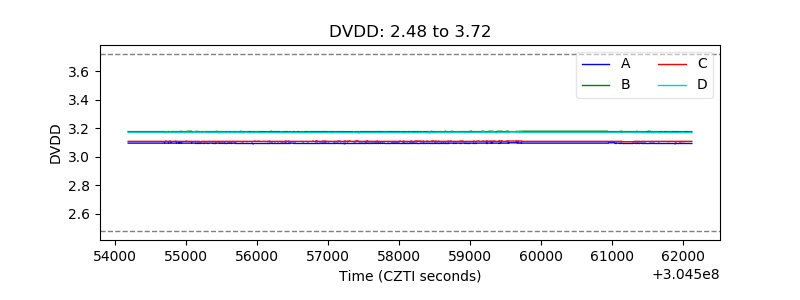 |
| Temperature 1 | 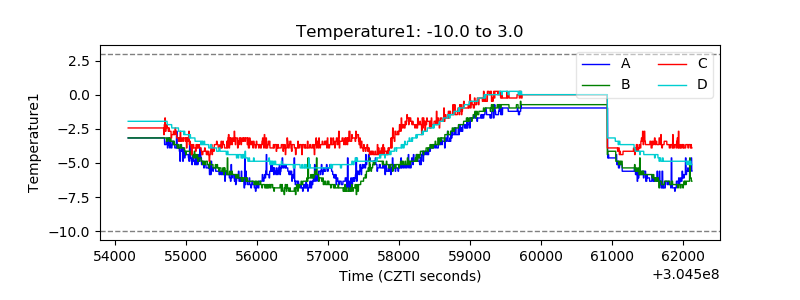 |
| Veto HV Monitor | 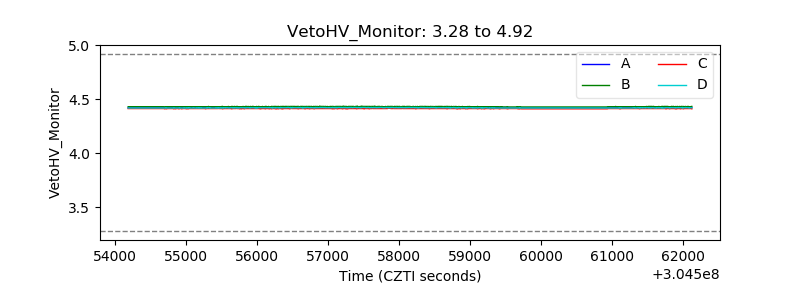 |
| Veto LLD | 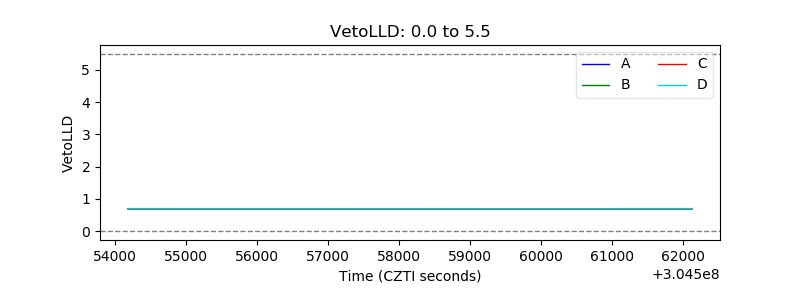 |
| Alpha Counter |  |
| _CPM_Rate | 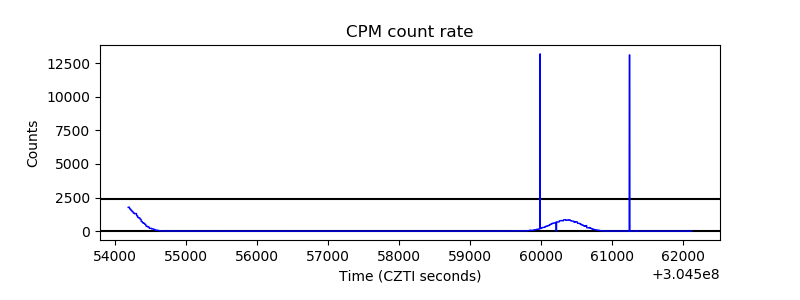 |
| CZT Counter | 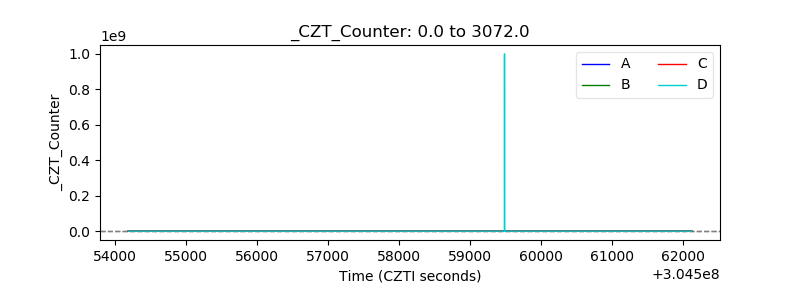 |
| +2.5 Volts monitor |  |
| +5 Volts monitor |  |
| _ROLL_ROT | 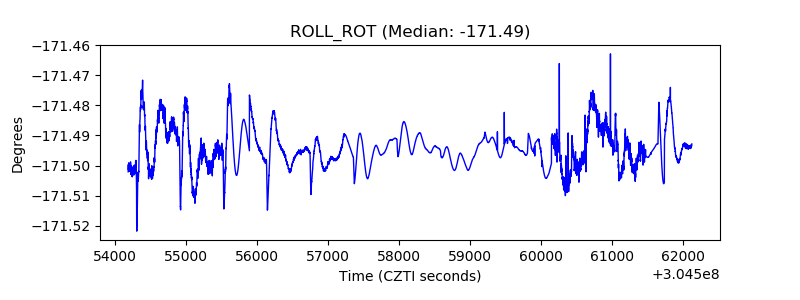 |
| _Roll_DEC | 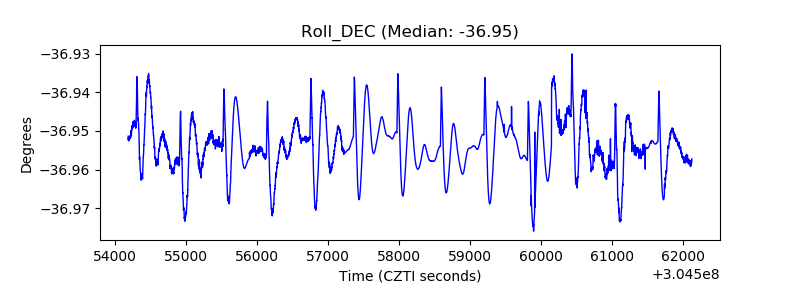 |
| _Roll_RA | 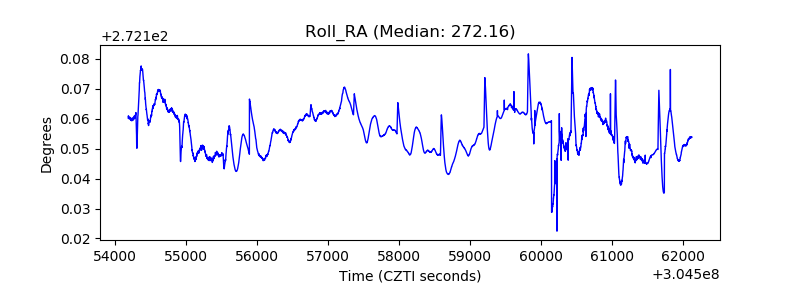 |
| Veto Counter | 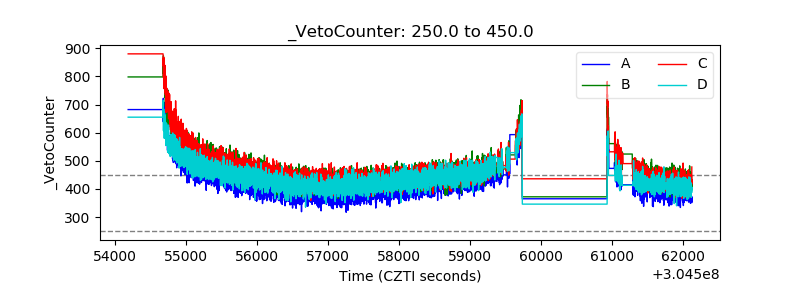 |