| Param | Original file | Final file |
|---|---|---|
| Filename | modeM0/AS1T03_136T01_9000003124_21151cztM0_level2.evt | modeM0/AS1T03_136T01_9000003124_21151cztM0_level2_quad_clean.evt |
| Size (bytes) | 1,003,478,400 | 73,091,520 |
| Size | 957.0 MB | 69.7 MB |
| Events in quadrant A | 3,433,166 | 510,986 |
| Events in quadrant B | 3,789,403 | 522,805 |
| Events in quadrant C | 3,465,937 | 504,850 |
| Events in quadrant D | 19,203,692 | 159,616 |
| Mode M0 | |||
|---|---|---|---|
| Quadrant | BADHDUFLAG | Total packets | Discarded packets |
| A | 0 | 15142 | 11 |
| B | 0 | 15936 | 8 |
| C | 0 | 15149 | 13 |
| D | 0 | 61939 | 46 |
| Mode SS | |||
|---|---|---|---|
| Quadrant | BADHDUFLAG | Total packets | Discarded packets |
| A | 0 | 150 | 0 |
| B | 0 | 150 | 0 |
| C | 0 | 150 | 0 |
| D | 0 | 150 | 0 |
| Mode M9 | |||
|---|---|---|---|
| Quadrant | BADHDUFLAG | Total packets | Discarded packets |
| A | 0 | 6 | 0 |
| B | 0 | 6 | 1 |
| C | 0 | 7 | 2 |
| D | 0 | 7 | 0 |
| Quadrant | Total seconds | Saturated seconds | Saturation percentage |
|---|---|---|---|
| A | 7368 | 68 | 0.922910% |
| B | 7369 | 102 | 1.384177% |
| C | 7368 | 103 | 1.397937% |
| D | 7365 | 7152 | 97.107943% |
Noise dominated data is calculated using 1-second bins in cleaned event files. If a bin has >2000 counts, and if more than 50% of those come from <1% of pixels, then it is considered to be noise-dominated and hence unusable.
| Quadrant | # 1 sec bins | Bins with >0 counts | Bins with >2000 counts | High rate bins dominated by noise | Noise dominated (total time) | Noise dominated (detector-on time) | Marked lightcurve |
|---|---|---|---|---|---|---|---|
| A | 7781 | 7373 | 0 | 0 | 0.00% | 0.00% | 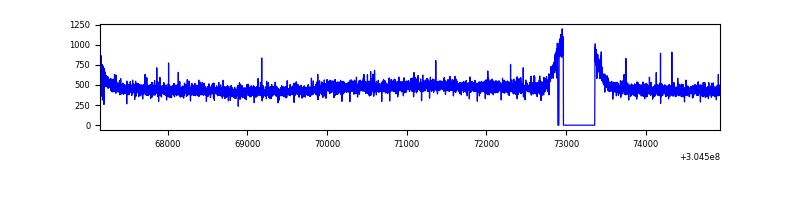 |
| B | 7781 | 7373 | 8 | 8 | 0.10% | 0.11% | 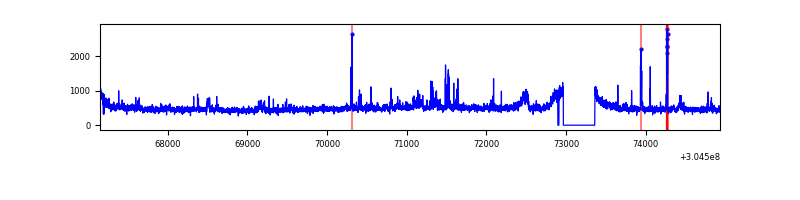 |
| C | 7781 | 7373 | 0 | 0 | 0.00% | 0.00% | 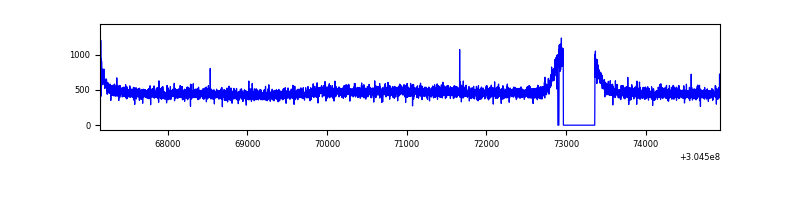 |
| D | 7780 | 7366 | 6873 | 6873 | 88.34% | 93.31% | 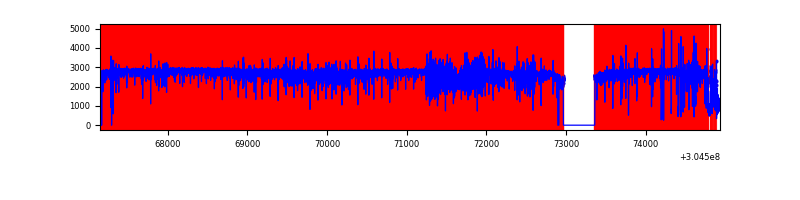 |
Top three noisy pixels from each quadrant. If the there are fewer than three noisy pixels in the level2.evt file, extra rows are filled as -1
| Pixel properties | Quadrant properties | ||||||
|---|---|---|---|---|---|---|---|
| Quadrant | DetID | PixID | Counts | Sigma | Mean | Median | Sigma |
| A | 13 | 254 | 10507 | 53.66 | 887 | 869 | 179.6 |
| A | 3 | 137 | 7586 | 37.4 | 887 | 869 | 179.6 |
| A | 0 | 226 | 7562 | 37.26 | 887 | 869 | 179.6 |
| B | 0 | 230 | 70243 | 406.5 | 891 | 869 | 170.7 |
| B | 0 | 189 | 67676 | 391.46 | 891 | 869 | 170.7 |
| B | 3 | 64 | 41557 | 238.42 | 891 | 869 | 170.7 |
| C | 14 | 238 | 131664 | 647.46 | 853 | 859 | 202.0 |
| C | 0 | 10 | 6365 | 27.25 | 853 | 859 | 202.0 |
| C | 13 | 61 | 5922 | 25.06 | 853 | 859 | 202.0 |
| D | 1 | 239 | 16430440 | 196083.43 | 340 | 328 | 83.8 |
| D | 7 | 238 | 806432 | 9620.36 | 340 | 328 | 83.8 |
| D | 5 | 222 | 442300 | 5274.67 | 340 | 328 | 83.8 |
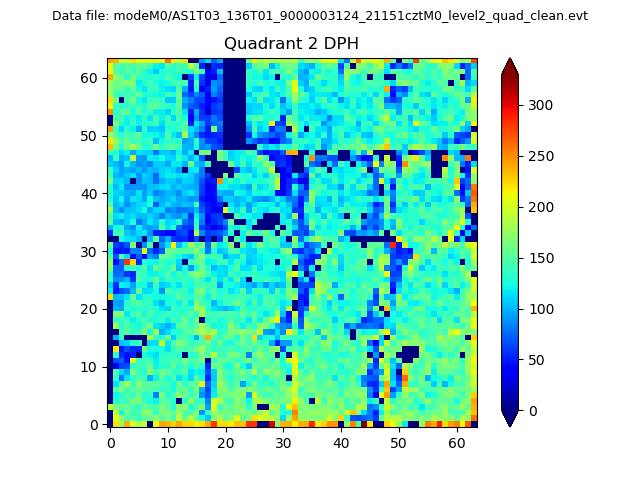
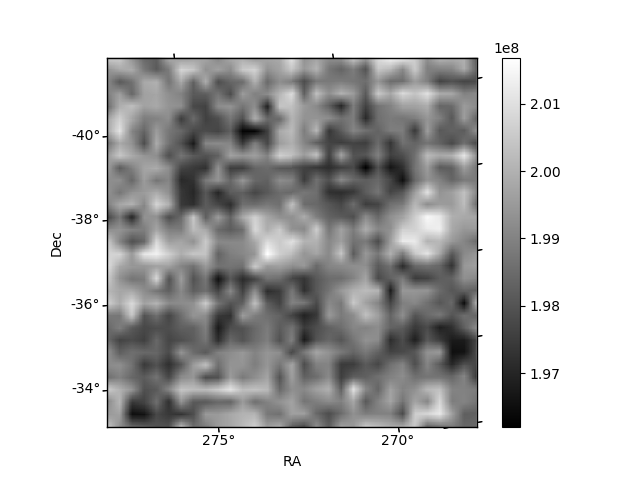
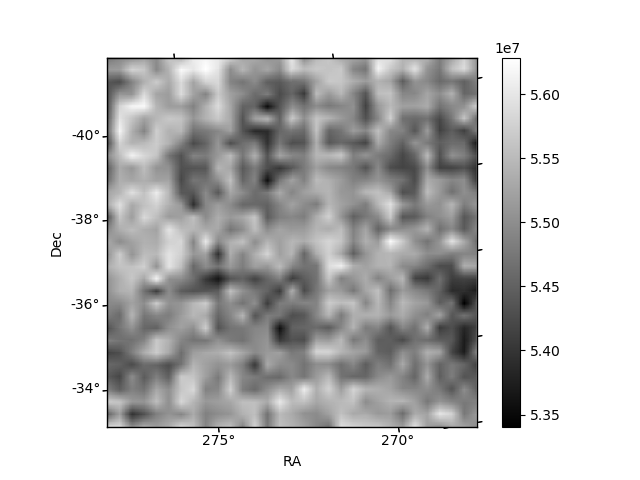
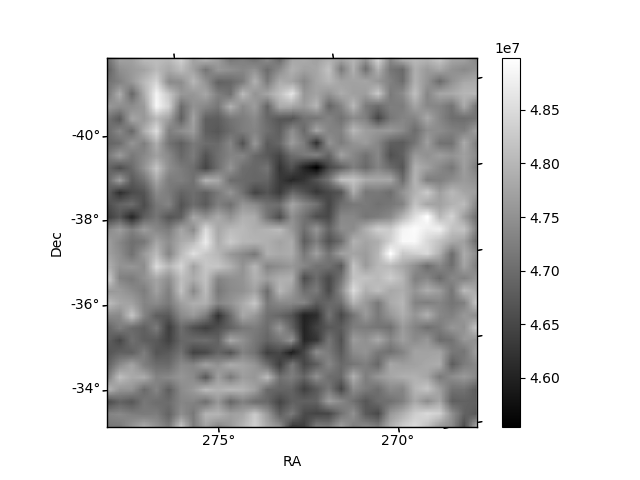
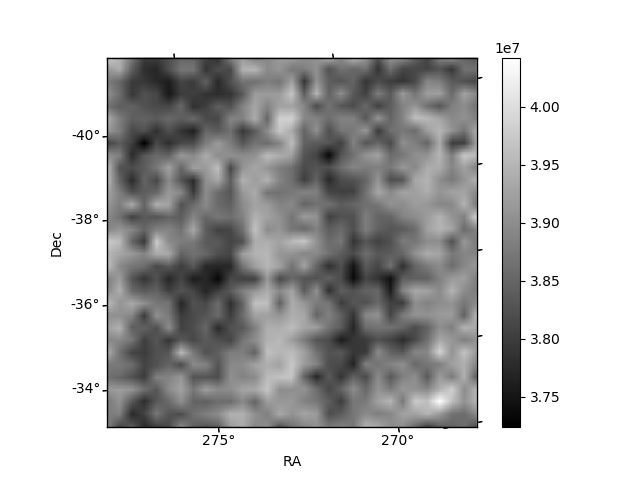
Histogram calculated using DETX and DETY for each event in the final _common_clean file
| Quadrant A | 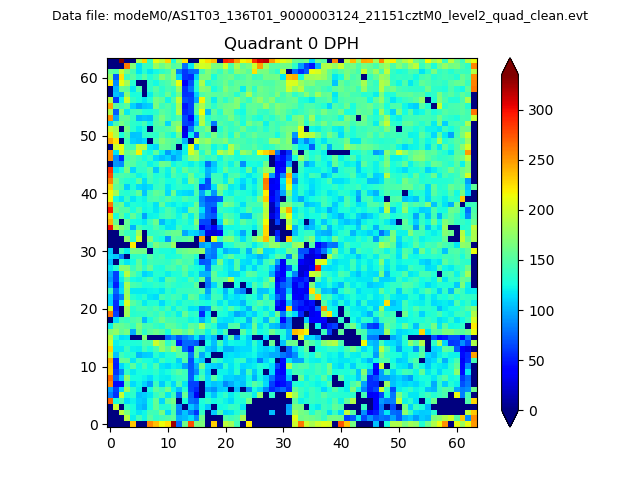 |
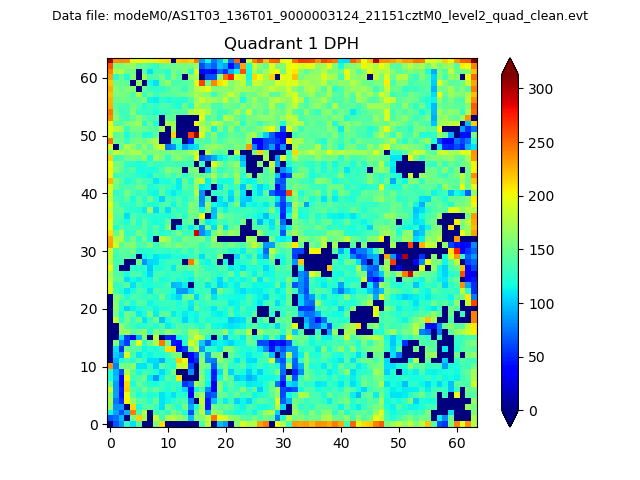 |
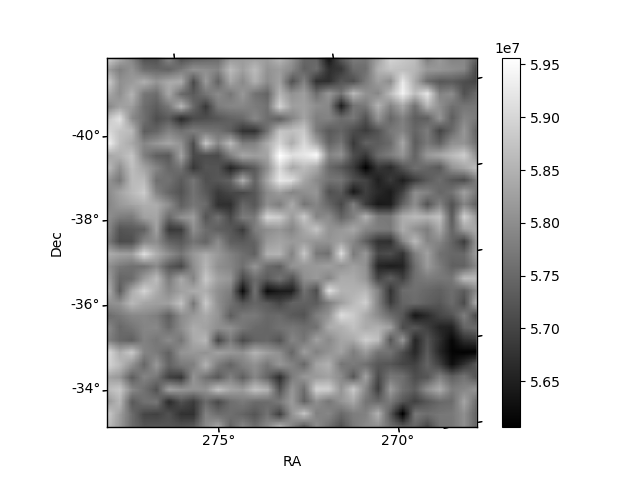
Quadrant B |
|---|---|---|---|
| Quadrant D | 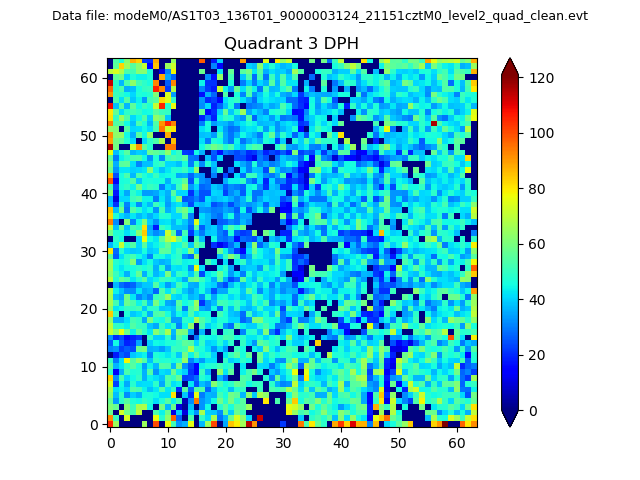 |
 |
Quadrant C |
| Plot type | Count rate plots | Images |
|---|---|---|
| Comparison with Poisson distribution Blue bars denote a histogram of data divided into 1 sec bins. Red curve is a Poisson curve with rate = median count rate of data. |
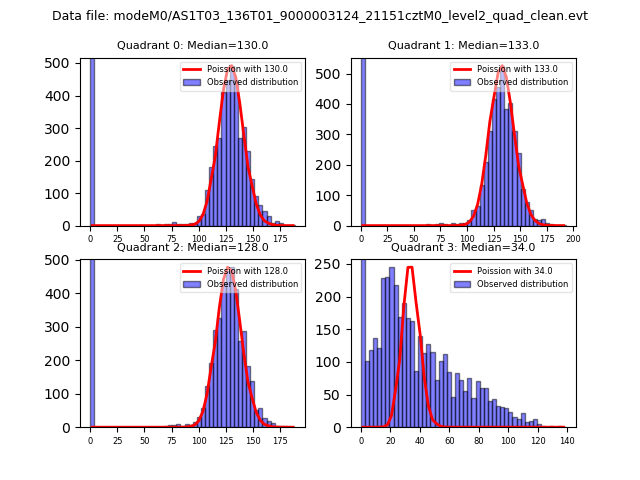 |
 |
| Quadrant-wise count rates Data is divided into 100 sec bins |
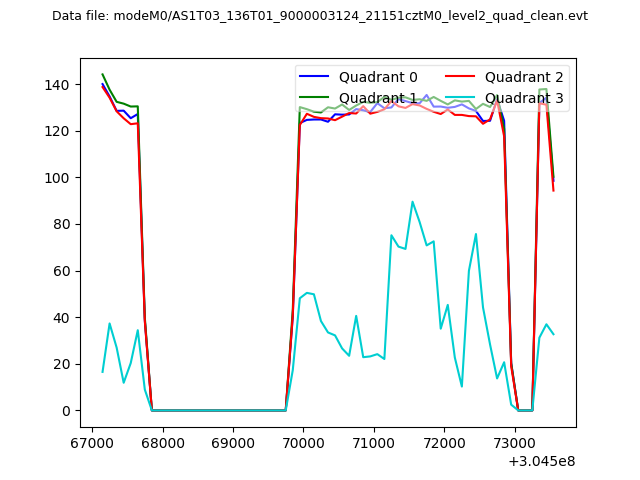 |
|
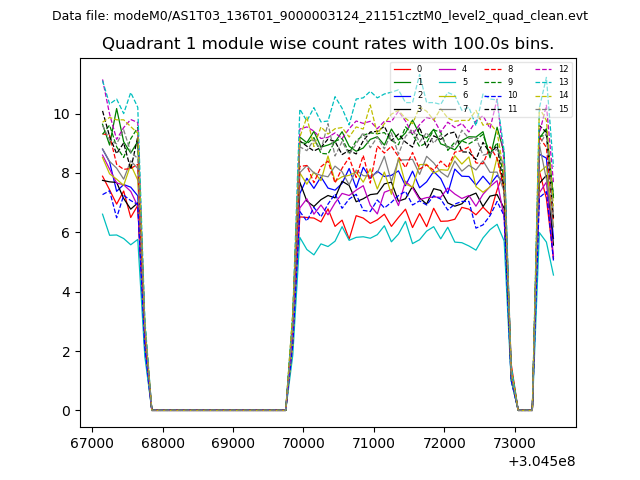
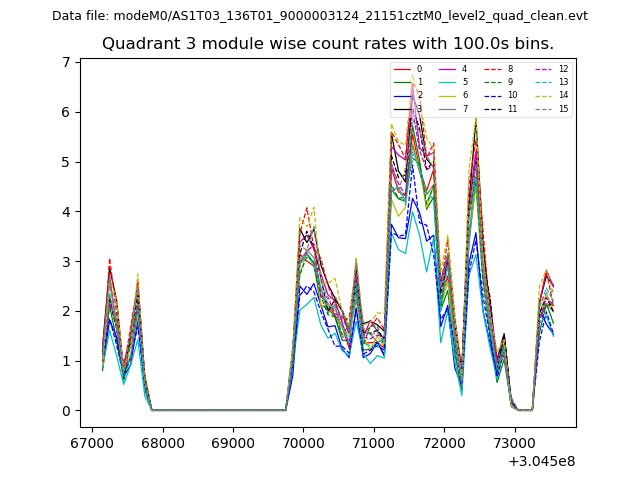
| Module-wise count rates for Quadrant A Data is divided into 100 sec bins |
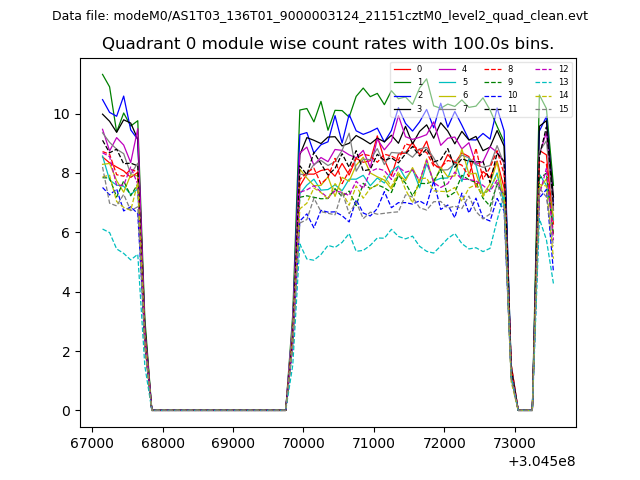 |
 |
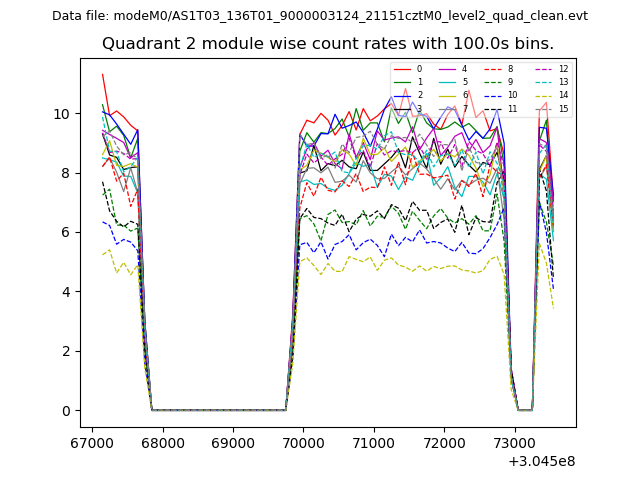
| Module-wise count rates for Quadrant B Data is divided into 100 sec bins |
 |
 |
| Module-wise count rates for Quadrant C Data is divided into 100 sec bins |
 |
 |
| Module-wise count rates for Quadrant D Data is divided into 100 sec bins |
 |
 |
| Parameter | Plot |
|---|---|
| CZT HV Monitor | 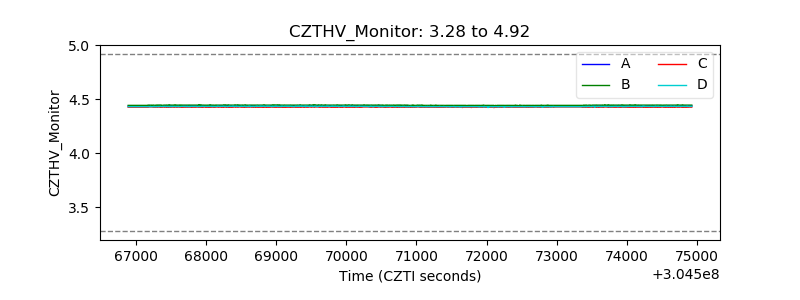 |
| D_VDD | 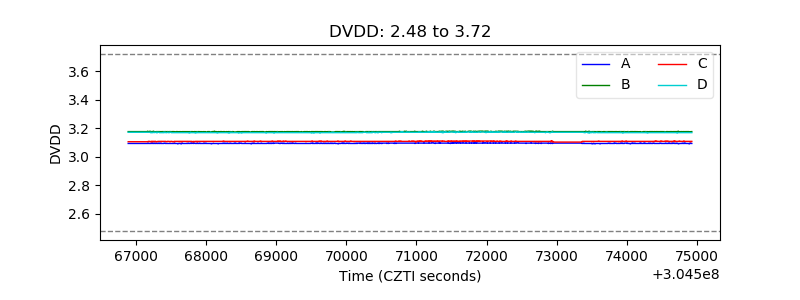 |
| Temperature 1 | 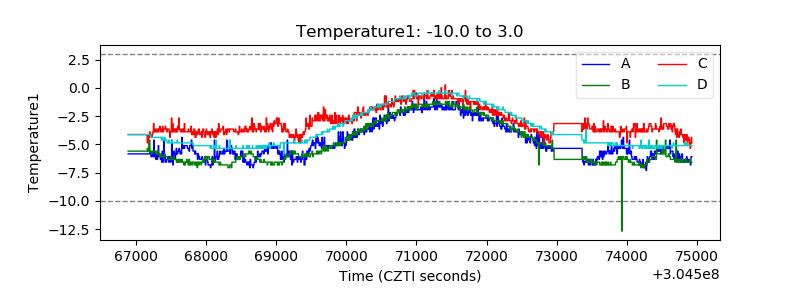 |
| Veto HV Monitor | 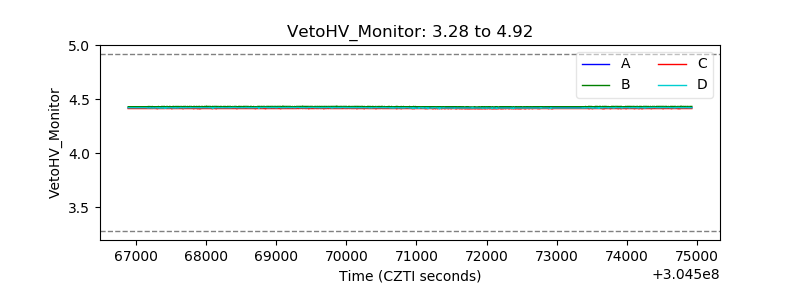 |
| Veto LLD | 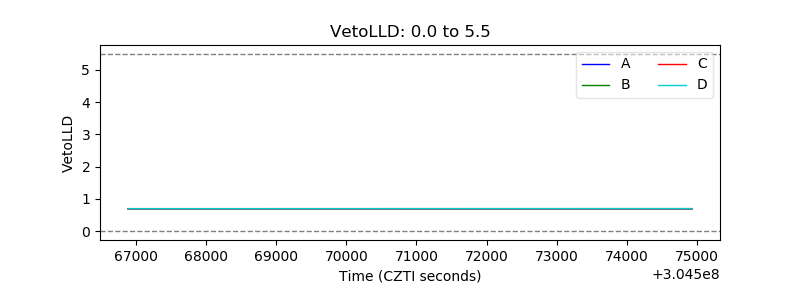 |
| Alpha Counter | 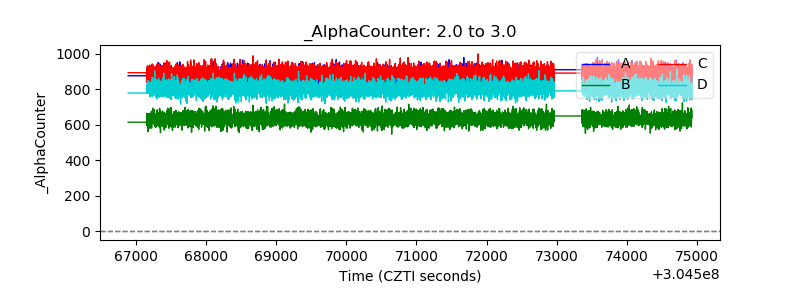 |
| _CPM_Rate | 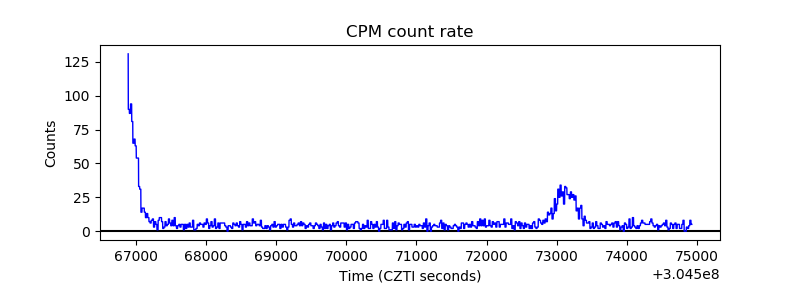 |
| CZT Counter | 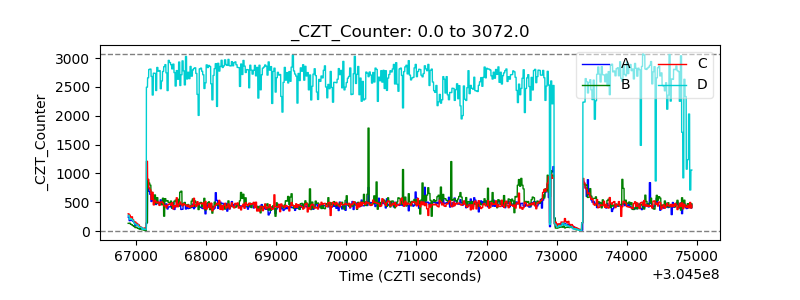 |
| +2.5 Volts monitor |  |
| +5 Volts monitor |  |
| _ROLL_ROT | 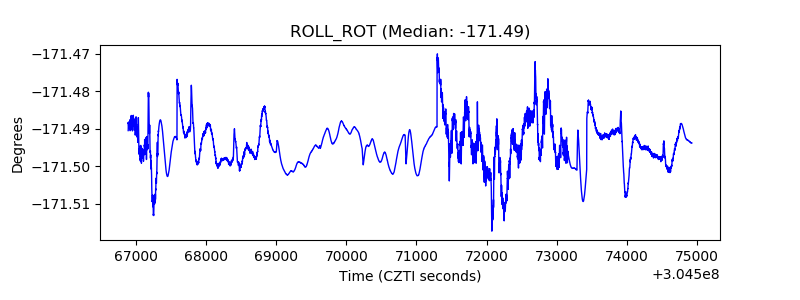 |
| _Roll_DEC | 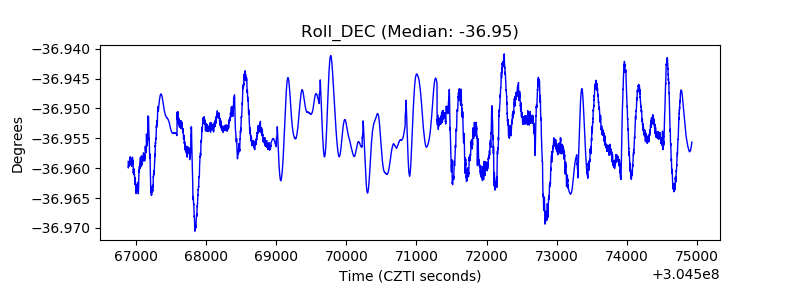 |
| _Roll_RA | 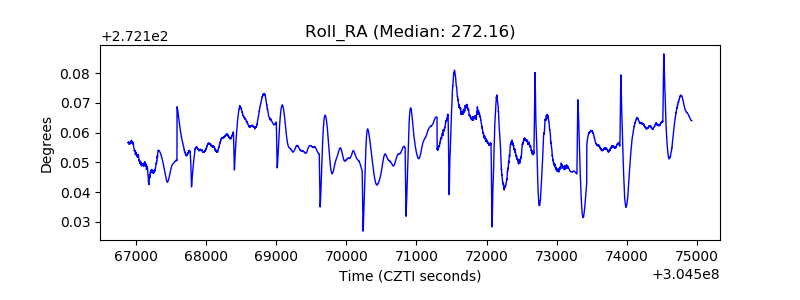 |
| Veto Counter | 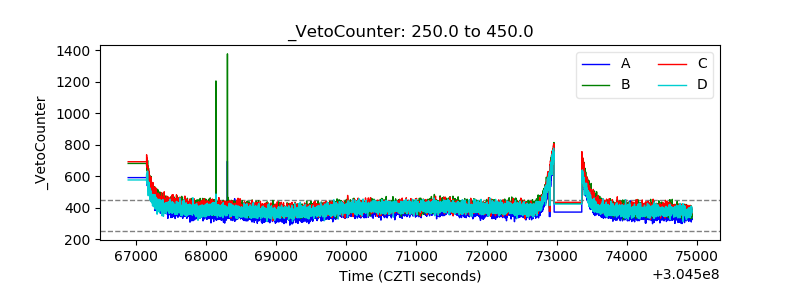 |