| Param | Original file | Final file |
|---|---|---|
| Filename | modeM0/AS1T03_136T01_9000003124_21152cztM0_level2.evt | modeM0/AS1T03_136T01_9000003124_21152cztM0_level2_quad_clean.evt |
| Size (bytes) | 437,256,000 | 68,607,360 |
| Size | 417.0 MB | 65.4 MB |
| Events in quadrant A | 2,548,633 | 437,317 |
| Events in quadrant B | 2,848,663 | 441,660 |
| Events in quadrant C | 2,566,045 | 431,821 |
| Events in quadrant D | 4,920,296 | 396,922 |
| Mode M0 | |||
|---|---|---|---|
| Quadrant | BADHDUFLAG | Total packets | Discarded packets |
| A | 0 | 11426 | 360 |
| B | 0 | 12139 | 380 |
| C | 0 | 11417 | 358 |
| D | 0 | 19158 | 789 |
| Mode SS | |||
|---|---|---|---|
| Quadrant | BADHDUFLAG | Total packets | Discarded packets |
| A | 0 | 112 | 4 |
| B | 0 | 112 | 4 |
| C | 0 | 112 | 2 |
| D | 0 | 112 | 6 |
| Mode M9 | |||
|---|---|---|---|
| Quadrant | BADHDUFLAG | Total packets | Discarded packets |
| A | 0 | 2 | 0 |
| B | 0 | 3 | 1 |
| C | 0 | 2 | 0 |
| D | 0 | 2 | 0 |
| Quadrant | Total seconds | Saturated seconds | Saturation percentage |
|---|---|---|---|
| A | 5283 | 167 | 3.161083% |
| B | 5277 | 194 | 3.676331% |
| C | 5287 | 206 | 3.896350% |
| D | 5261 | 773 | 14.693024% |
Noise dominated data is calculated using 1-second bins in cleaned event files. If a bin has >2000 counts, and if more than 50% of those come from <1% of pixels, then it is considered to be noise-dominated and hence unusable.
| Quadrant | # 1 sec bins | Bins with >0 counts | Bins with >2000 counts | High rate bins dominated by noise | Noise dominated (total time) | Noise dominated (detector-on time) | Marked lightcurve |
|---|---|---|---|---|---|---|---|
| A | 6845 | 5315 | 0 | 0 | 0.00% | 0.00% | 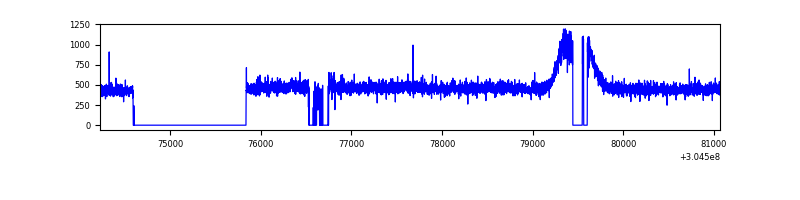 |
| B | 6843 | 5309 | 8 | 8 | 0.12% | 0.15% | 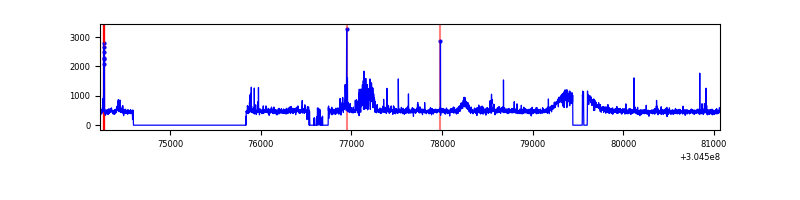 |
| C | 6844 | 5322 | 0 | 0 | 0.00% | 0.00% |  |
| D | 6840 | 5295 | 565 | 565 | 8.26% | 10.67% | 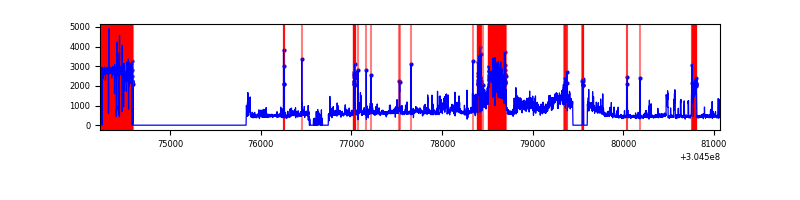 |
Top three noisy pixels from each quadrant. If the there are fewer than three noisy pixels in the level2.evt file, extra rows are filled as -1
| Pixel properties | Quadrant properties | ||||||
|---|---|---|---|---|---|---|---|
| Quadrant | DetID | PixID | Counts | Sigma | Mean | Median | Sigma |
| A | 13 | 254 | 7735 | 52.48 | 659 | 643 | 135.1 |
| A | 3 | 137 | 5750 | 37.79 | 659 | 643 | 135.1 |
| A | 0 | 226 | 5658 | 37.11 | 659 | 643 | 135.1 |
| B | 0 | 197 | 99990 | 773.14 | 657 | 639 | 128.5 |
| B | 0 | 189 | 57241 | 440.47 | 657 | 639 | 128.5 |
| B | 3 | 64 | 54829 | 421.7 | 657 | 639 | 128.5 |
| C | 14 | 238 | 97809 | 642.77 | 632 | 634 | 151.2 |
| C | 3 | 233 | 5457 | 31.9 | 632 | 634 | 151.2 |
| C | 13 | 61 | 4566 | 26.01 | 632 | 634 | 151.2 |
| D | 1 | 239 | 898199 | 6127.76 | 593 | 575 | 146.5 |
| D | 5 | 222 | 897654 | 6124.04 | 593 | 575 | 146.5 |
| D | 1 | 20 | 302116 | 2058.51 | 593 | 575 | 146.5 |
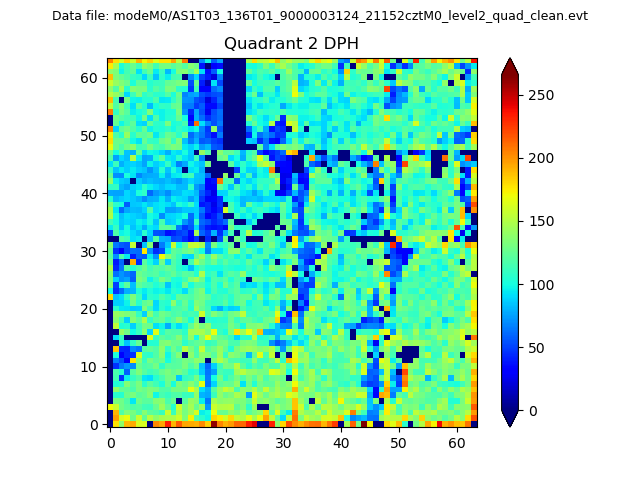
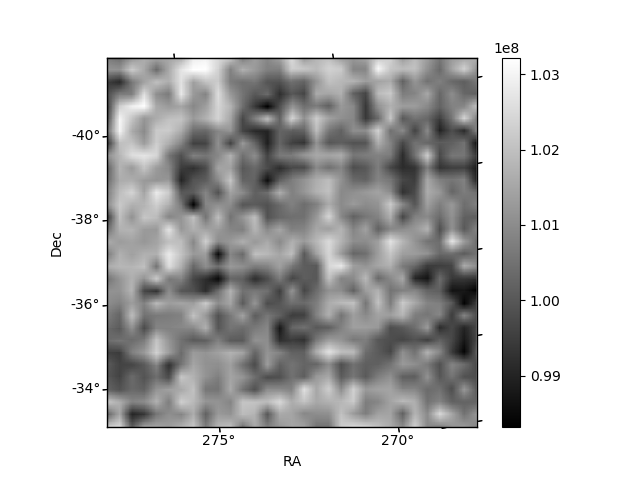
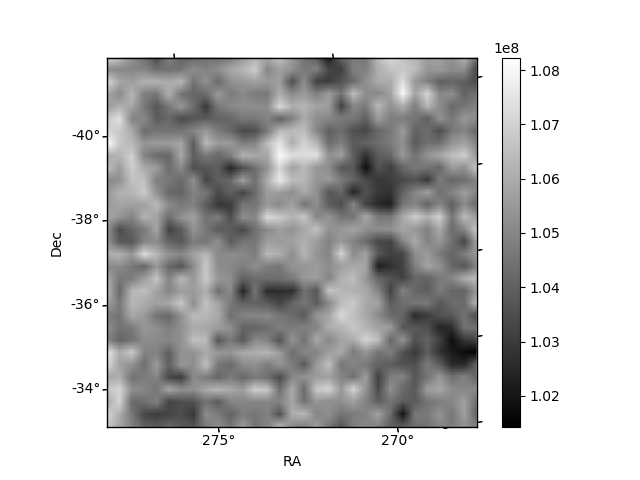
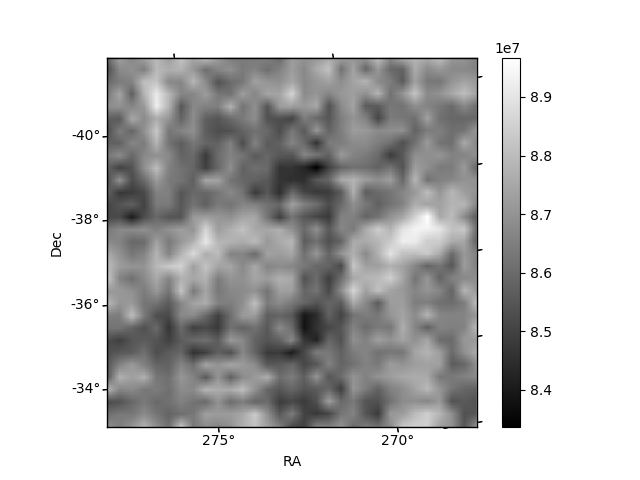
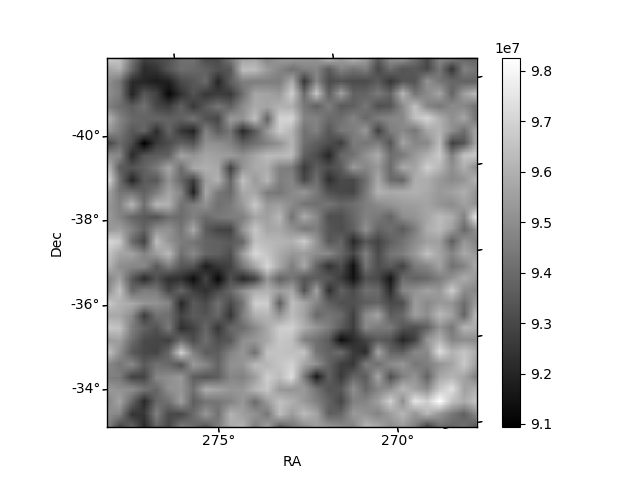
Histogram calculated using DETX and DETY for each event in the final _common_clean file
| Quadrant A |  |
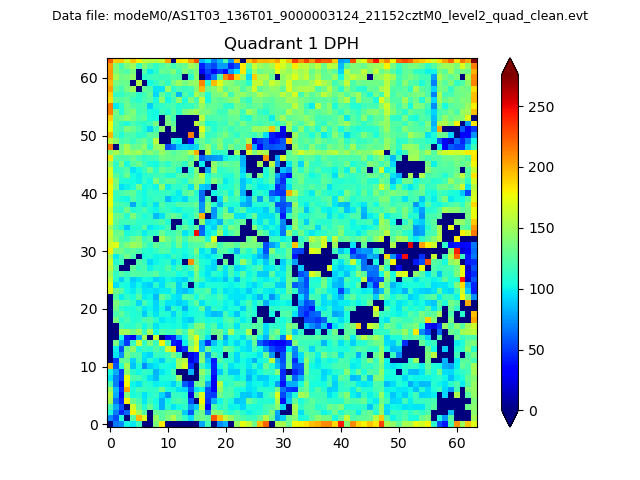 |
Quadrant B |
|---|---|---|---|
| Quadrant D | 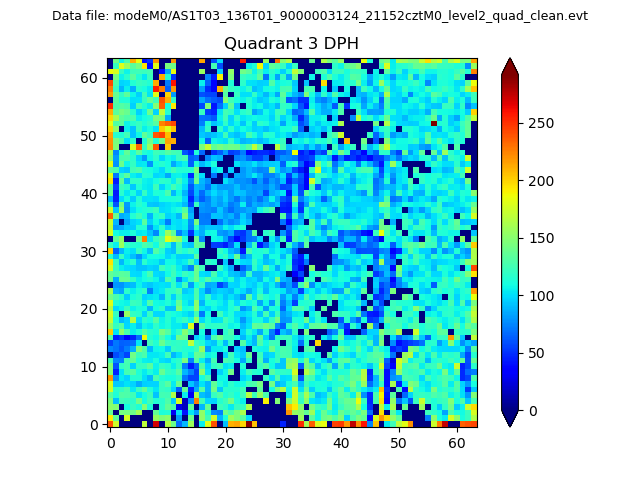 |
 |
Quadrant C |
| Plot type | Count rate plots | Images |
|---|---|---|
| Comparison with Poisson distribution Blue bars denote a histogram of data divided into 1 sec bins. Red curve is a Poisson curve with rate = median count rate of data. |
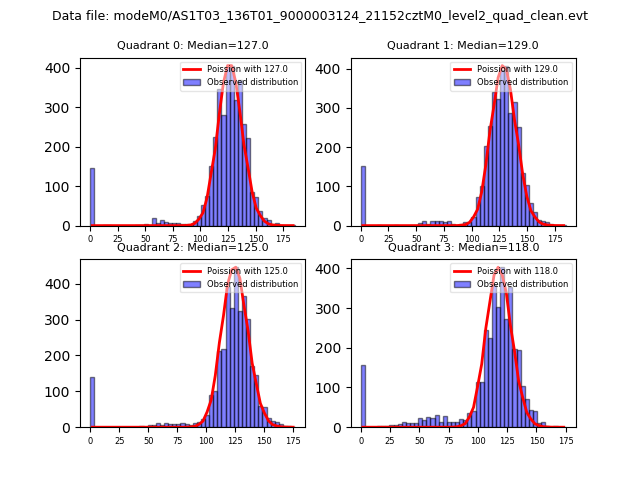 |
 |
| Quadrant-wise count rates Data is divided into 100 sec bins |
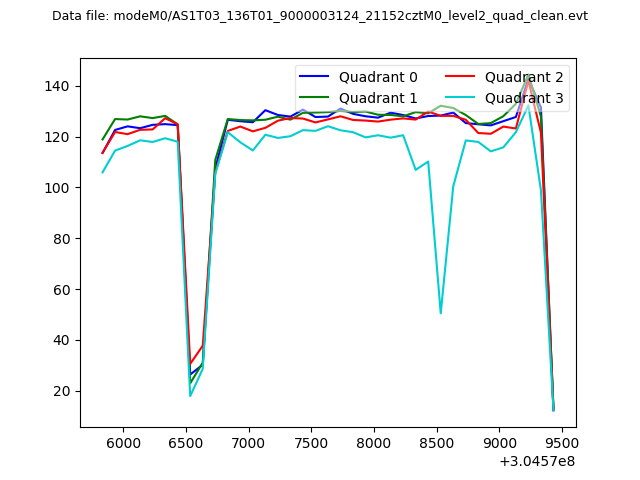 |
|
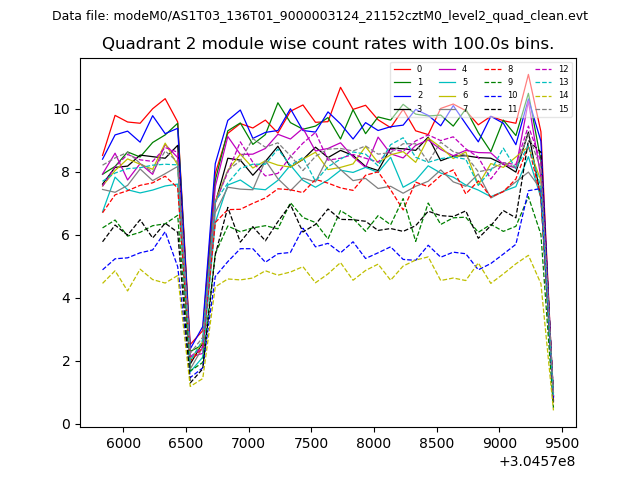
| Module-wise count rates for Quadrant A Data is divided into 100 sec bins |
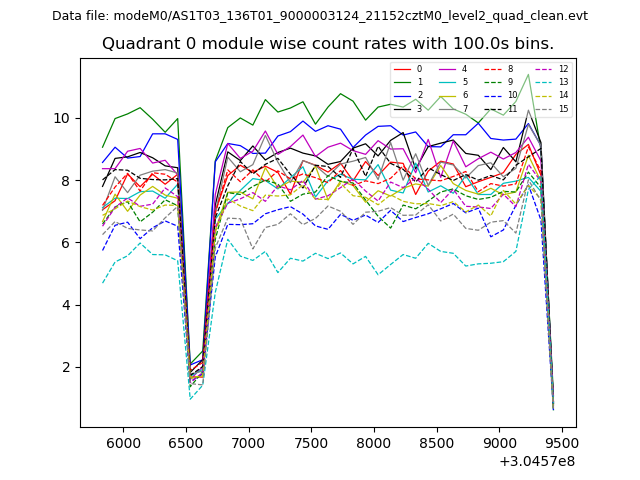 |
 |
| Module-wise count rates for Quadrant B Data is divided into 100 sec bins |
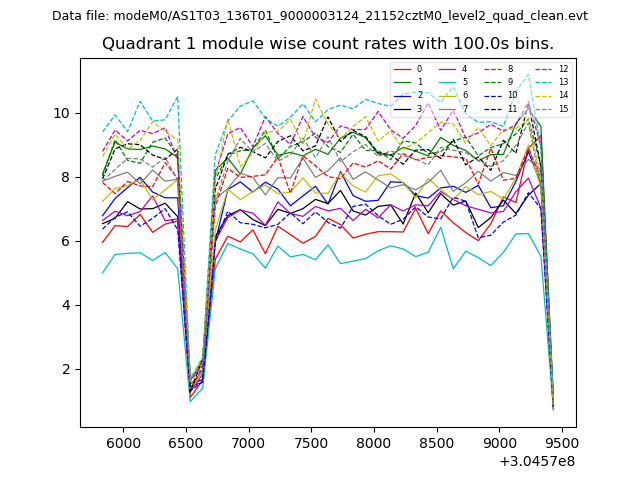 |
 |
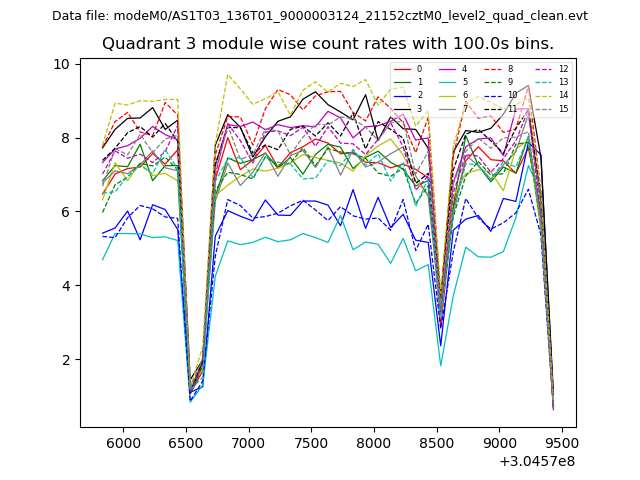
| Module-wise count rates for Quadrant C Data is divided into 100 sec bins |
 |
 |
| Module-wise count rates for Quadrant D Data is divided into 100 sec bins |
 |
 |
| Parameter | Plot |
|---|---|
| CZT HV Monitor | 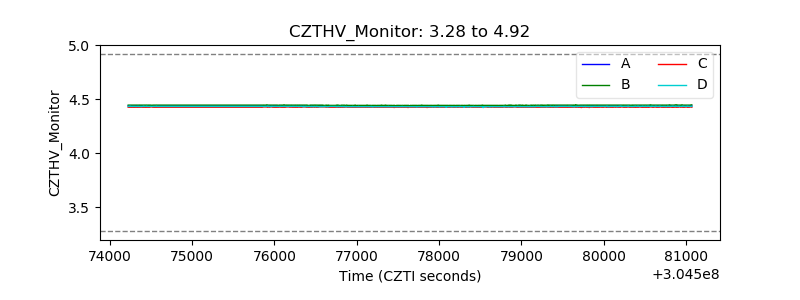 |
| D_VDD | 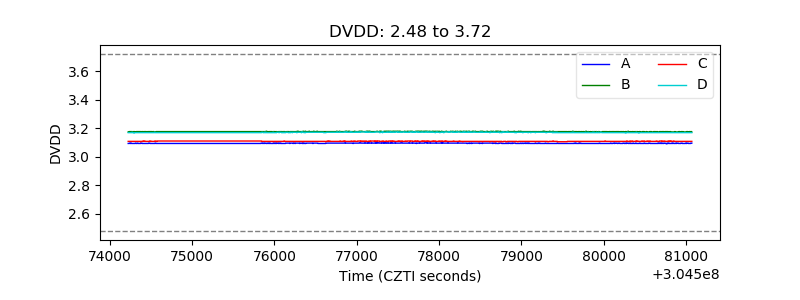 |
| Temperature 1 | 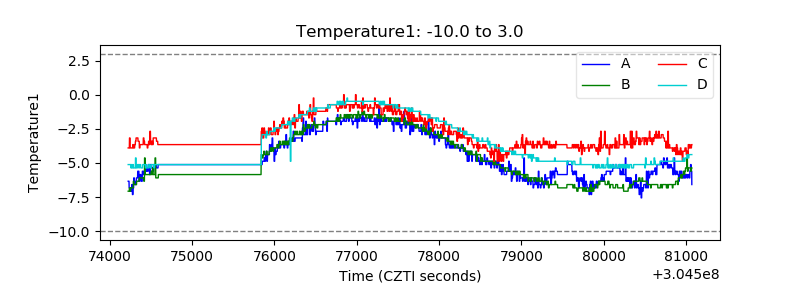 |
| Veto HV Monitor |  |
| Veto LLD | 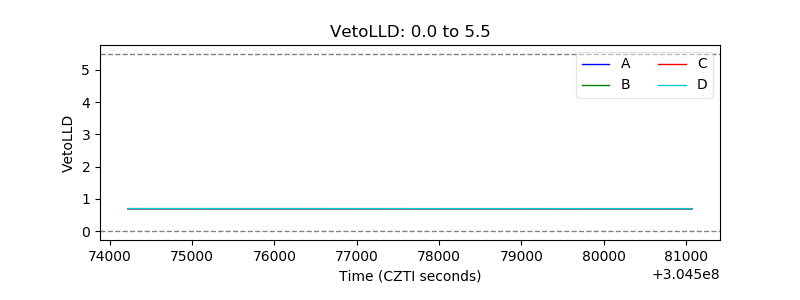 |
| Alpha Counter | 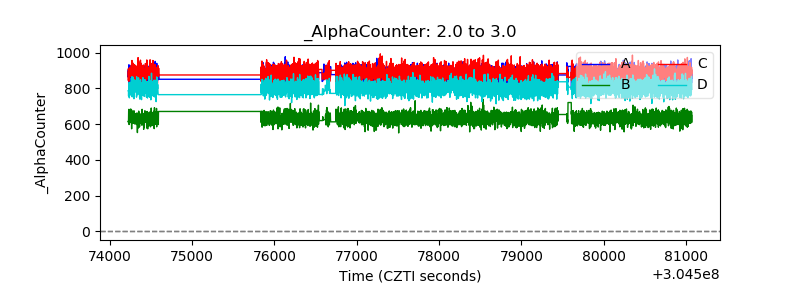 |
| _CPM_Rate | 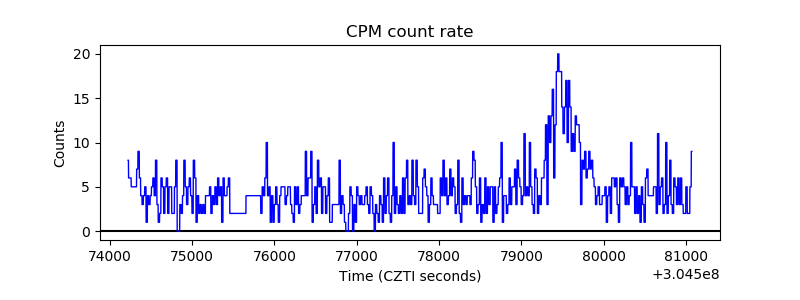 |
| CZT Counter | 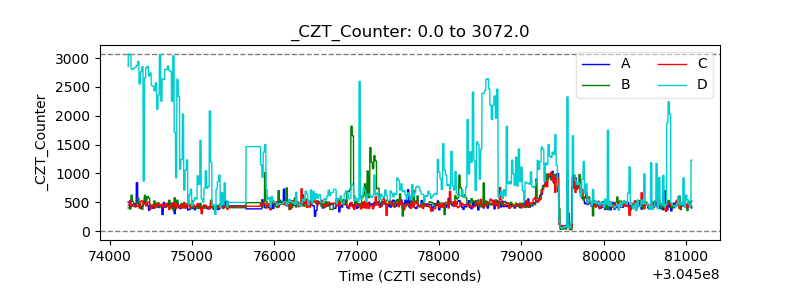 |
| +2.5 Volts monitor | 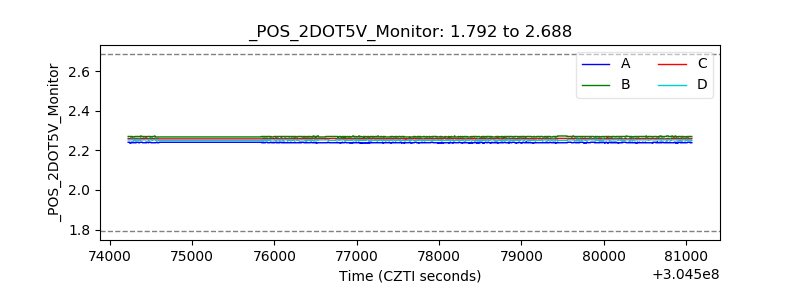 |
| +5 Volts monitor |  |
| _ROLL_ROT | 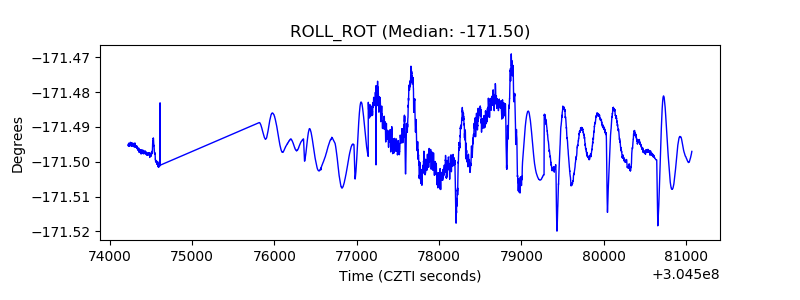 |
| _Roll_DEC | 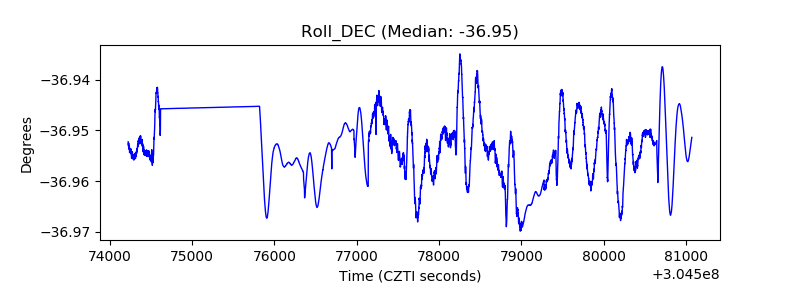 |
| _Roll_RA | 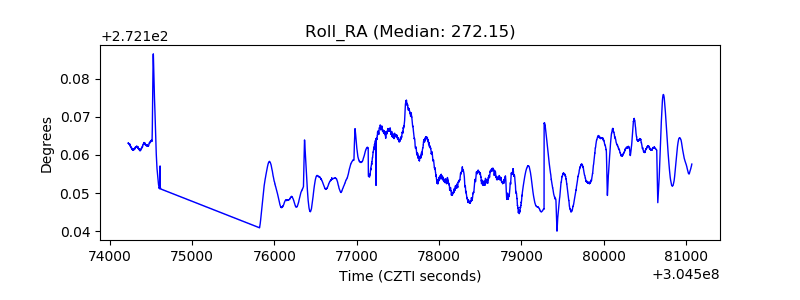 |
| Veto Counter | 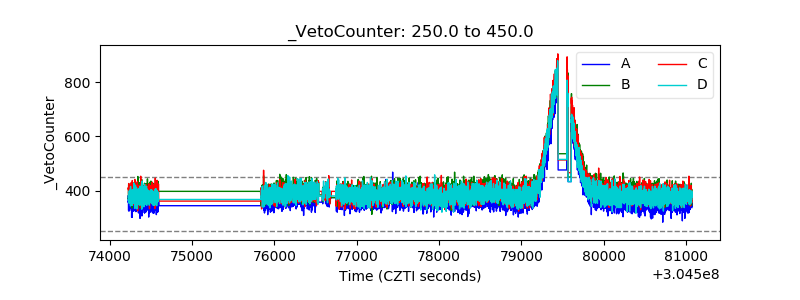 |