| Param | Original file | Final file |
|---|---|---|
| Filename | modeM0/AS1T03_136T01_9000003124_21157cztM0_level2.evt | modeM0/AS1T03_136T01_9000003124_21157cztM0_level2_quad_clean.evt |
| Size (bytes) | 1,220,382,720 | 181,108,800 |
| Size | 1.1 GB | 172.7 MB |
| Events in quadrant A | 7,366,876 | 1,143,939 |
| Events in quadrant B | 7,414,432 | 1,168,496 |
| Events in quadrant C | 6,840,608 | 1,139,055 |
| Events in quadrant D | 14,358,608 | 1,032,495 |
| Mode M0 | |||
|---|---|---|---|
| Quadrant | BADHDUFLAG | Total packets | Discarded packets |
| A | 0 | 31503 | 3 |
| B | 0 | 31156 | 3 |
| C | 0 | 29773 | 3 |
| D | 0 | 52555 | 3 |
| Mode SS | |||
|---|---|---|---|
| Quadrant | BADHDUFLAG | Total packets | Discarded packets |
| A | 0 | 296 | 0 |
| B | 0 | 296 | 0 |
| C | 0 | 296 | 0 |
| D | 0 | 296 | 0 |
| Mode M9 | |||
|---|---|---|---|
| Quadrant | BADHDUFLAG | Total packets | Discarded packets |
| A | 0 | 4 | 0 |
| B | 0 | 4 | 0 |
| C | 0 | 4 | 0 |
| D | 0 | 4 | 0 |
| Quadrant | Total seconds | Saturated seconds | Saturation percentage |
|---|---|---|---|
| A | 14491 | 411 | 2.836243% |
| B | 14492 | 360 | 2.484129% |
| C | 14492 | 377 | 2.601435% |
| D | 14492 | 2191 | 15.118686% |
Noise dominated data is calculated using 1-second bins in cleaned event files. If a bin has >2000 counts, and if more than 50% of those come from <1% of pixels, then it is considered to be noise-dominated and hence unusable.
| Quadrant | # 1 sec bins | Bins with >0 counts | Bins with >2000 counts | High rate bins dominated by noise | Noise dominated (total time) | Noise dominated (detector-on time) | Marked lightcurve |
|---|---|---|---|---|---|---|---|
| A | 14946 | 14493 | 93 | 93 | 0.62% | 0.64% | 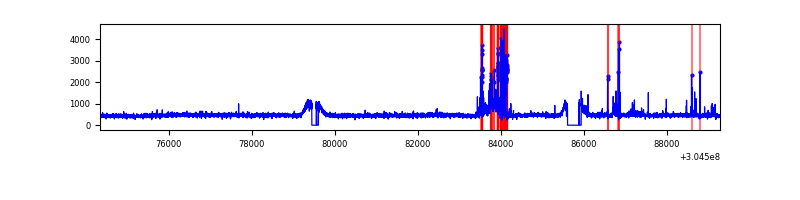 |
| B | 14947 | 14494 | 30 | 30 | 0.20% | 0.21% | 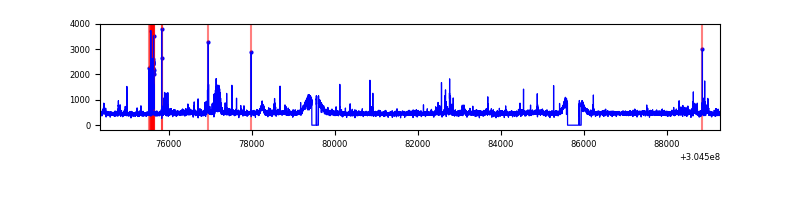 |
| C | 14947 | 14495 | 0 | 0 | 0.00% | 0.00% | 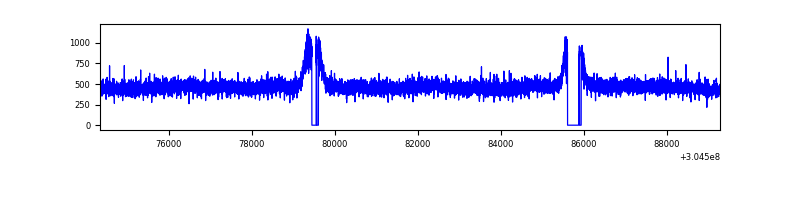 |
| D | 14947 | 14495 | 1667 | 1667 | 11.15% | 11.50% | 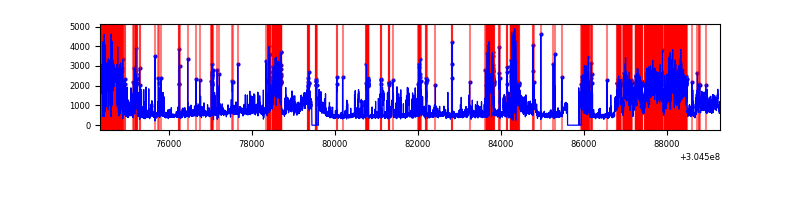 |
Top three noisy pixels from each quadrant. If the there are fewer than three noisy pixels in the level2.evt file, extra rows are filled as -1
| Pixel properties | Quadrant properties | ||||||
|---|---|---|---|---|---|---|---|
| Quadrant | DetID | PixID | Counts | Sigma | Mean | Median | Sigma |
| A | 5 | 16 | 570686 | 1603.29 | 1745 | 1707 | 354.9 |
| A | 13 | 252 | 64121 | 175.87 | 1745 | 1707 | 354.9 |
| A | 13 | 254 | 21053 | 54.51 | 1745 | 1707 | 354.9 |
| B | 3 | 64 | 150354 | 445.67 | 1748 | 1703 | 333.5 |
| B | 0 | 197 | 134058 | 396.82 | 1748 | 1703 | 333.5 |
| B | 0 | 189 | 89610 | 263.55 | 1748 | 1703 | 333.5 |
| C | 14 | 238 | 261245 | 656.94 | 1681 | 1694 | 395.1 |
| C | 7 | 220 | 17728 | 40.58 | 1681 | 1694 | 395.1 |
| C | 3 | 233 | 13125 | 28.93 | 1681 | 1694 | 395.1 |
| D | 13 | 174 | 2595412 | 6623.89 | 1609 | 1566 | 391.6 |
| D | 1 | 239 | 2047186 | 5223.89 | 1609 | 1566 | 391.6 |
| D | 5 | 222 | 990430 | 2525.26 | 1609 | 1566 | 391.6 |
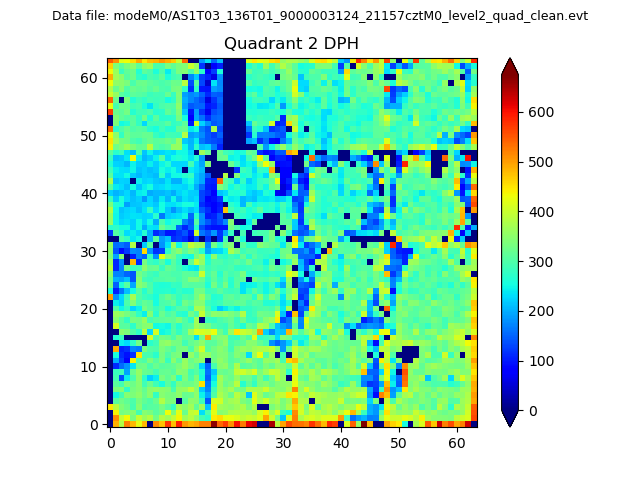
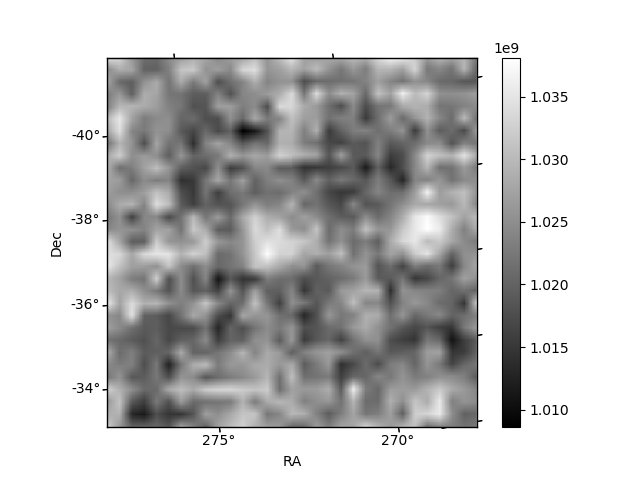
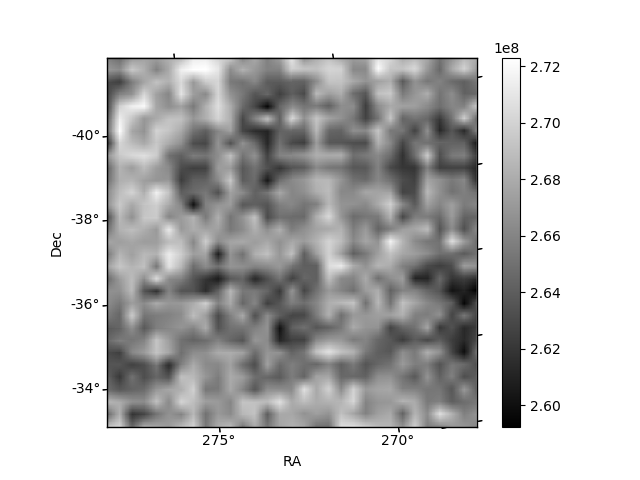
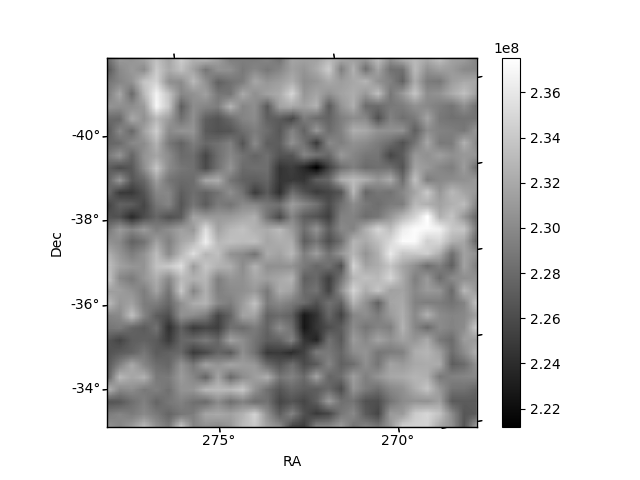
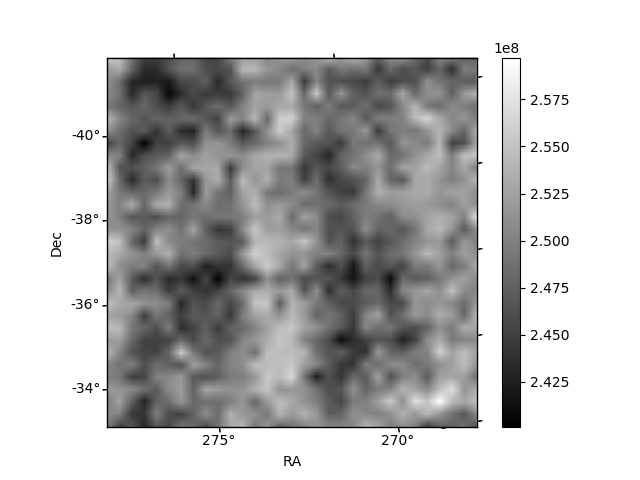
Histogram calculated using DETX and DETY for each event in the final _common_clean file
| Quadrant A | 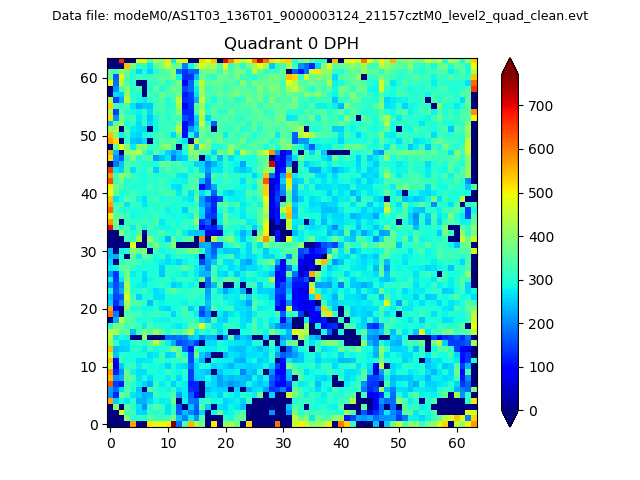 |
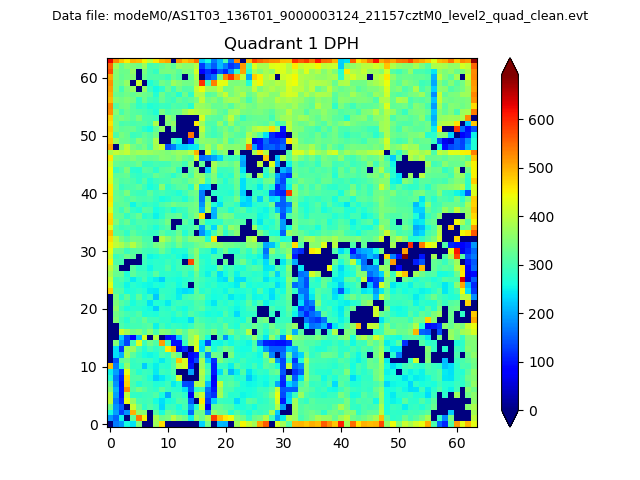 |
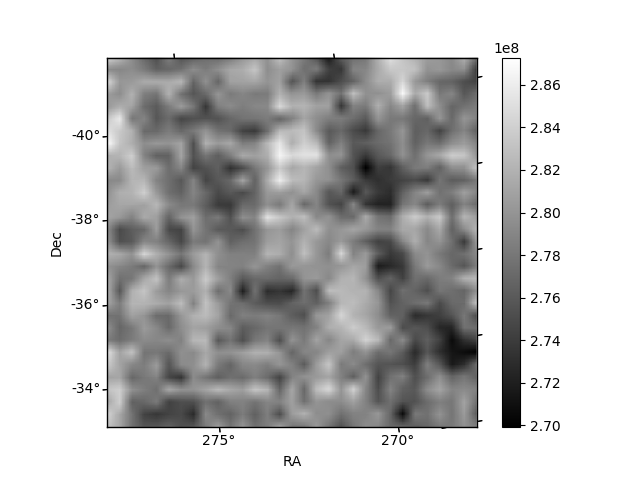
Quadrant B |
|---|---|---|---|
| Quadrant D | 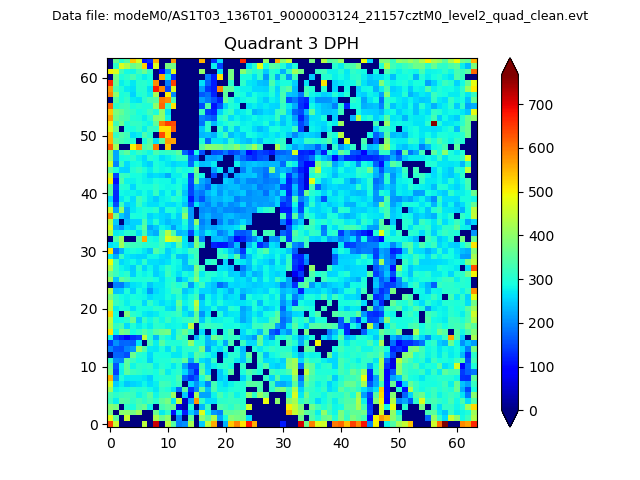 |
 |
Quadrant C |
| Plot type | Count rate plots | Images |
|---|---|---|
| Comparison with Poisson distribution Blue bars denote a histogram of data divided into 1 sec bins. Red curve is a Poisson curve with rate = median count rate of data. |
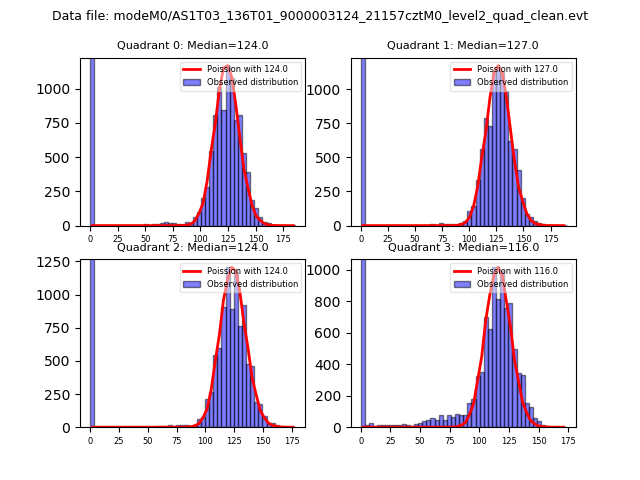 |
 |
| Quadrant-wise count rates Data is divided into 100 sec bins |
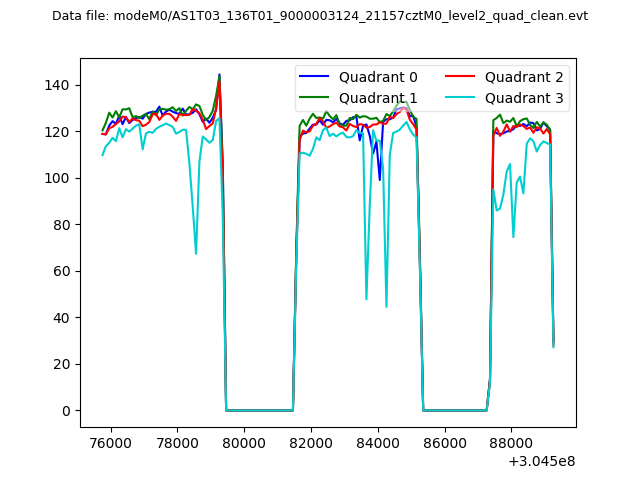 |
|
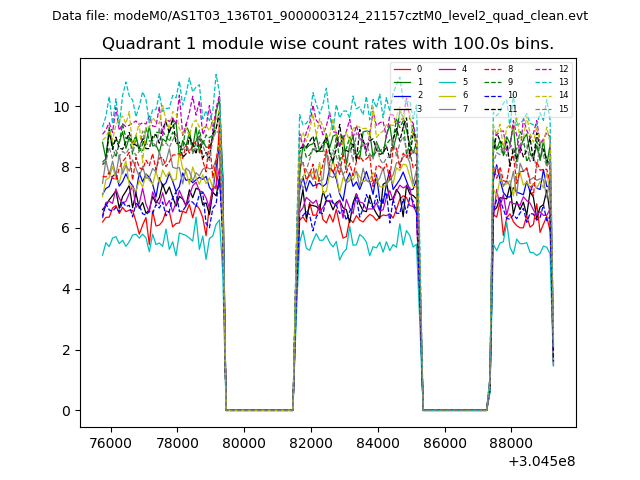
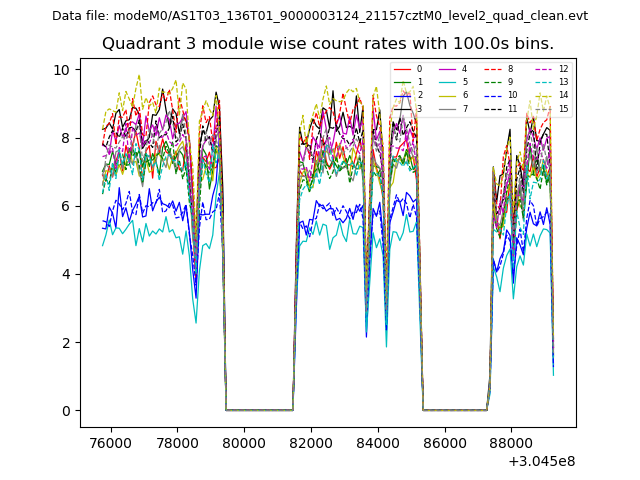
| Module-wise count rates for Quadrant A Data is divided into 100 sec bins |
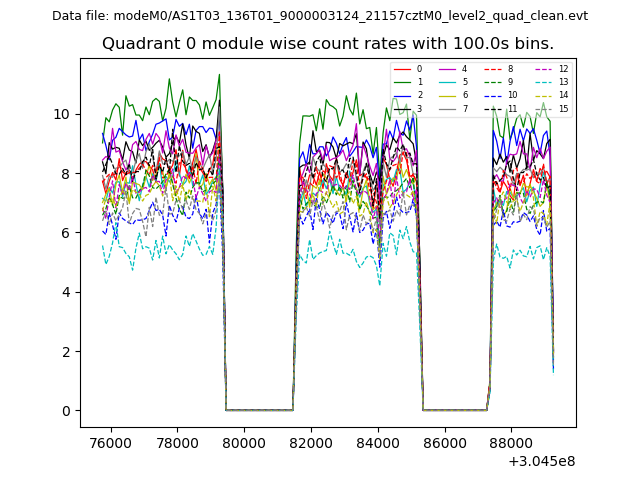 |
 |
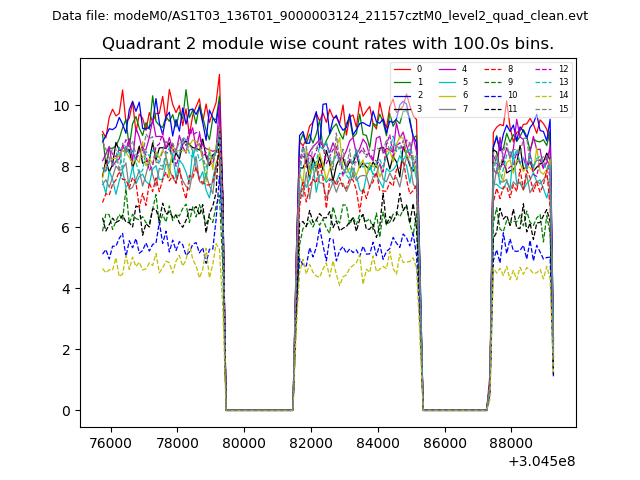
| Module-wise count rates for Quadrant B Data is divided into 100 sec bins |
 |
 |
| Module-wise count rates for Quadrant C Data is divided into 100 sec bins |
 |
 |
| Module-wise count rates for Quadrant D Data is divided into 100 sec bins |
 |
 |
| Parameter | Plot |
|---|---|
| CZT HV Monitor | 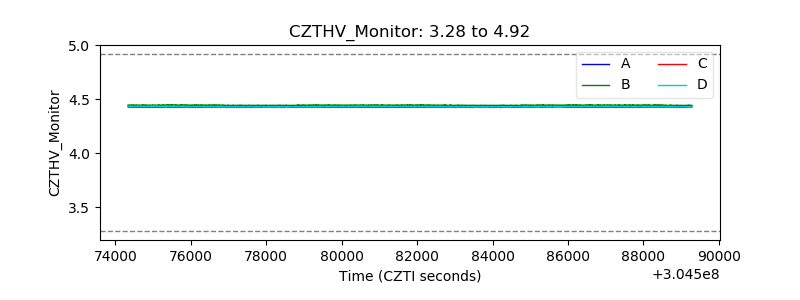 |
| D_VDD | 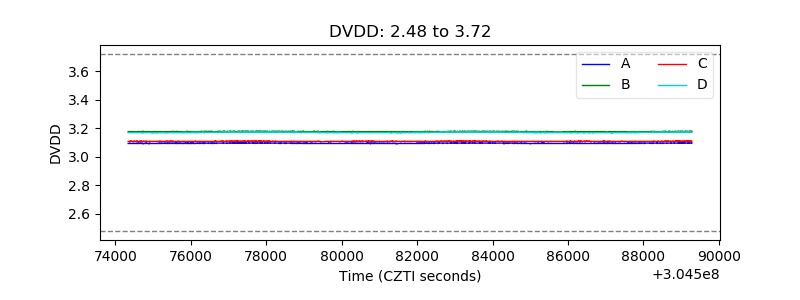 |
| Temperature 1 | 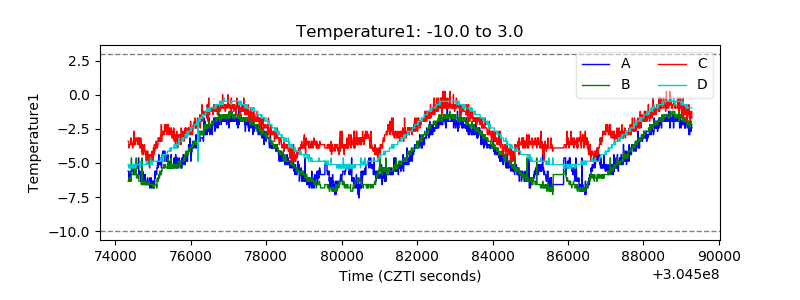 |
| Veto HV Monitor | 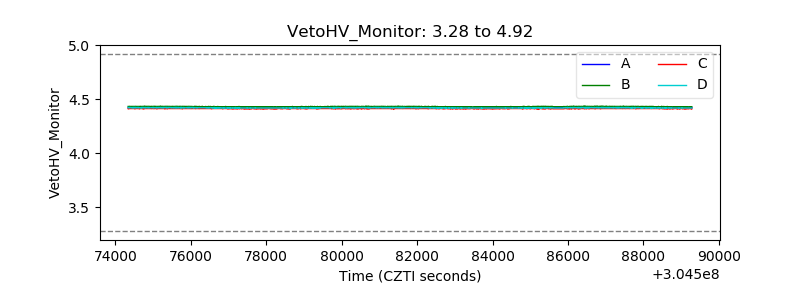 |
| Veto LLD | 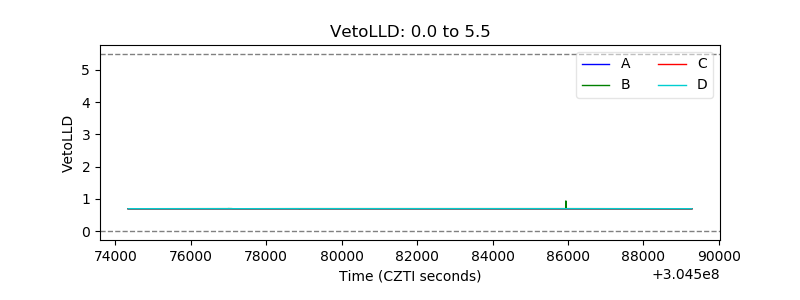 |
| Alpha Counter | 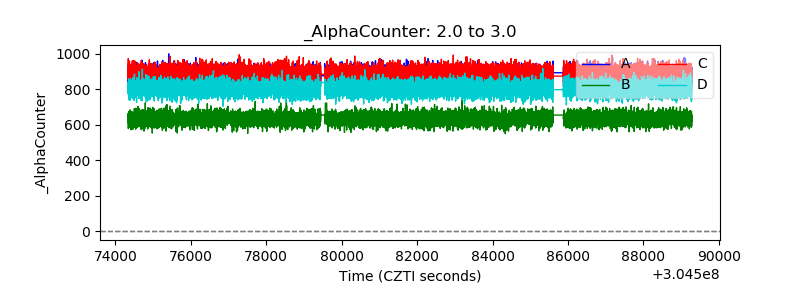 |
| _CPM_Rate | 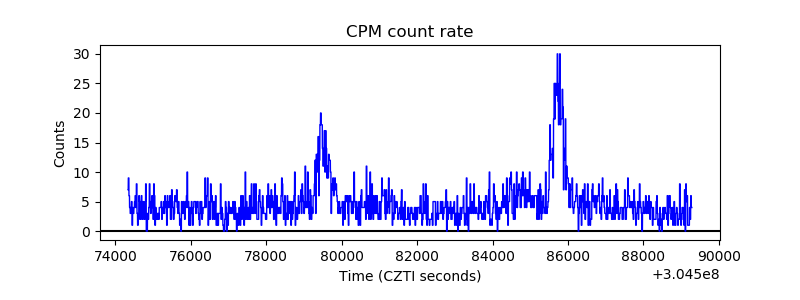 |
| CZT Counter |  |
| +2.5 Volts monitor |  |
| +5 Volts monitor |  |
| _ROLL_ROT | 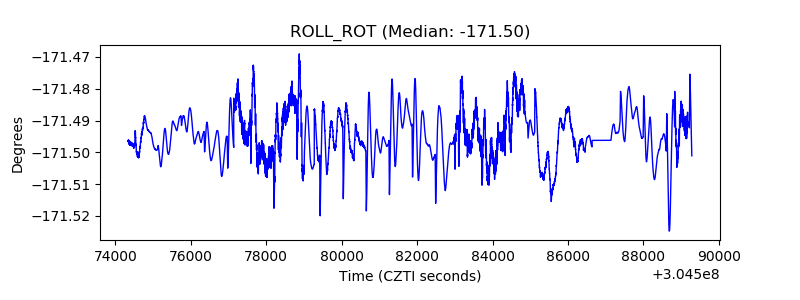 |
| _Roll_DEC | 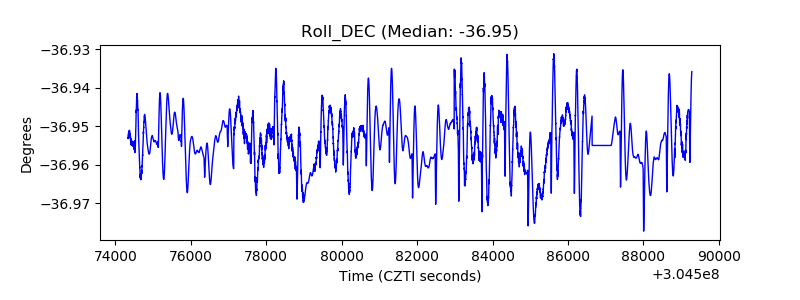 |
| _Roll_RA | 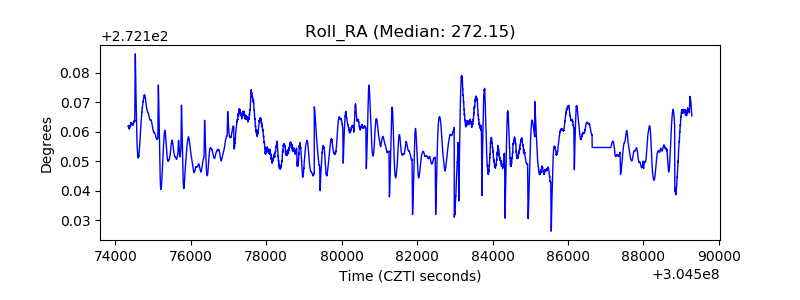 |
| Veto Counter | 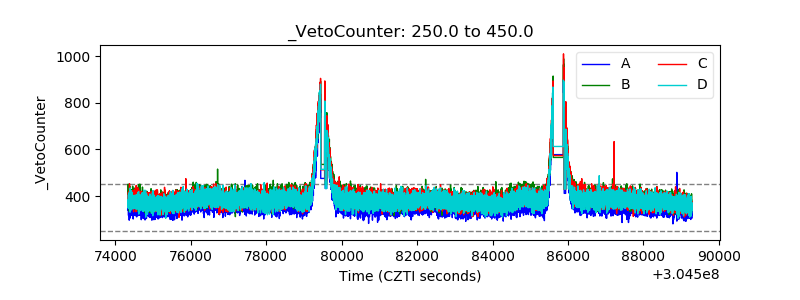 |