| Param | Original file | Final file |
|---|---|---|
| Filename | modeM0/AS1C04_001T01_9000003126_21155cztM0_level2.evt | modeM0/AS1C04_001T01_9000003126_21155cztM0_level2_quad_clean.evt |
| Size (bytes) | 617,492,160 | 155,926,080 |
| Size | 588.9 MB | 148.7 MB |
| Events in quadrant A | 3,962,849 | 1,061,099 |
| Events in quadrant B | 4,246,135 | 1,072,741 |
| Events in quadrant C | 3,949,329 | 1,027,214 |
| Events in quadrant D | 5,966,239 | 971,495 |
| Mode M9 | |||
|---|---|---|---|
| Quadrant | BADHDUFLAG | Total packets | Discarded packets |
| A | 0 | 13 | 0 |
| B | 0 | 13 | 0 |
| C | 0 | 13 | 0 |
| D | 0 | 13 | 0 |
| Mode M0 | |||
|---|---|---|---|
| Quadrant | BADHDUFLAG | Total packets | Discarded packets |
| A | 0 | 17405 | 2 |
| B | 0 | 17810 | 2 |
| C | 0 | 17287 | 2 |
| D | 0 | 23387 | 2 |
| Mode SS | |||
|---|---|---|---|
| Quadrant | BADHDUFLAG | Total packets | Discarded packets |
| A | 0 | 172 | 0 |
| B | 0 | 172 | 0 |
| C | 0 | 172 | 0 |
| D | 0 | 172 | 0 |
| Quadrant | Total seconds | Saturated seconds | Saturation percentage |
|---|---|---|---|
| A | 8503 | 117 | 1.375985% |
| B | 8503 | 100 | 1.176056% |
| C | 8502 | 103 | 1.211480% |
| D | 8502 | 526 | 6.186780% |
Noise dominated data is calculated using 1-second bins in cleaned event files. If a bin has >2000 counts, and if more than 50% of those come from <1% of pixels, then it is considered to be noise-dominated and hence unusable.
| Quadrant | # 1 sec bins | Bins with >0 counts | Bins with >2000 counts | High rate bins dominated by noise | Noise dominated (total time) | Noise dominated (detector-on time) | Marked lightcurve |
|---|---|---|---|---|---|---|---|
| A | 9748 | 8505 | 6 | 6 | 0.06% | 0.07% | 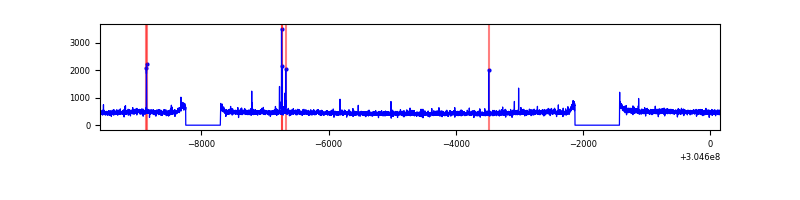 |
| B | 9748 | 8505 | 6 | 6 | 0.06% | 0.07% | 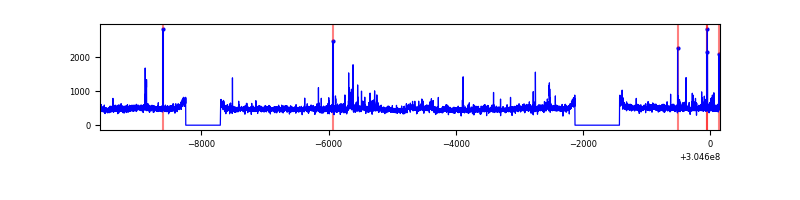 |
| C | 9747 | 8504 | 0 | 0 | 0.00% | 0.00% | 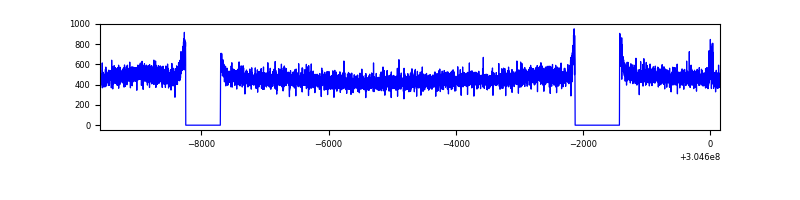 |
| D | 9747 | 8504 | 371 | 371 | 3.81% | 4.36% | 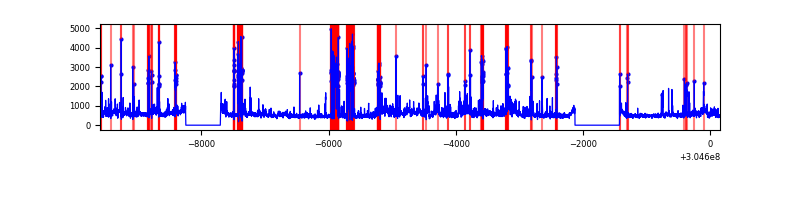 |
Top three noisy pixels from each quadrant. If the there are fewer than three noisy pixels in the level2.evt file, extra rows are filled as -1
| Pixel properties | Quadrant properties | ||||||
|---|---|---|---|---|---|---|---|
| Quadrant | DetID | PixID | Counts | Sigma | Mean | Median | Sigma |
| A | 5 | 16 | 41999 | 200.7 | 1014 | 990 | 204.3 |
| A | 13 | 254 | 11622 | 52.03 | 1014 | 990 | 204.3 |
| A | 0 | 226 | 8897 | 38.7 | 1014 | 990 | 204.3 |
| B | 0 | 189 | 81384 | 419.35 | 1010 | 985 | 191.7 |
| B | 3 | 64 | 40950 | 208.45 | 1010 | 985 | 191.7 |
| B | 0 | 190 | 40057 | 203.79 | 1010 | 985 | 191.7 |
| C | 14 | 238 | 151727 | 660.81 | 969 | 972 | 228.1 |
| C | 3 | 233 | 15915 | 65.5 | 969 | 972 | 228.1 |
| C | 13 | 61 | 6686 | 25.05 | 969 | 972 | 228.1 |
| D | 1 | 239 | 1455844 | 6269.37 | 951 | 919 | 232.1 |
| D | 1 | 20 | 217084 | 931.47 | 951 | 919 | 232.1 |
| D | 9 | 65 | 150391 | 644.09 | 951 | 919 | 232.1 |
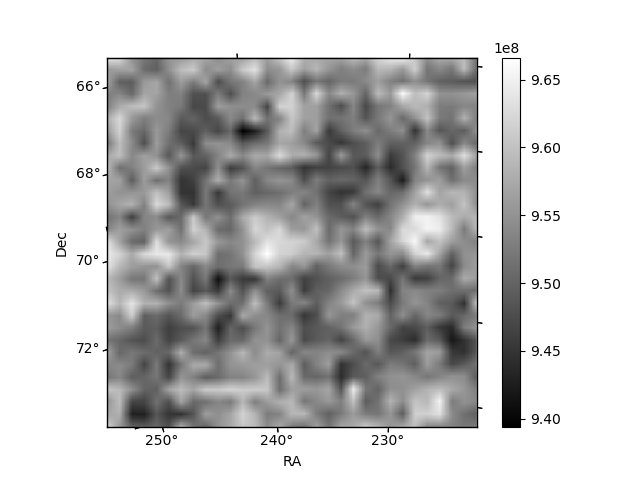
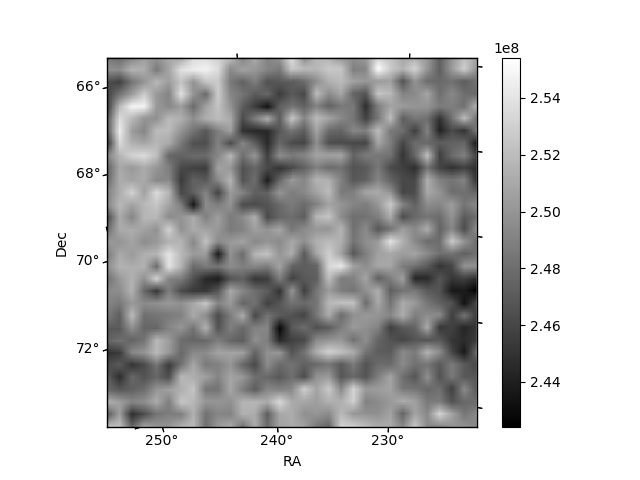
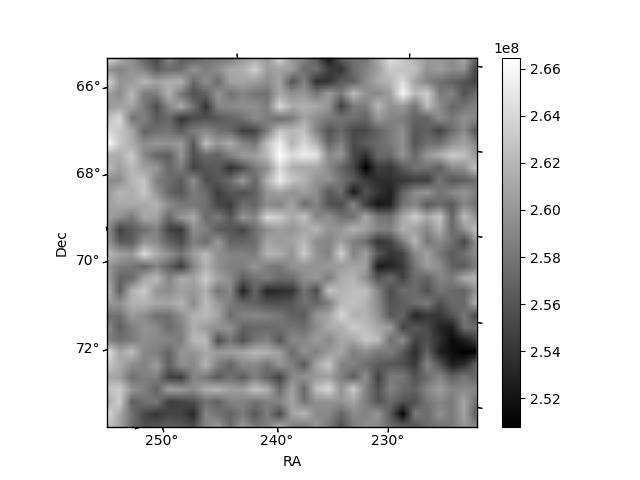
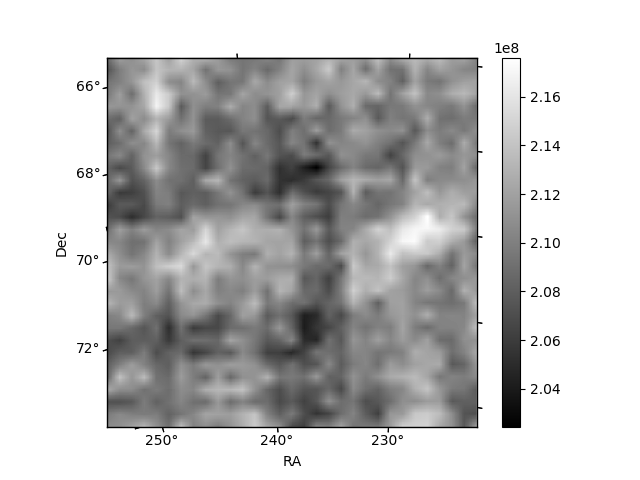
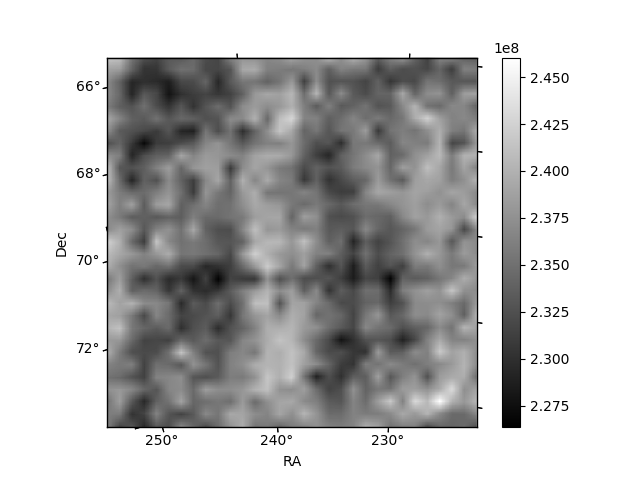
Histogram calculated using DETX and DETY for each event in the final _common_clean file
| Quadrant A | 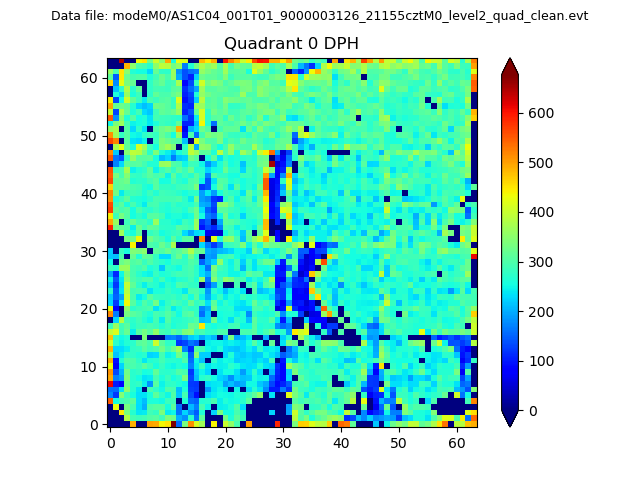 |
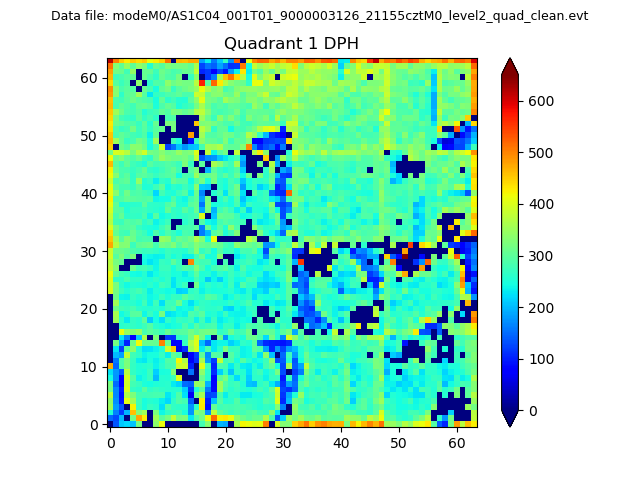 |
Quadrant B |
|---|---|---|---|
| Quadrant D | 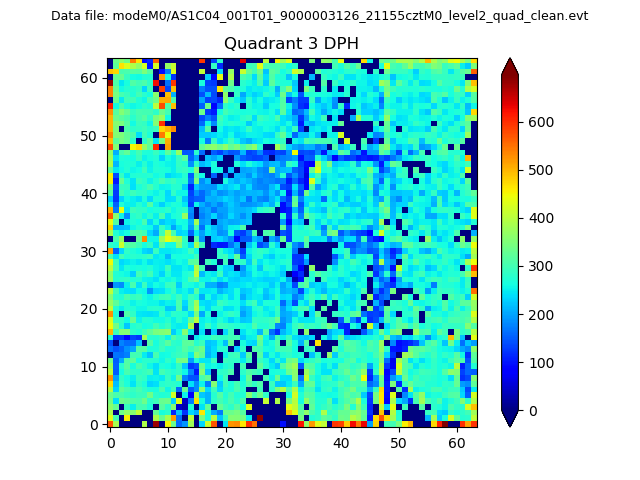 |
 |
Quadrant C |
| Plot type | Count rate plots | Images |
|---|---|---|
| Comparison with Poisson distribution Blue bars denote a histogram of data divided into 1 sec bins. Red curve is a Poisson curve with rate = median count rate of data. |
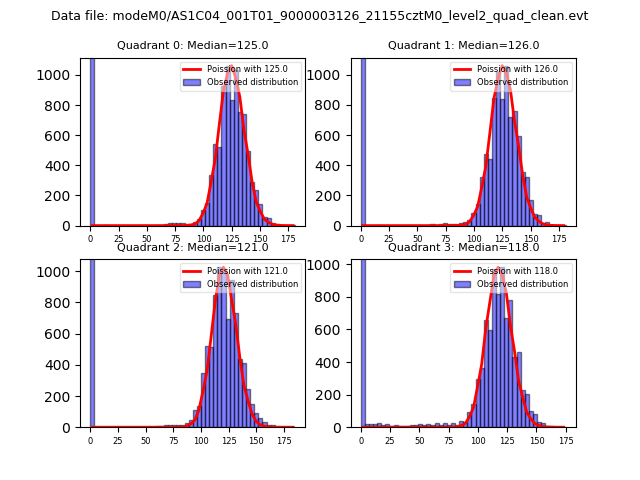 |
 |
| Quadrant-wise count rates Data is divided into 100 sec bins |
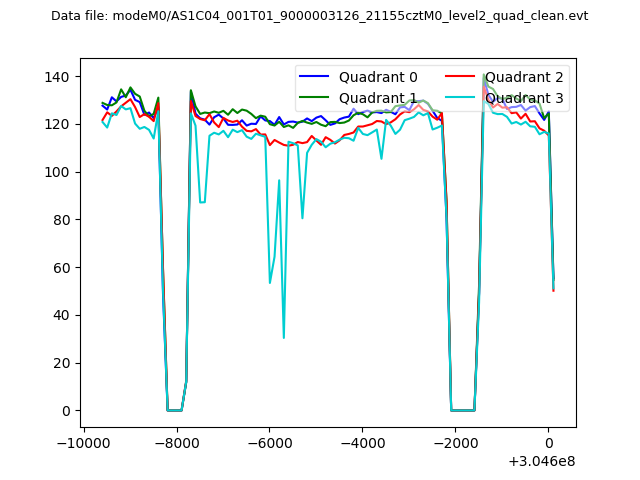 |
|
| Module-wise count rates for Quadrant A Data is divided into 100 sec bins |
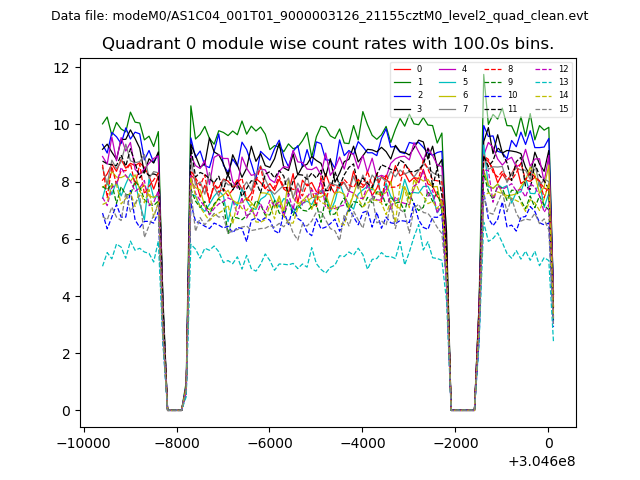 |
 |
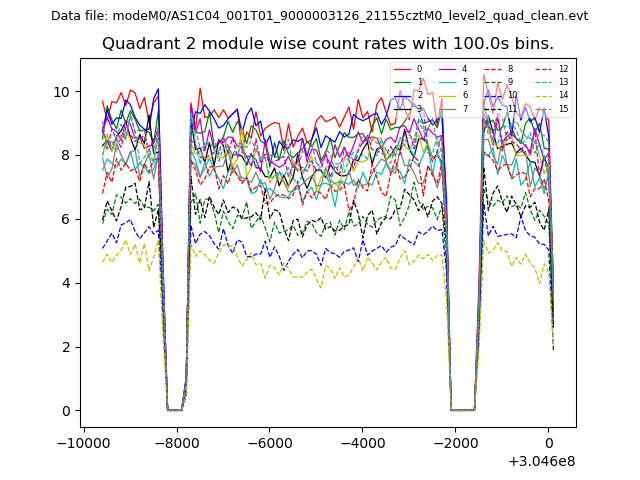
| Module-wise count rates for Quadrant B Data is divided into 100 sec bins |
 |
 |
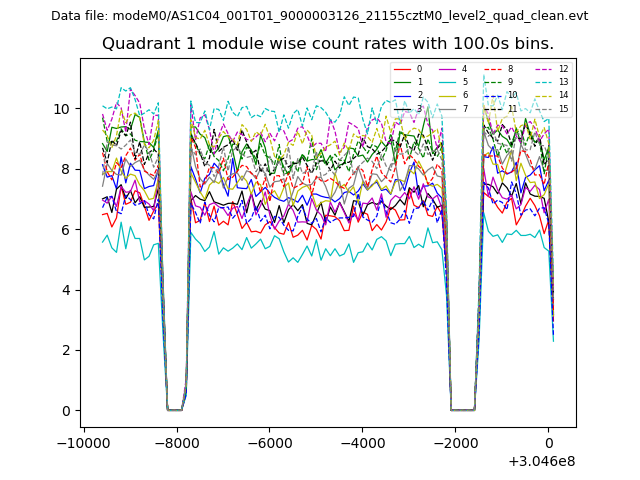
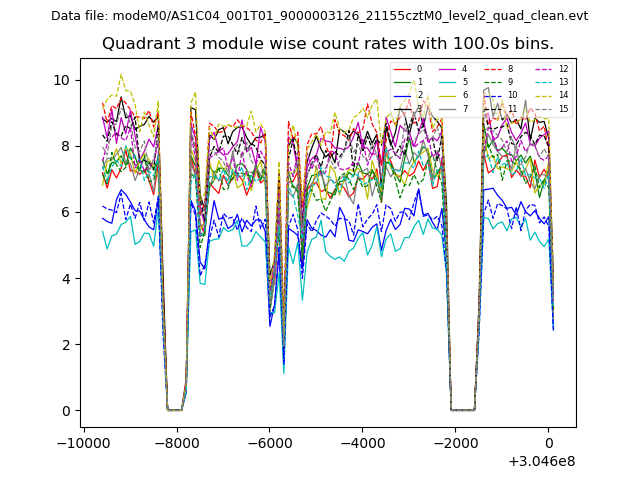
| Module-wise count rates for Quadrant C Data is divided into 100 sec bins |
 |
 |
| Module-wise count rates for Quadrant D Data is divided into 100 sec bins |
 |
 |
| Parameter | Plot |
|---|---|
| CZT HV Monitor | 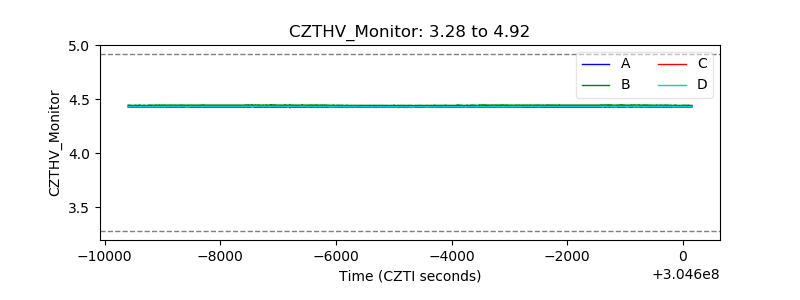 |
| D_VDD | 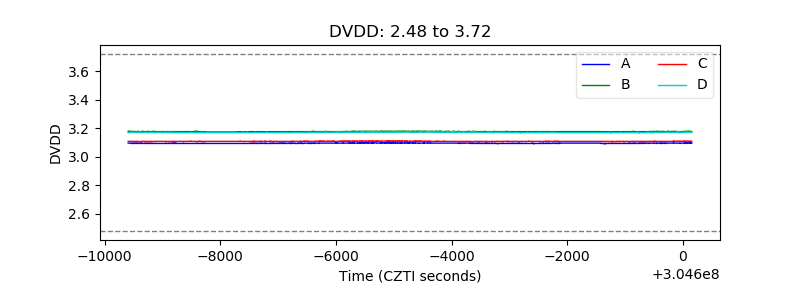 |
| Temperature 1 | 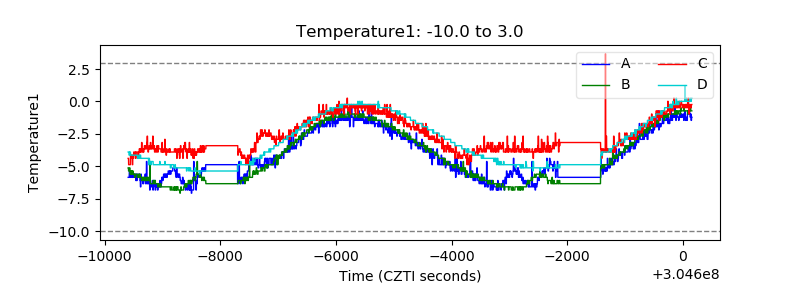 |
| Veto HV Monitor | 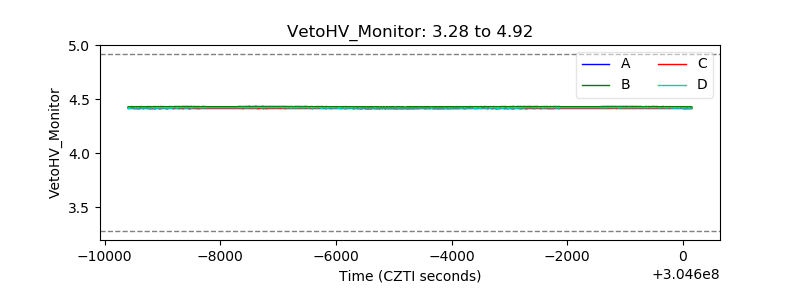 |
| Veto LLD | 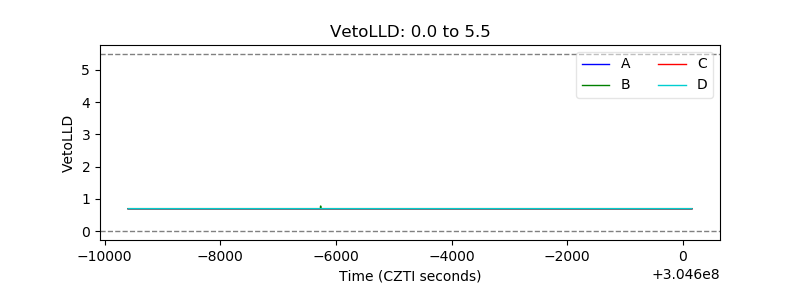 |
| Alpha Counter | 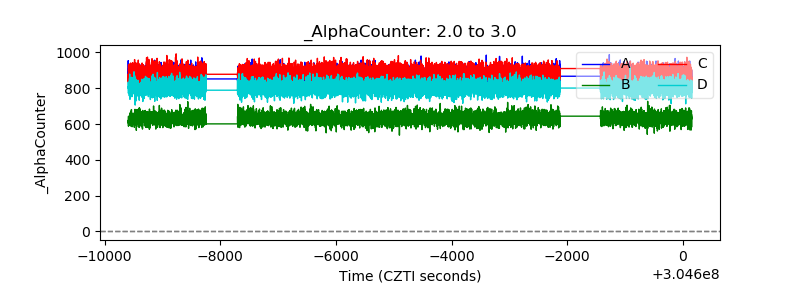 |
| _CPM_Rate | 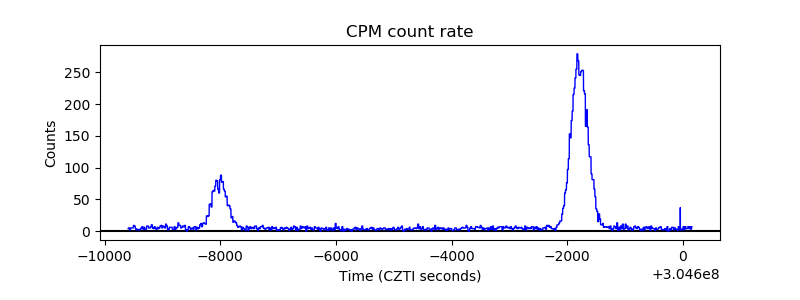 |
| CZT Counter | 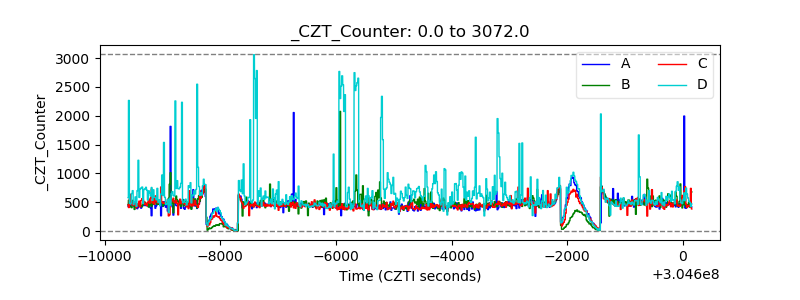 |
| +2.5 Volts monitor |  |
| +5 Volts monitor | 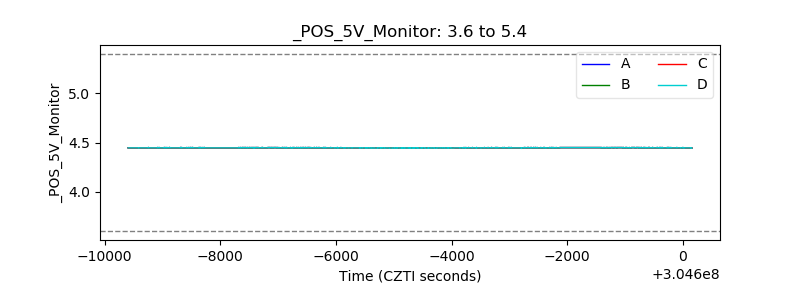 |
| _ROLL_ROT | 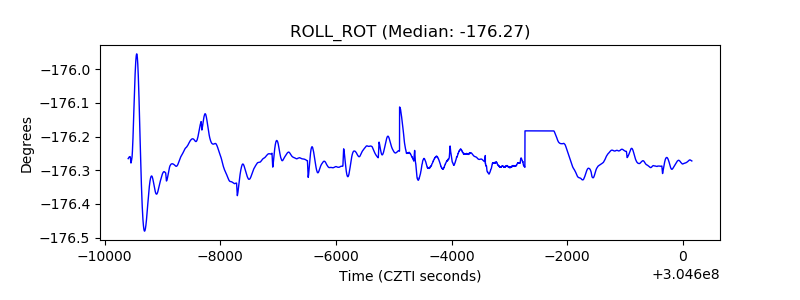 |
| _Roll_DEC | 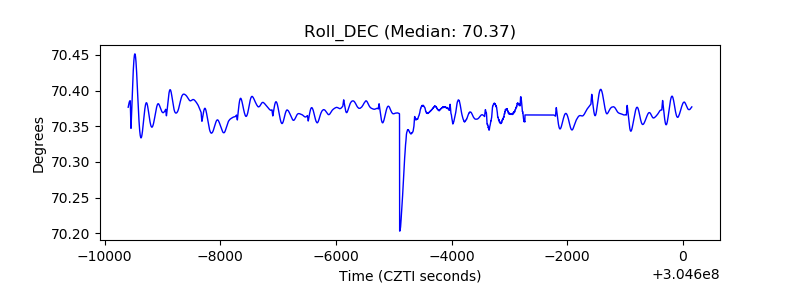 |
| _Roll_RA | 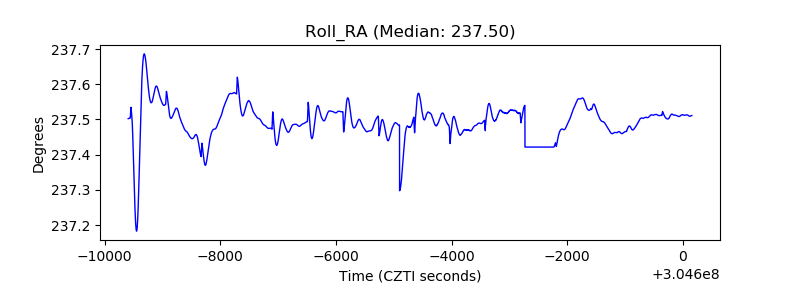 |
| Veto Counter | 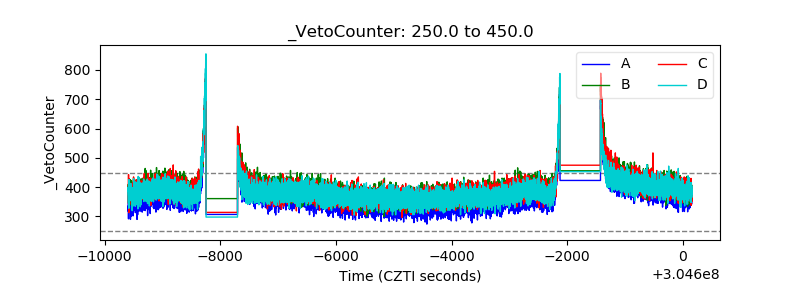 |