| Param | Original file | Final file |
|---|---|---|
| Filename | modeM0/AS1C04_001T01_9000003126_21156cztM0_level2.evt | modeM0/AS1C04_001T01_9000003126_21156cztM0_level2_quad_clean.evt |
| Size (bytes) | 590,051,520 | 121,285,440 |
| Size | 562.7 MB | 115.7 MB |
| Events in quadrant A | 3,178,899 | 866,215 |
| Events in quadrant B | 3,470,328 | 868,537 |
| Events in quadrant C | 3,162,161 | 831,143 |
| Events in quadrant D | 7,597,254 | 633,240 |
| Mode M9 | |||
|---|---|---|---|
| Quadrant | BADHDUFLAG | Total packets | Discarded packets |
| A | 0 | 9 | 0 |
| B | 0 | 9 | 0 |
| C | 0 | 9 | 0 |
| D | 0 | 9 | 0 |
| Mode M0 | |||
|---|---|---|---|
| Quadrant | BADHDUFLAG | Total packets | Discarded packets |
| A | 0 | 13969 | 1 |
| B | 0 | 14587 | 1 |
| C | 0 | 13826 | 1 |
| D | 0 | 27140 | 5 |
| Mode SS | |||
|---|---|---|---|
| Quadrant | BADHDUFLAG | Total packets | Discarded packets |
| A | 0 | 138 | 0 |
| B | 0 | 138 | 0 |
| C | 0 | 138 | 0 |
| D | 0 | 138 | 0 |
| Quadrant | Total seconds | Saturated seconds | Saturation percentage |
|---|---|---|---|
| A | 6796 | 50 | 0.735727% |
| B | 6796 | 55 | 0.809300% |
| C | 6796 | 56 | 0.824014% |
| D | 6795 | 1866 | 27.461369% |
Noise dominated data is calculated using 1-second bins in cleaned event files. If a bin has >2000 counts, and if more than 50% of those come from <1% of pixels, then it is considered to be noise-dominated and hence unusable.
| Quadrant | # 1 sec bins | Bins with >0 counts | Bins with >2000 counts | High rate bins dominated by noise | Noise dominated (total time) | Noise dominated (detector-on time) | Marked lightcurve |
|---|---|---|---|---|---|---|---|
| A | 7696 | 6796 | 6 | 6 | 0.08% | 0.09% | 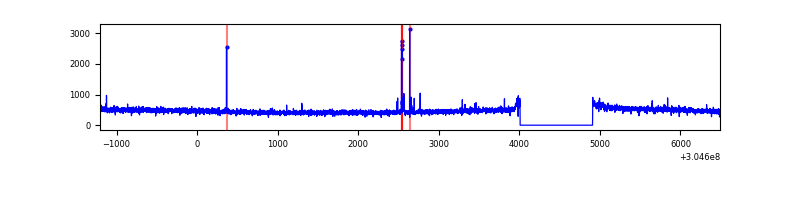 |
| B | 7696 | 6797 | 12 | 12 | 0.16% | 0.18% | 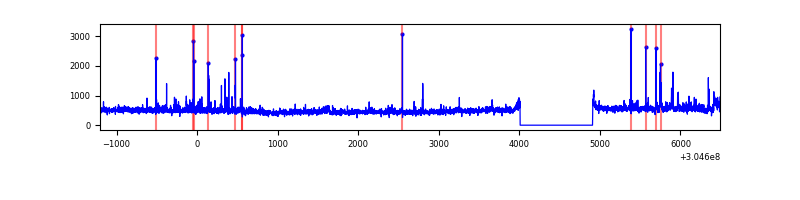 |
| C | 7696 | 6797 | 0 | 0 | 0.00% | 0.00% | 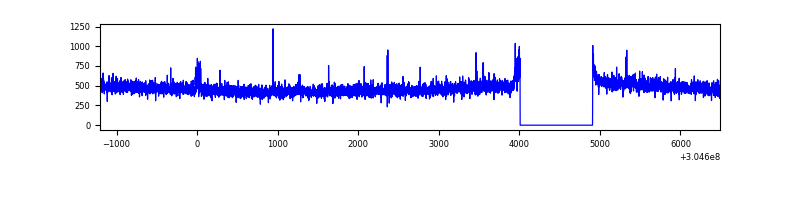 |
| D | 7694 | 6794 | 1667 | 1667 | 21.67% | 24.54% | 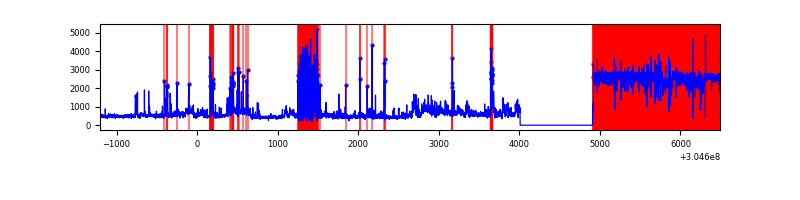 |
Top three noisy pixels from each quadrant. If the there are fewer than three noisy pixels in the level2.evt file, extra rows are filled as -1
| Pixel properties | Quadrant properties | ||||||
|---|---|---|---|---|---|---|---|
| Quadrant | DetID | PixID | Counts | Sigma | Mean | Median | Sigma |
| A | 5 | 16 | 41508 | 249.56 | 809 | 788 | 163.2 |
| A | 13 | 252 | 16430 | 95.87 | 809 | 788 | 163.2 |
| A | 13 | 254 | 8764 | 48.88 | 809 | 788 | 163.2 |
| B | 0 | 189 | 72129 | 470.52 | 803 | 784 | 151.6 |
| B | 0 | 190 | 51891 | 337.05 | 803 | 784 | 151.6 |
| B | 0 | 229 | 38718 | 250.17 | 803 | 784 | 151.6 |
| C | 14 | 238 | 121251 | 666.71 | 771 | 776 | 180.7 |
| C | 3 | 233 | 30149 | 162.55 | 771 | 776 | 180.7 |
| C | 13 | 61 | 5408 | 25.63 | 771 | 776 | 180.7 |
| D | 1 | 239 | 4574922 | 30291.09 | 623 | 602 | 151.0 |
| D | 7 | 238 | 398636 | 2635.78 | 623 | 602 | 151.0 |
| D | 1 | 20 | 71239 | 467.76 | 623 | 602 | 151.0 |
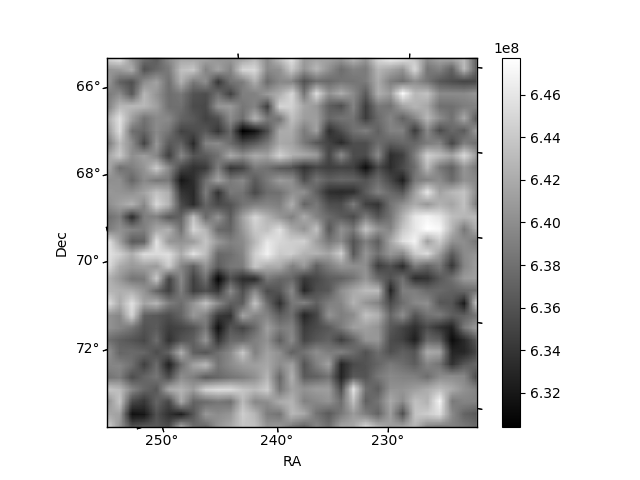
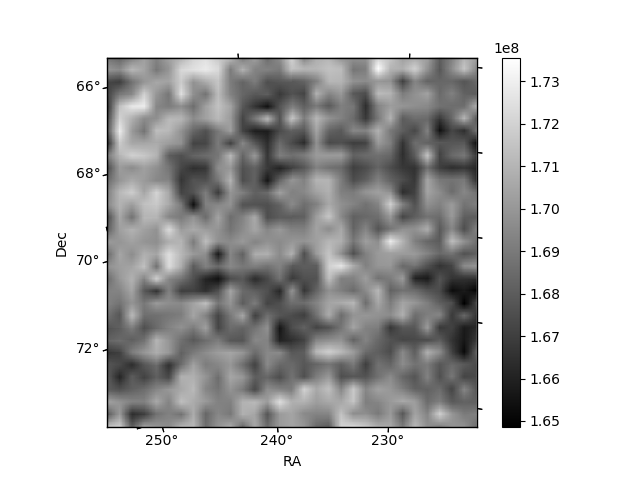
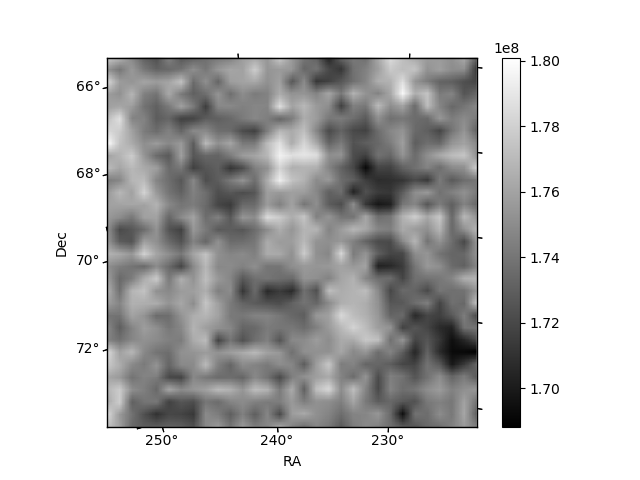
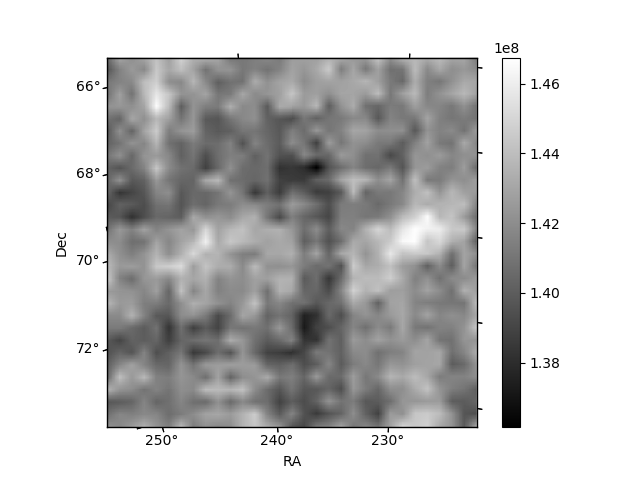
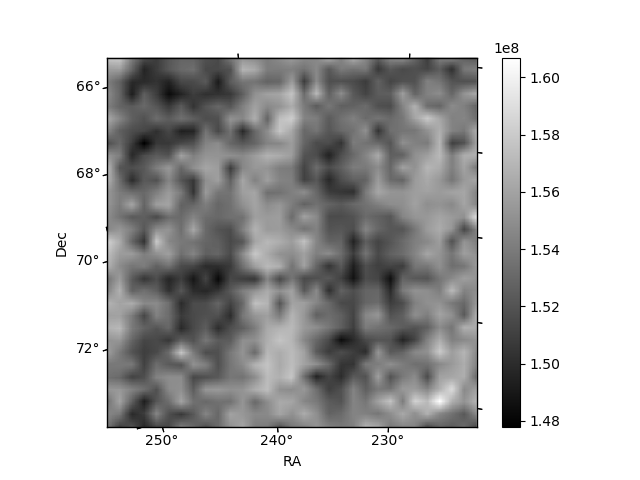
Histogram calculated using DETX and DETY for each event in the final _common_clean file
| Quadrant A | 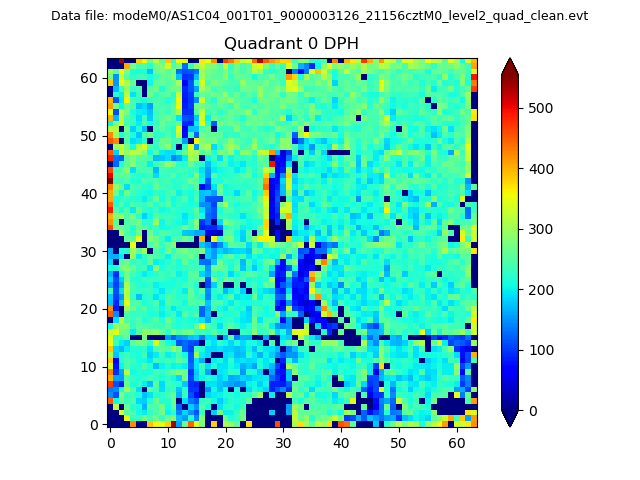 |
 |
Quadrant B |
|---|---|---|---|
| Quadrant D | 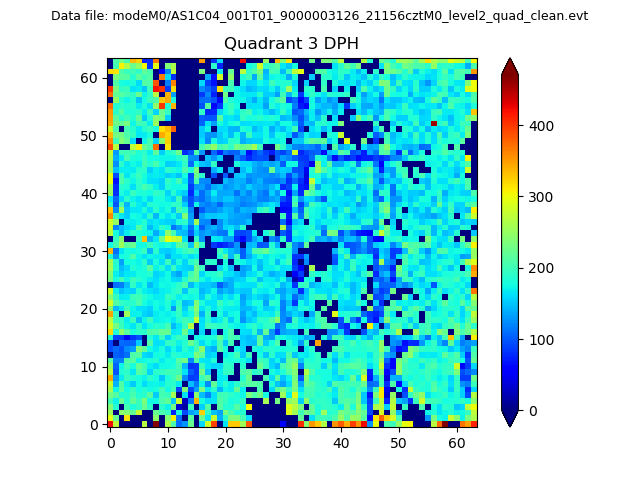 |
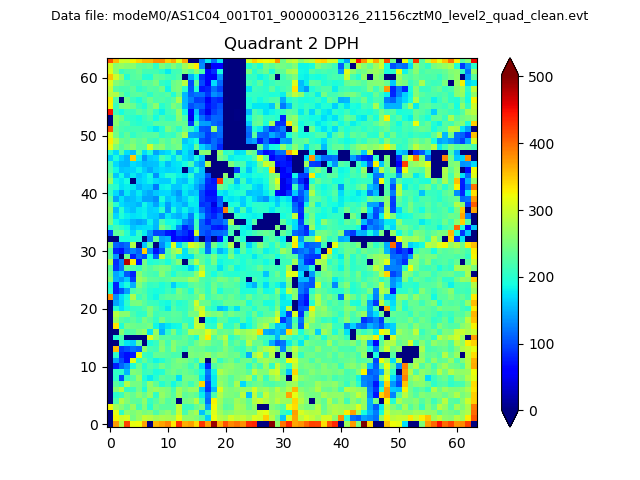 |
Quadrant C |
| Plot type | Count rate plots | Images |
|---|---|---|
| Comparison with Poisson distribution Blue bars denote a histogram of data divided into 1 sec bins. Red curve is a Poisson curve with rate = median count rate of data. |
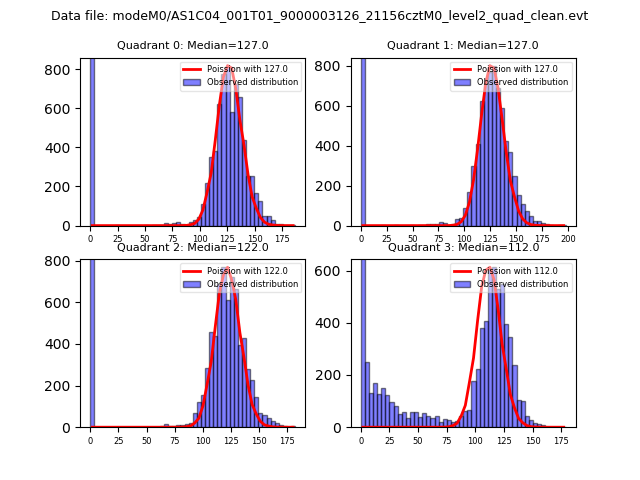 |
 |
| Quadrant-wise count rates Data is divided into 100 sec bins |
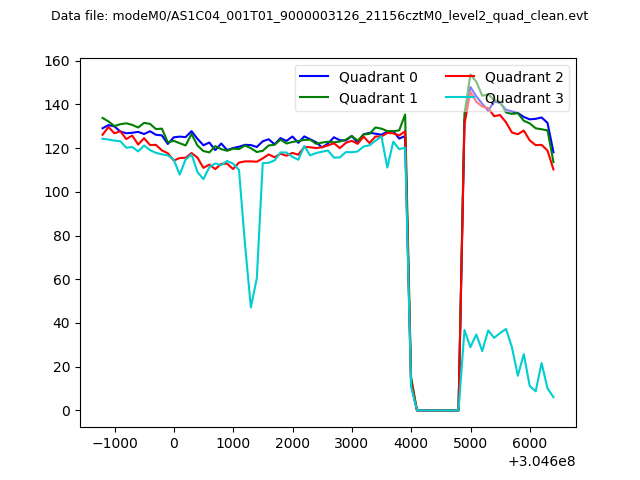 |
|
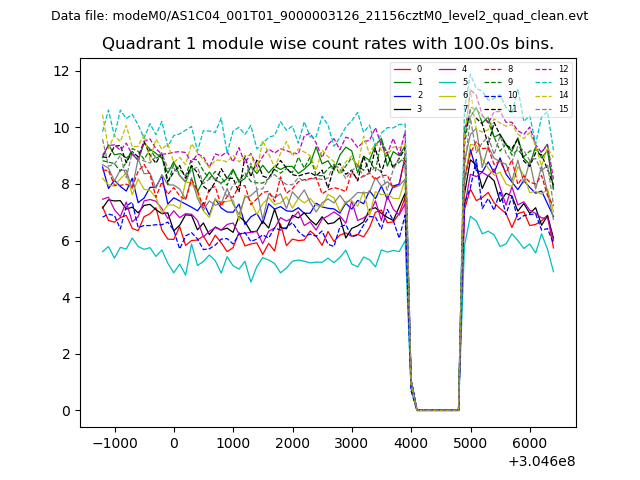
| Module-wise count rates for Quadrant A Data is divided into 100 sec bins |
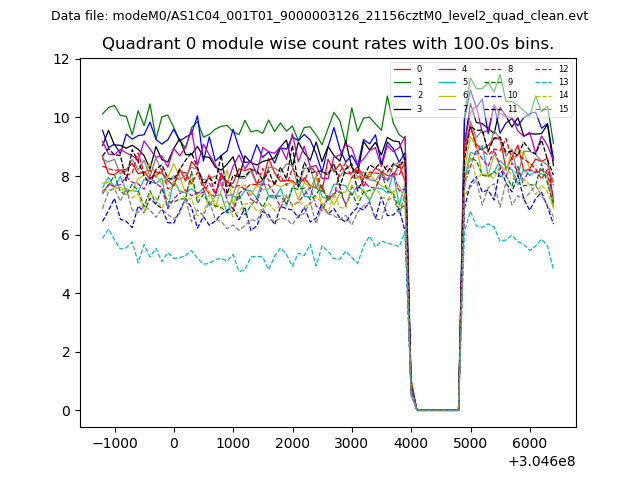 |
 |
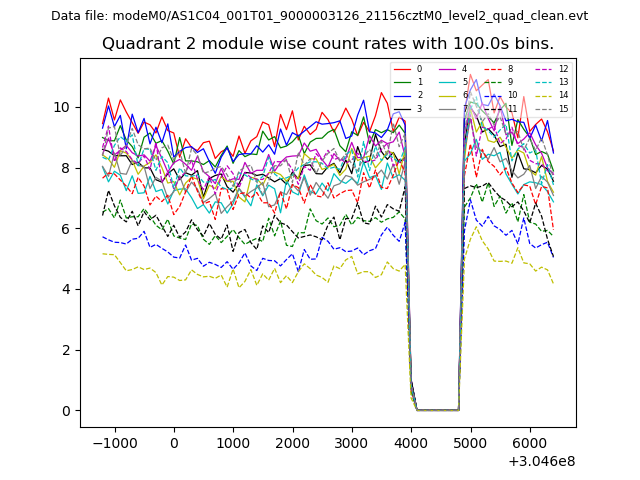
| Module-wise count rates for Quadrant B Data is divided into 100 sec bins |
 |
 |
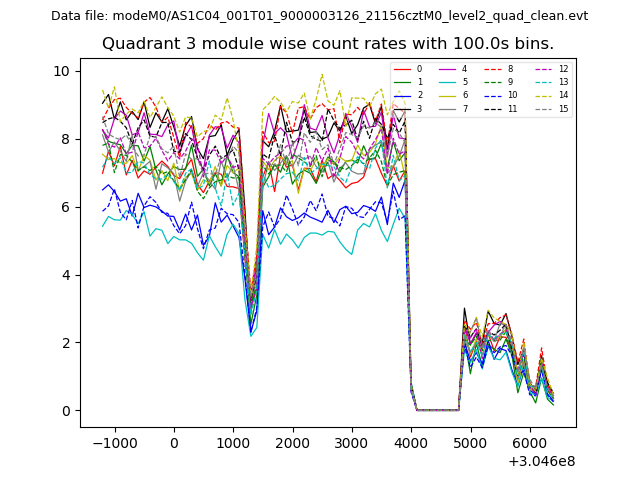
| Module-wise count rates for Quadrant C Data is divided into 100 sec bins |
 |
 |
| Module-wise count rates for Quadrant D Data is divided into 100 sec bins |
 |
 |
| Parameter | Plot |
|---|---|
| CZT HV Monitor | 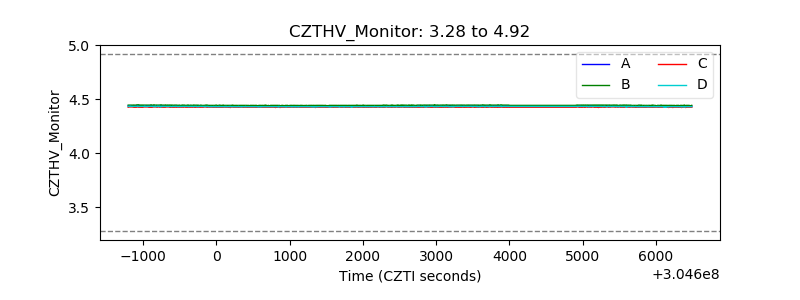 |
| D_VDD | 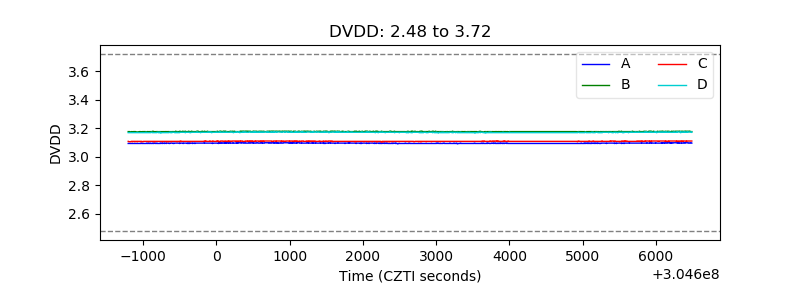 |
| Temperature 1 |  |
| Veto HV Monitor | 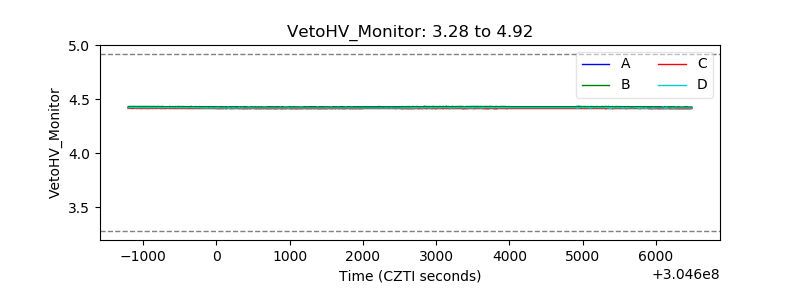 |
| Veto LLD |  |
| Alpha Counter | 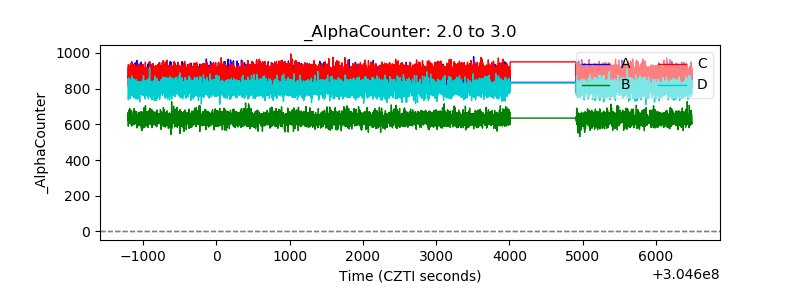 |
| _CPM_Rate |  |
| CZT Counter | 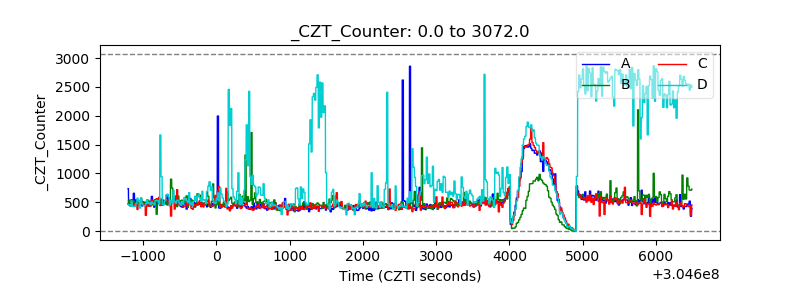 |
| +2.5 Volts monitor |  |
| +5 Volts monitor | 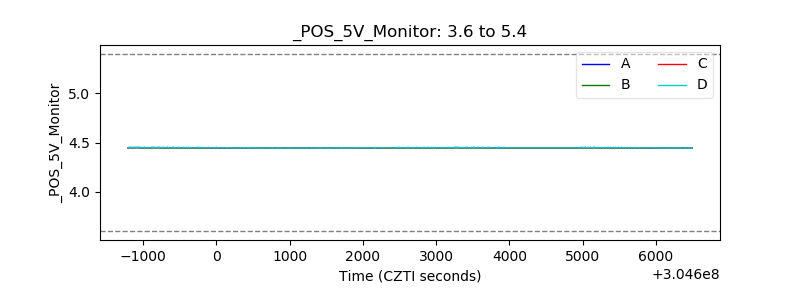 |
| _ROLL_ROT | 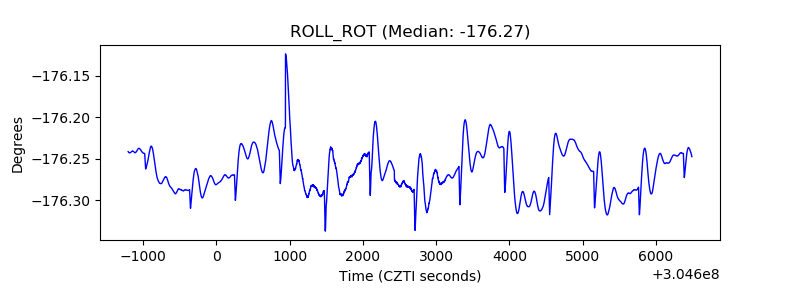 |
| _Roll_DEC | 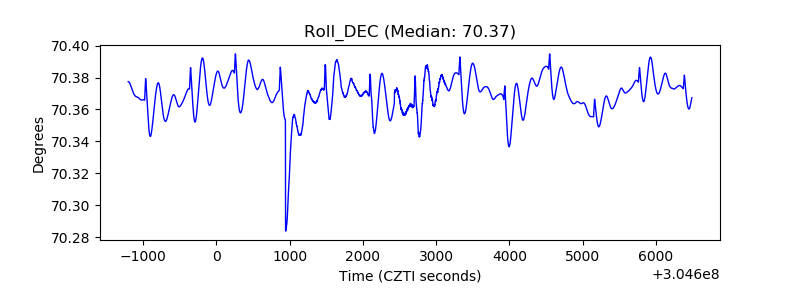 |
| _Roll_RA |  |
| Veto Counter | 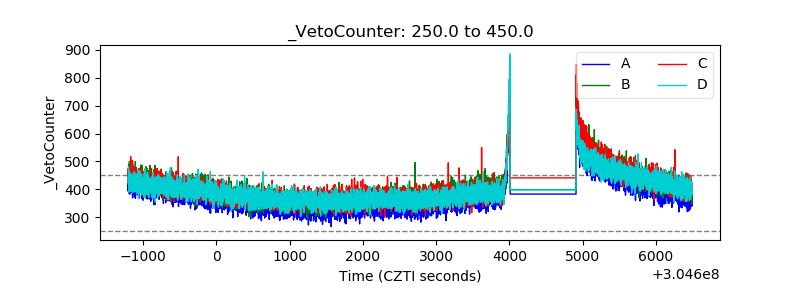 |