| Param | Original file | Final file |
|---|---|---|
| Filename | modeM0/AS1C04_001T01_9000003126_21157cztM0_level2.evt | modeM0/AS1C04_001T01_9000003126_21157cztM0_level2_quad_clean.evt |
| Size (bytes) | 1,706,120,640 | 343,779,840 |
| Size | 1.6 GB | 327.9 MB |
| Events in quadrant A | 8,883,695 | 2,432,187 |
| Events in quadrant B | 9,715,329 | 2,444,955 |
| Events in quadrant C | 8,881,584 | 2,345,879 |
| Events in quadrant D | 22,902,883 | 1,874,671 |
| Mode M9 | |||
|---|---|---|---|
| Quadrant | BADHDUFLAG | Total packets | Discarded packets |
| A | 0 | 33 | 0 |
| B | 0 | 33 | 0 |
| C | 0 | 33 | 0 |
| D | 0 | 33 | 0 |
| Mode M0 | |||
|---|---|---|---|
| Quadrant | BADHDUFLAG | Total packets | Discarded packets |
| A | 0 | 39377 | 4 |
| B | 0 | 41120 | 4 |
| C | 0 | 39001 | 4 |
| D | 0 | 81046 | 4 |
| Mode SS | |||
|---|---|---|---|
| Quadrant | BADHDUFLAG | Total packets | Discarded packets |
| A | 0 | 386 | 0 |
| B | 0 | 386 | 0 |
| C | 0 | 386 | 0 |
| D | 0 | 386 | 0 |
| Quadrant | Total seconds | Saturated seconds | Saturation percentage |
|---|---|---|---|
| A | 19075 | 215 | 1.127130% |
| B | 19075 | 190 | 0.996068% |
| C | 19075 | 213 | 1.116645% |
| D | 19075 | 5281 | 27.685452% |
Noise dominated data is calculated using 1-second bins in cleaned event files. If a bin has >2000 counts, and if more than 50% of those come from <1% of pixels, then it is considered to be noise-dominated and hence unusable.
| Quadrant | # 1 sec bins | Bins with >0 counts | Bins with >2000 counts | High rate bins dominated by noise | Noise dominated (total time) | Noise dominated (detector-on time) | Marked lightcurve |
|---|---|---|---|---|---|---|---|
| A | 22275 | 19078 | 21 | 21 | 0.09% | 0.11% | 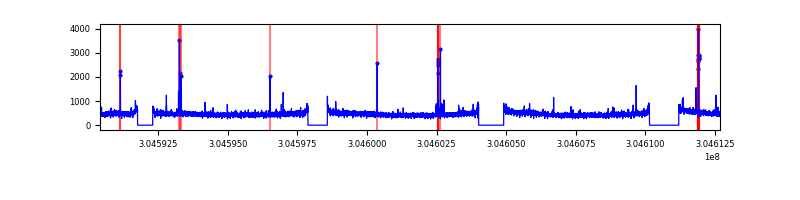 |
| B | 22275 | 19079 | 17 | 17 | 0.08% | 0.09% | 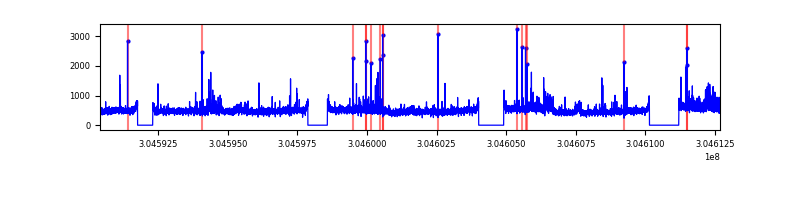 |
| C | 22275 | 19079 | 0 | 0 | 0.00% | 0.00% | 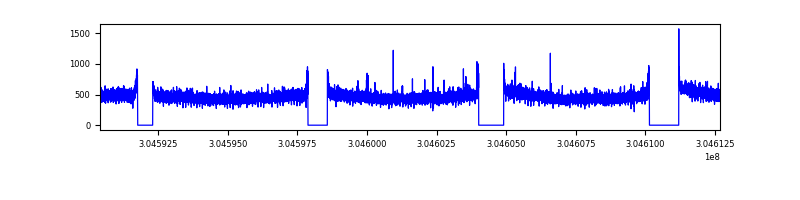 |
| D | 22275 | 19077 | 4614 | 4614 | 20.71% | 24.19% | 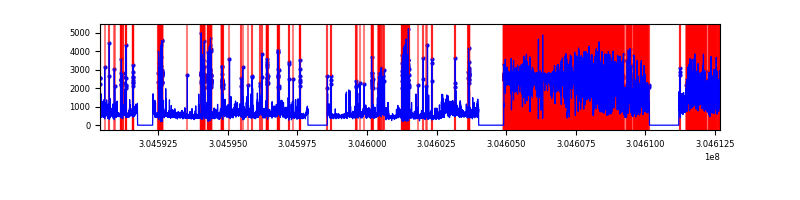 |
Top three noisy pixels from each quadrant. If the there are fewer than three noisy pixels in the level2.evt file, extra rows are filled as -1
| Pixel properties | Quadrant properties | ||||||
|---|---|---|---|---|---|---|---|
| Quadrant | DetID | PixID | Counts | Sigma | Mean | Median | Sigma |
| A | 5 | 16 | 123029 | 264.93 | 2267 | 2214 | 456.0 |
| A | 13 | 254 | 24331 | 48.5 | 2267 | 2214 | 456.0 |
| A | 13 | 252 | 20175 | 39.39 | 2267 | 2214 | 456.0 |
| B | 0 | 189 | 305772 | 722.05 | 2259 | 2203 | 420.4 |
| B | 0 | 229 | 130308 | 304.7 | 2259 | 2203 | 420.4 |
| B | 0 | 190 | 126913 | 296.63 | 2259 | 2203 | 420.4 |
| C | 14 | 238 | 341975 | 672.07 | 2175 | 2182 | 505.6 |
| C | 3 | 233 | 51762 | 98.06 | 2175 | 2182 | 505.6 |
| C | 13 | 61 | 15211 | 25.77 | 2175 | 2182 | 505.6 |
| D | 1 | 239 | 13973549 | 31229.42 | 1858 | 1797 | 447.4 |
| D | 7 | 238 | 642686 | 1432.5 | 1858 | 1797 | 447.4 |
| D | 1 | 20 | 306528 | 681.13 | 1858 | 1797 | 447.4 |
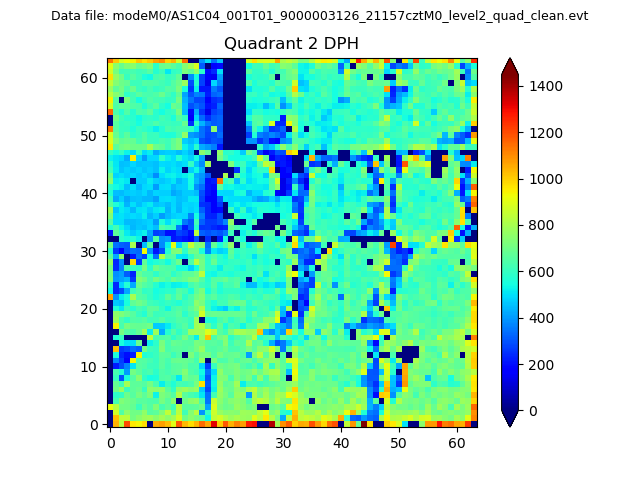
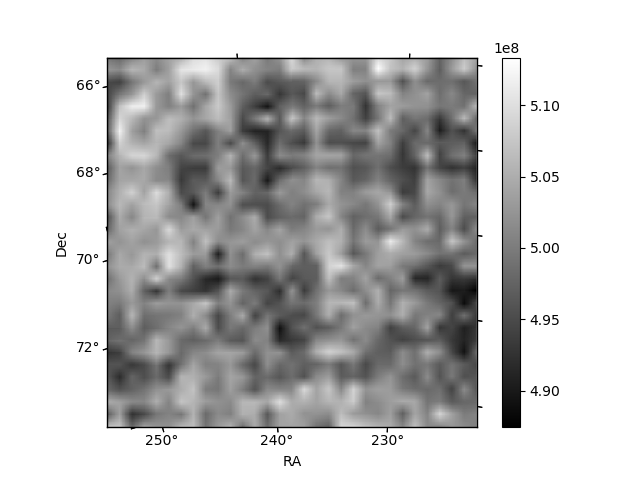
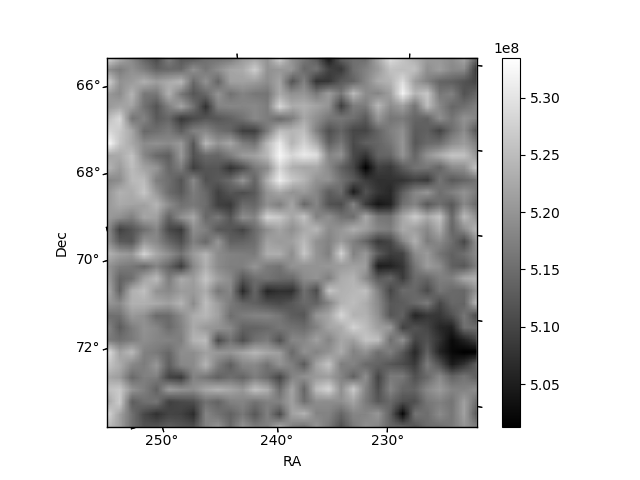
Histogram calculated using DETX and DETY for each event in the final _common_clean file
| Quadrant A |  |
 |
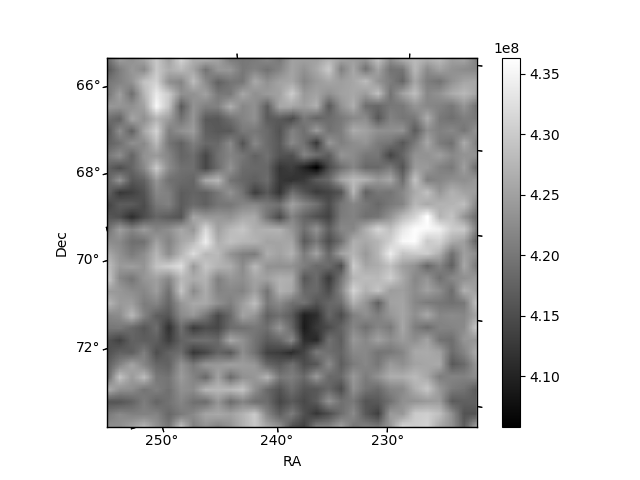
Quadrant B |
|---|---|---|---|
| Quadrant D |  |
 |
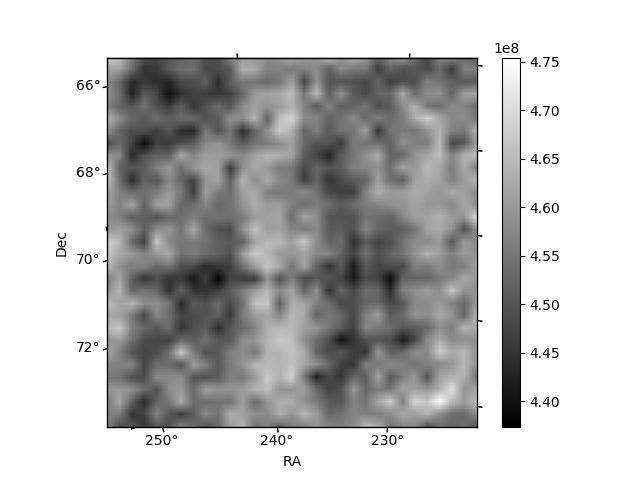
Quadrant C |
| Plot type | Count rate plots | Images |
|---|---|---|
| Comparison with Poisson distribution Blue bars denote a histogram of data divided into 1 sec bins. Red curve is a Poisson curve with rate = median count rate of data. |
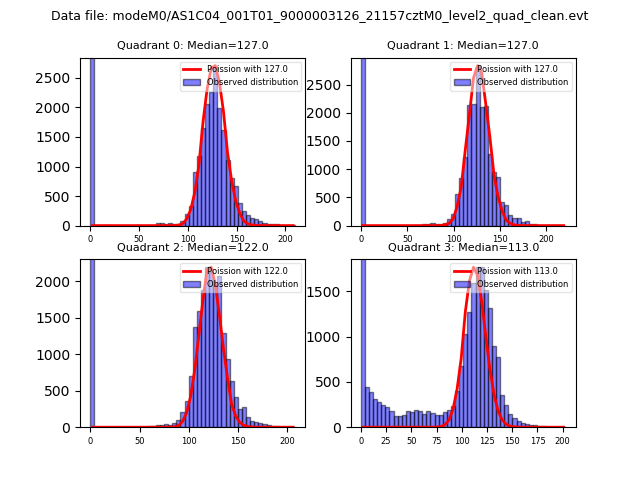 |
 |
| Quadrant-wise count rates Data is divided into 100 sec bins |
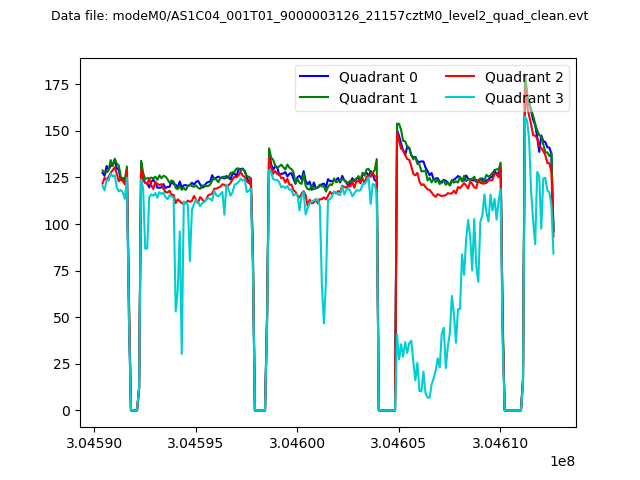 |
|
| Module-wise count rates for Quadrant A Data is divided into 100 sec bins |
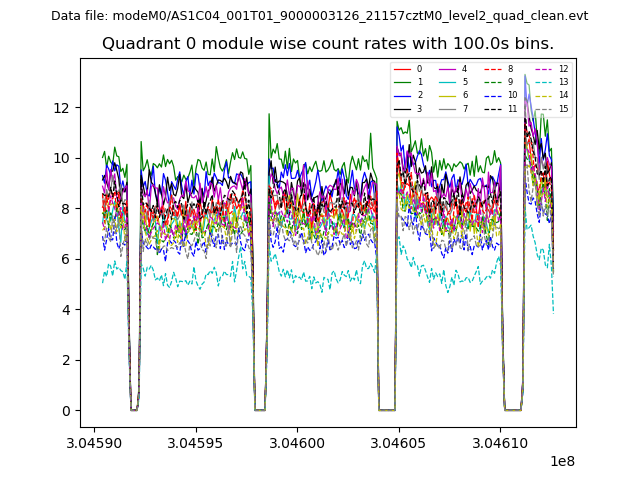 |
 |
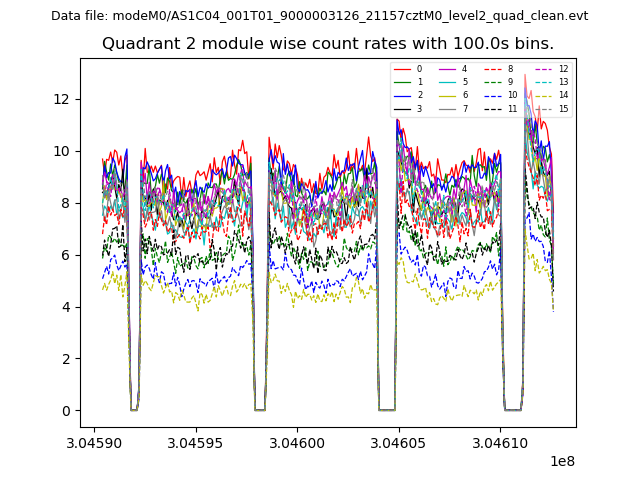
| Module-wise count rates for Quadrant B Data is divided into 100 sec bins |
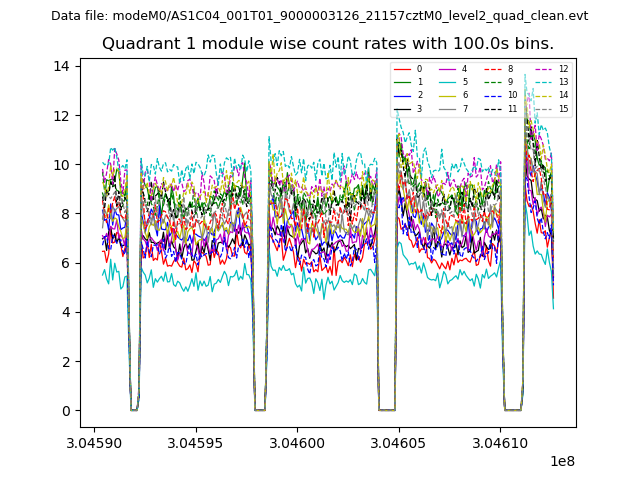 |
 |
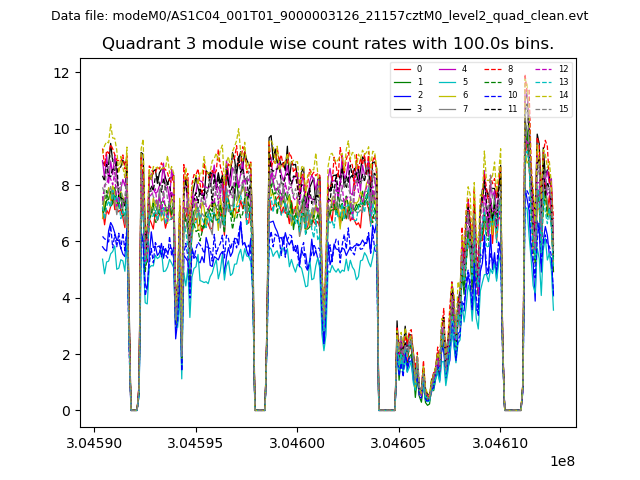
| Module-wise count rates for Quadrant C Data is divided into 100 sec bins |
 |
 |
| Module-wise count rates for Quadrant D Data is divided into 100 sec bins |
 |
 |
| Parameter | Plot |
|---|---|
| CZT HV Monitor | 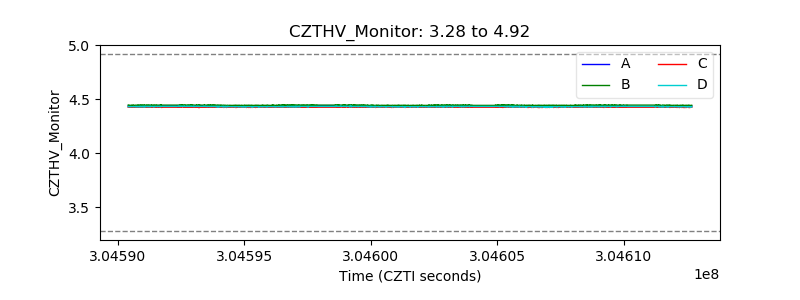 |
| D_VDD | 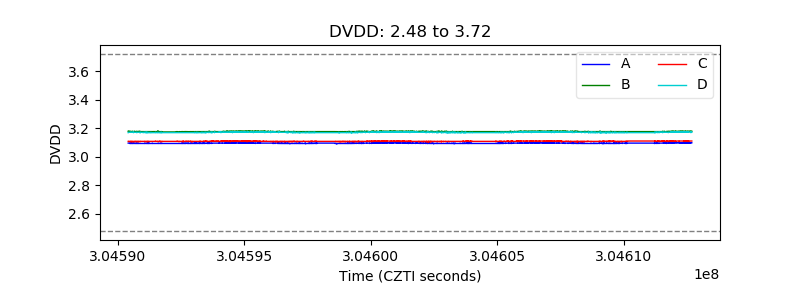 |
| Temperature 1 | 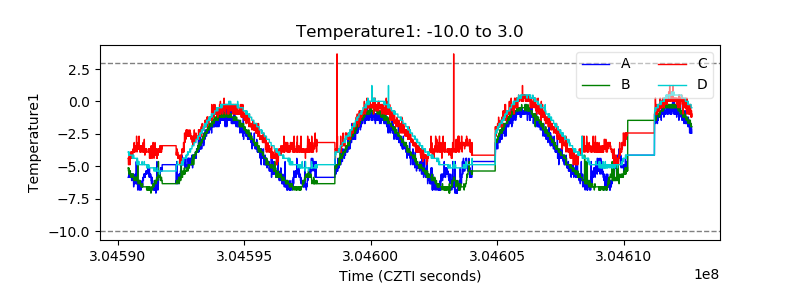 |
| Veto HV Monitor | 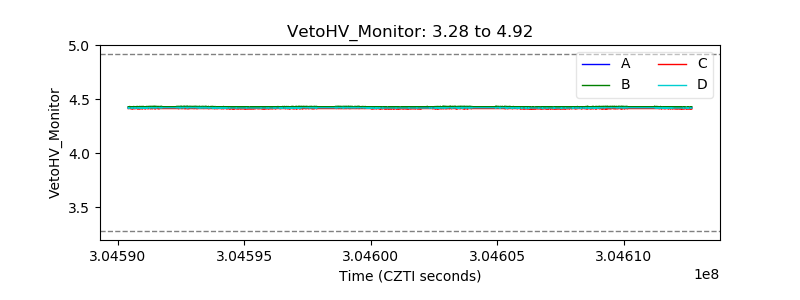 |
| Veto LLD | 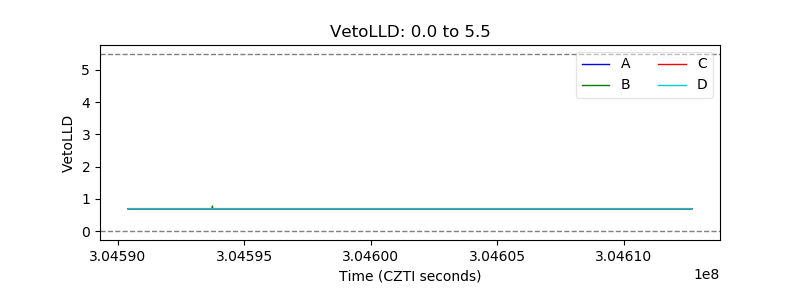 |
| Alpha Counter | 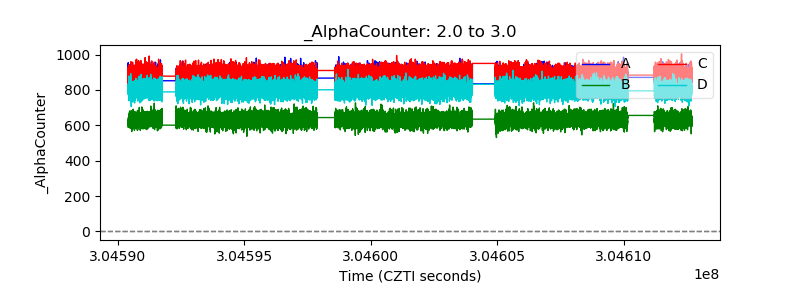 |
| _CPM_Rate | 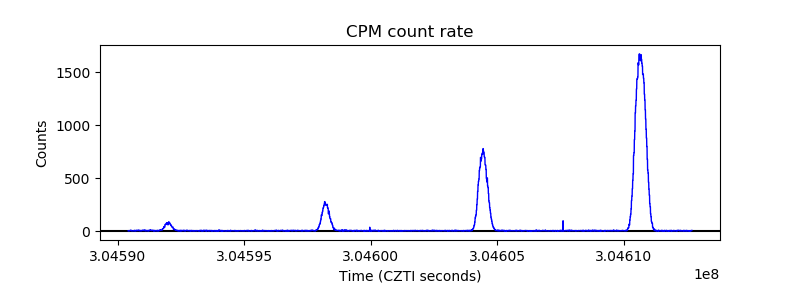 |
| CZT Counter | 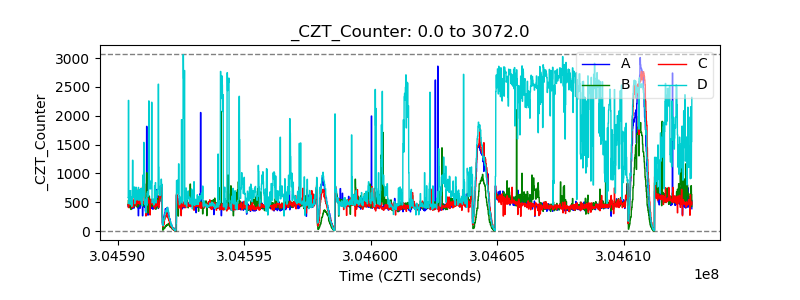 |
| +2.5 Volts monitor |  |
| +5 Volts monitor | 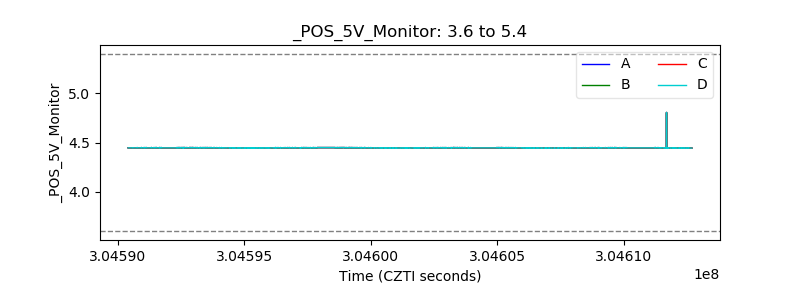 |
| _ROLL_ROT | 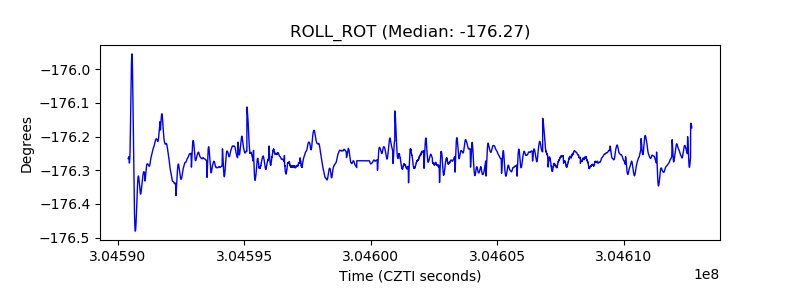 |
| _Roll_DEC | 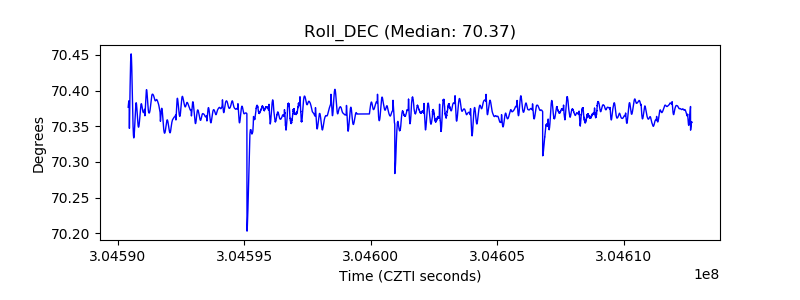 |
| _Roll_RA | 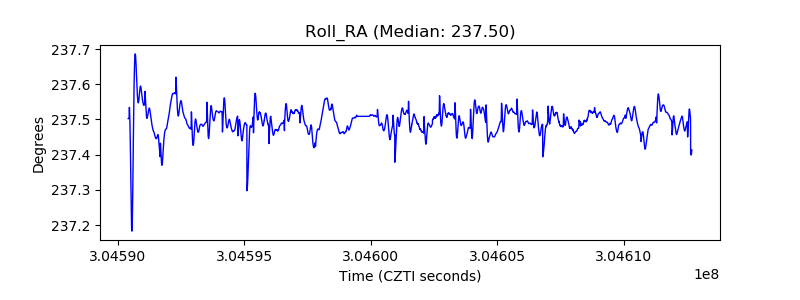 |
| Veto Counter | 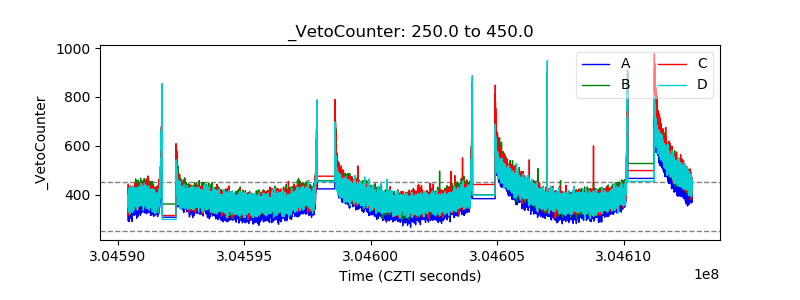 |