| Param | Original file | Final file |
|---|---|---|
| Filename | modeM0/AS1C04_001T01_9000003126_21159cztM0_level2.evt | modeM0/AS1C04_001T01_9000003126_21159cztM0_level2_quad_clean.evt |
| Size (bytes) | 586,460,160 | 116,107,200 |
| Size | 559.3 MB | 110.7 MB |
| Events in quadrant A | 2,948,784 | 809,533 |
| Events in quadrant B | 3,136,469 | 817,505 |
| Events in quadrant C | 2,886,159 | 794,632 |
| Events in quadrant D | 8,392,151 | 684,215 |
| Mode M9 | |||
|---|---|---|---|
| Quadrant | BADHDUFLAG | Total packets | Discarded packets |
| A | 0 | 11 | 0 |
| B | 0 | 11 | 0 |
| C | 0 | 11 | 0 |
| D | 0 | 11 | 0 |
| Mode M0 | |||
|---|---|---|---|
| Quadrant | BADHDUFLAG | Total packets | Discarded packets |
| A | 0 | 12719 | 1 |
| B | 0 | 13334 | 1 |
| C | 0 | 12419 | 1 |
| D | 0 | 29050 | 1 |
| Mode SS | |||
|---|---|---|---|
| Quadrant | BADHDUFLAG | Total packets | Discarded packets |
| A | 0 | 120 | 0 |
| B | 0 | 120 | 0 |
| C | 0 | 120 | 0 |
| D | 0 | 120 | 0 |
| Quadrant | Total seconds | Saturated seconds | Saturation percentage |
|---|---|---|---|
| A | 5865 | 100 | 1.705030% |
| B | 5866 | 57 | 0.971701% |
| C | 5866 | 75 | 1.278554% |
| D | 5866 | 1649 | 28.111149% |
Noise dominated data is calculated using 1-second bins in cleaned event files. If a bin has >2000 counts, and if more than 50% of those come from <1% of pixels, then it is considered to be noise-dominated and hence unusable.
| Quadrant | # 1 sec bins | Bins with >0 counts | Bins with >2000 counts | High rate bins dominated by noise | Noise dominated (total time) | Noise dominated (detector-on time) | Marked lightcurve |
|---|---|---|---|---|---|---|---|
| A | 7055 | 5865 | 37 | 37 | 0.52% | 0.63% | 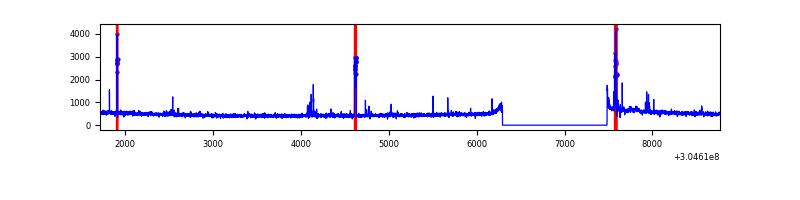 |
| B | 7056 | 5867 | 10 | 10 | 0.14% | 0.17% | 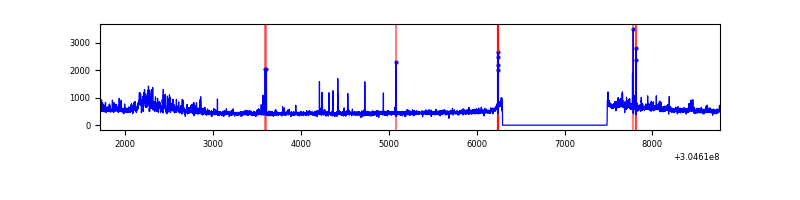 |
| C | 7056 | 5866 | 1 | 1 | 0.01% | 0.02% | 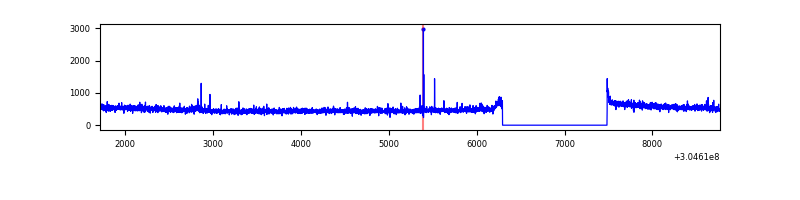 |
| D | 7056 | 5867 | 1519 | 1519 | 21.53% | 25.89% | 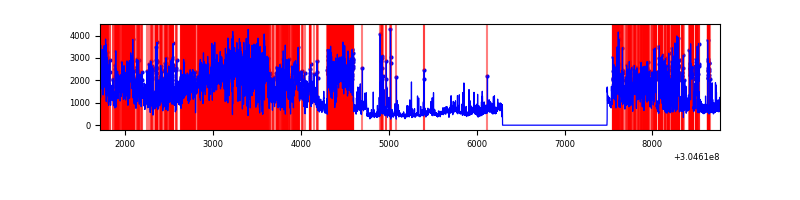 |
Top three noisy pixels from each quadrant. If the there are fewer than three noisy pixels in the level2.evt file, extra rows are filled as -1
| Pixel properties | Quadrant properties | ||||||
|---|---|---|---|---|---|---|---|
| Quadrant | DetID | PixID | Counts | Sigma | Mean | Median | Sigma |
| A | 5 | 16 | 169210 | 1177.43 | 715 | 701 | 143.1 |
| A | 13 | 34 | 21141 | 142.82 | 715 | 701 | 143.1 |
| A | 13 | 254 | 8629 | 55.4 | 715 | 701 | 143.1 |
| B | 0 | 189 | 122423 | 906.52 | 719 | 702 | 134.3 |
| B | 0 | 229 | 86094 | 635.96 | 719 | 702 | 134.3 |
| B | 0 | 190 | 37541 | 274.36 | 719 | 702 | 134.3 |
| C | 14 | 238 | 110550 | 679.98 | 699 | 705 | 161.5 |
| C | 3 | 233 | 31149 | 188.46 | 699 | 705 | 161.5 |
| C | 10 | 23 | 8801 | 50.12 | 699 | 705 | 161.5 |
| D | 1 | 239 | 5293573 | 34032.4 | 651 | 632 | 155.5 |
| D | 13 | 153 | 181128 | 1160.55 | 651 | 632 | 155.5 |
| D | 1 | 20 | 121379 | 776.38 | 651 | 632 | 155.5 |
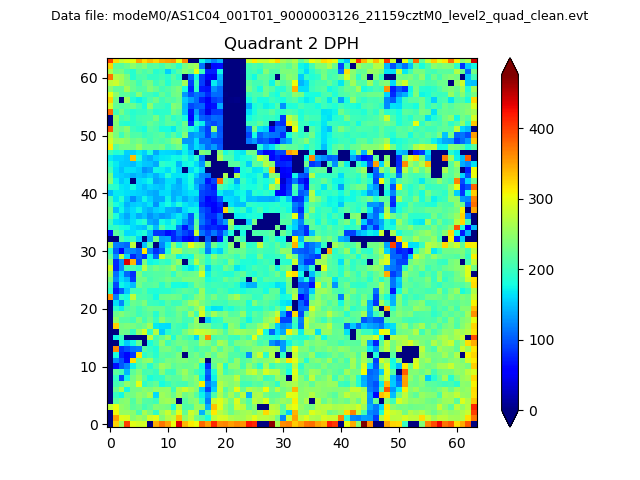
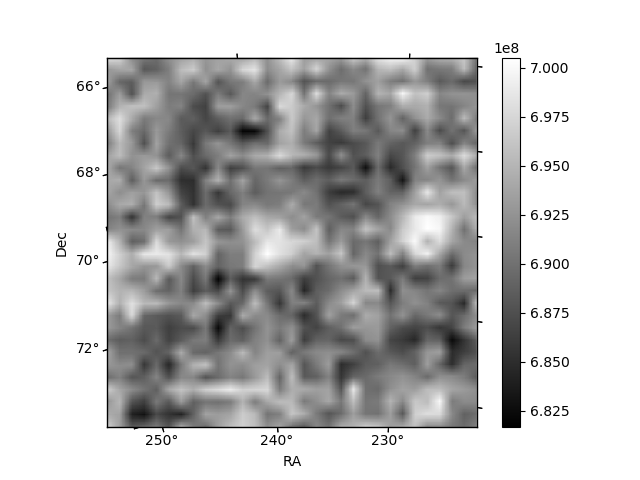
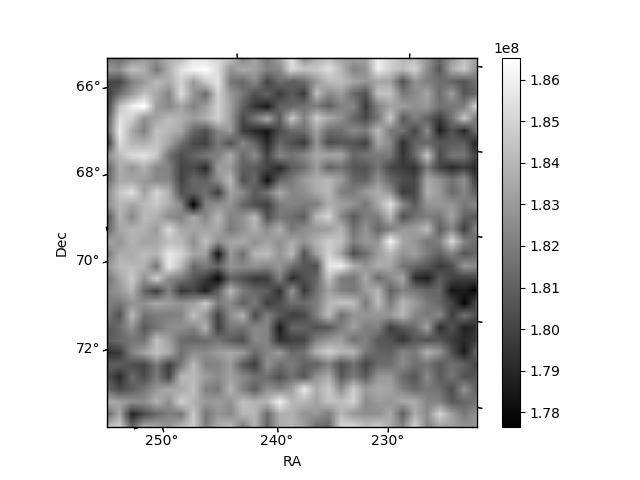
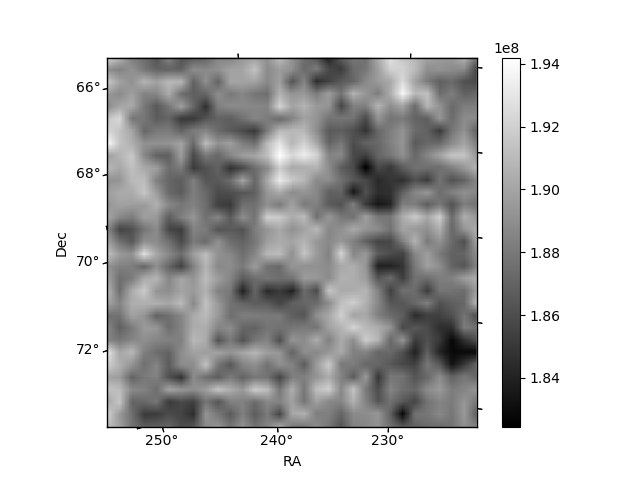
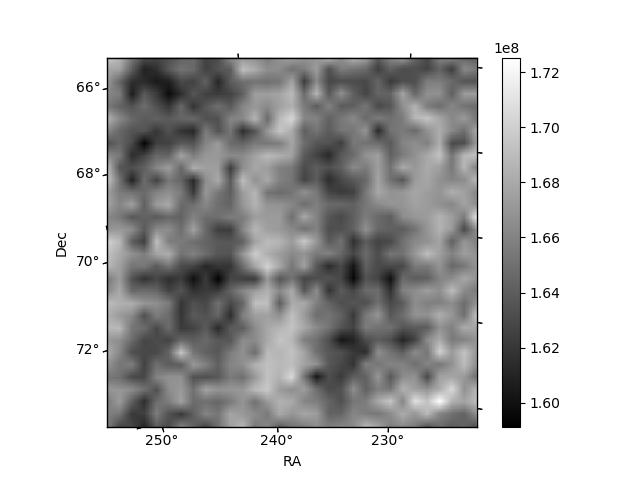
Histogram calculated using DETX and DETY for each event in the final _common_clean file
| Quadrant A | 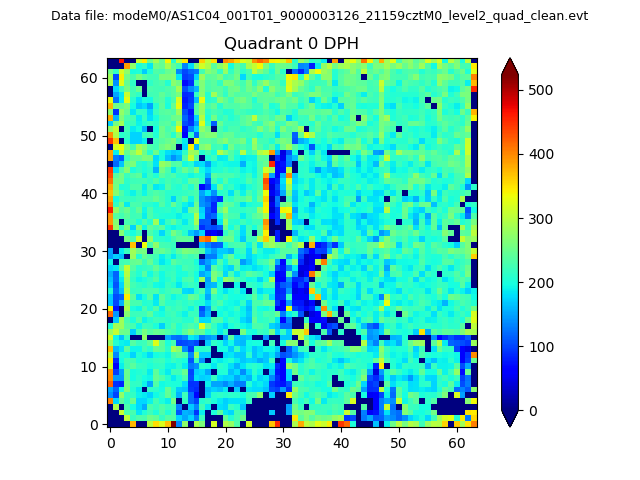 |
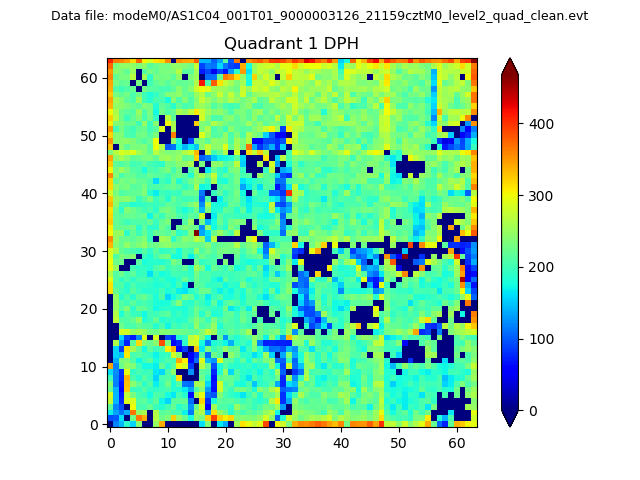 |
Quadrant B |
|---|---|---|---|
| Quadrant D | 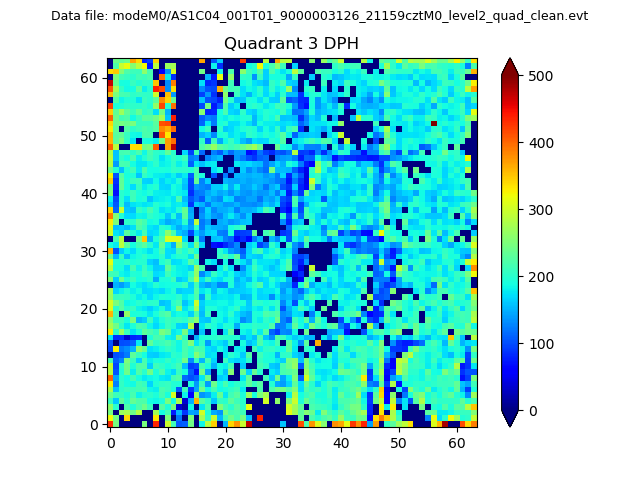 |
 |
Quadrant C |
| Plot type | Count rate plots | Images |
|---|---|---|
| Comparison with Poisson distribution Blue bars denote a histogram of data divided into 1 sec bins. Red curve is a Poisson curve with rate = median count rate of data. |
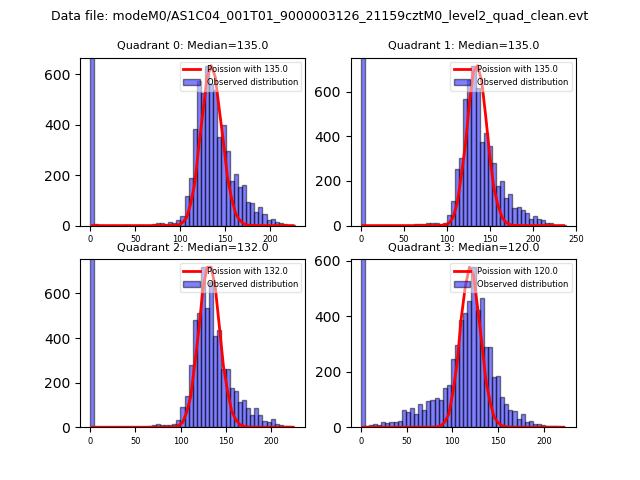 |
 |
| Quadrant-wise count rates Data is divided into 100 sec bins |
 |
|
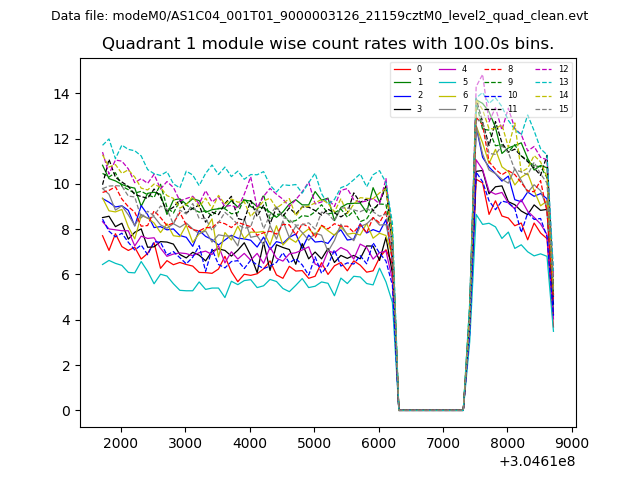
| Module-wise count rates for Quadrant A Data is divided into 100 sec bins |
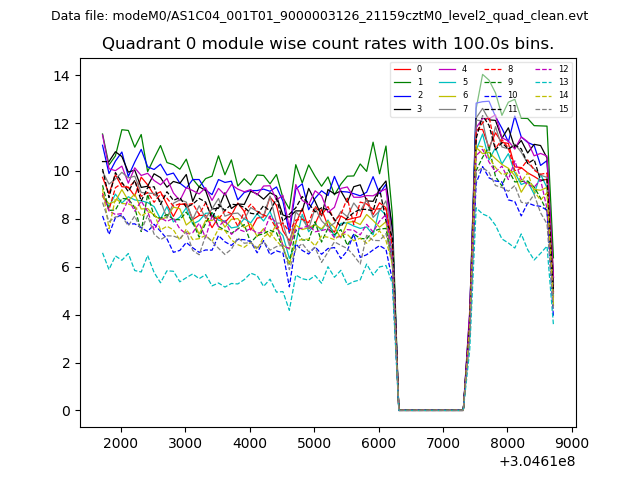 |
 |
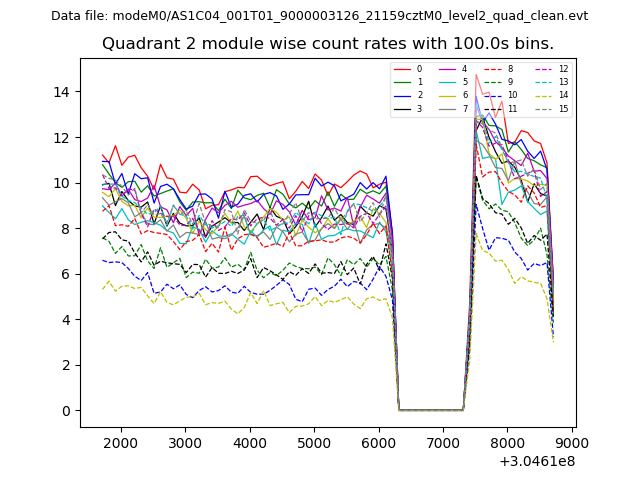
| Module-wise count rates for Quadrant B Data is divided into 100 sec bins |
 |
 |
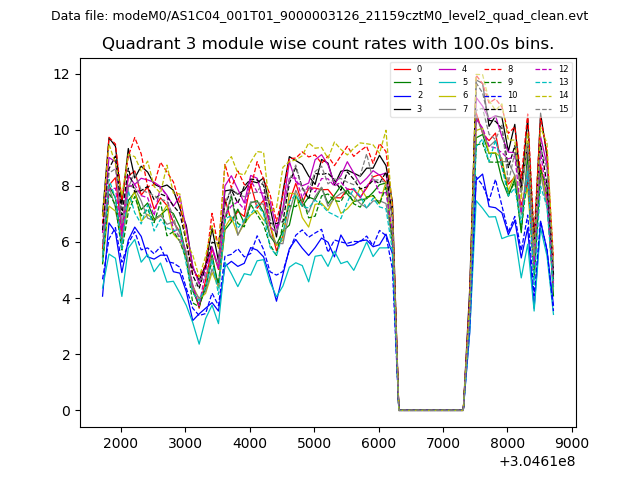
| Module-wise count rates for Quadrant C Data is divided into 100 sec bins |
 |
 |
| Module-wise count rates for Quadrant D Data is divided into 100 sec bins |
 |
 |
| Parameter | Plot |
|---|---|
| CZT HV Monitor | 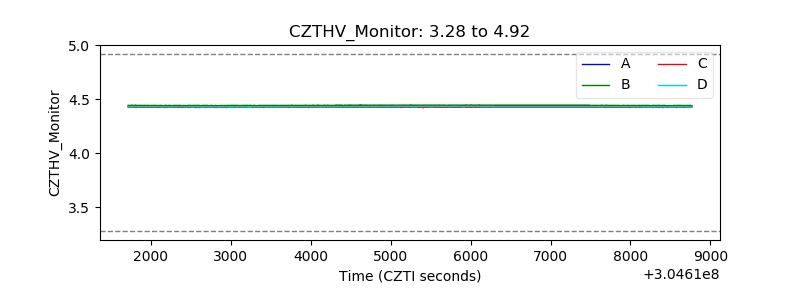 |
| D_VDD |  |
| Temperature 1 | 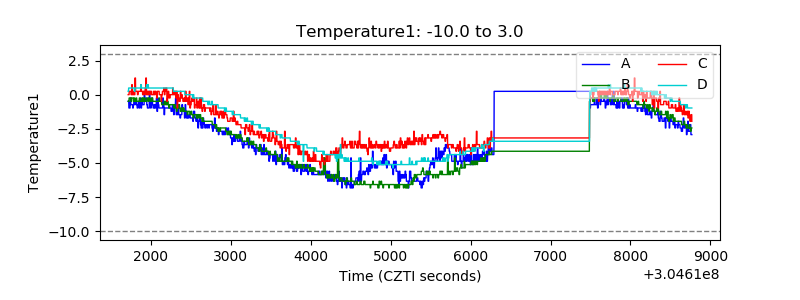 |
| Veto HV Monitor | 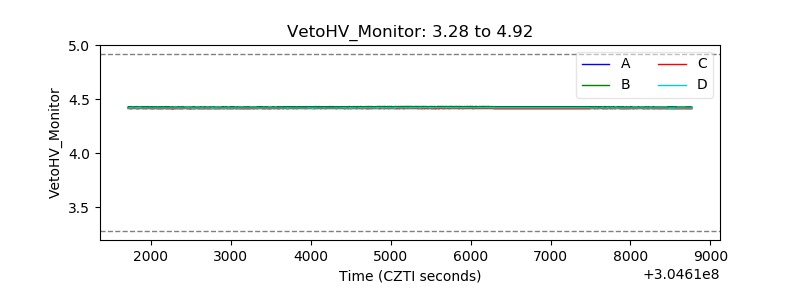 |
| Veto LLD | 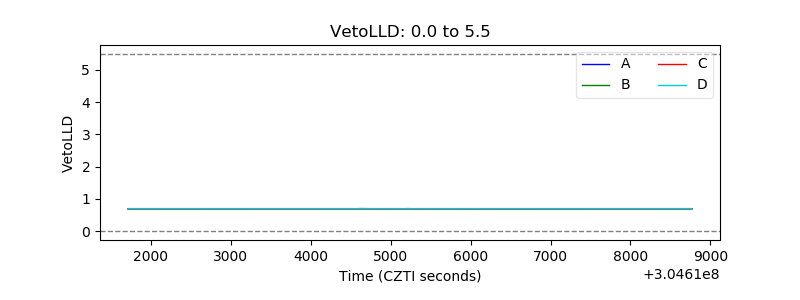 |
| Alpha Counter |  |
| _CPM_Rate | 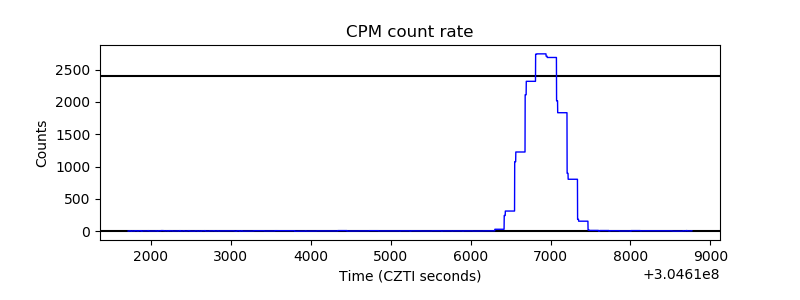 |
| CZT Counter |  |
| +2.5 Volts monitor |  |
| +5 Volts monitor |  |
| _ROLL_ROT | 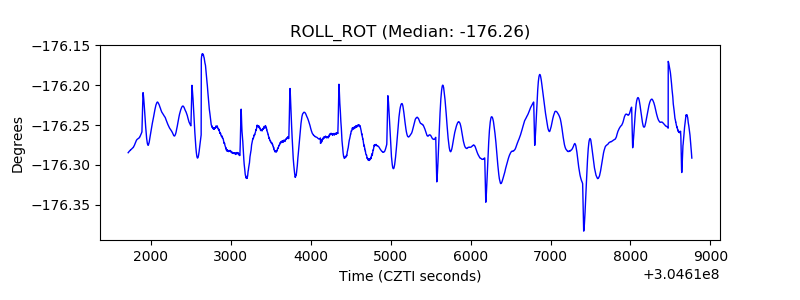 |
| _Roll_DEC | 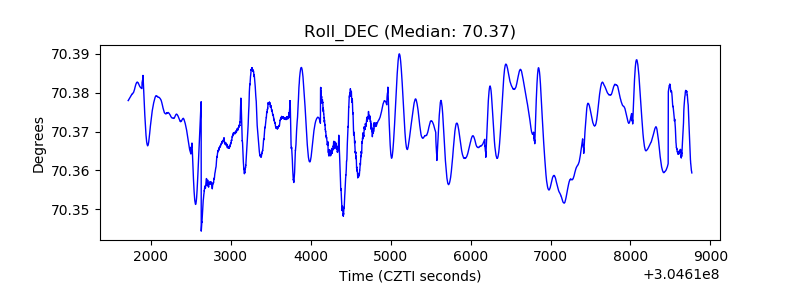 |
| _Roll_RA | 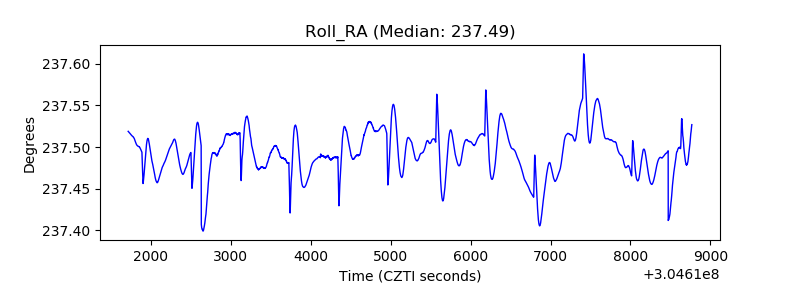 |
| Veto Counter | 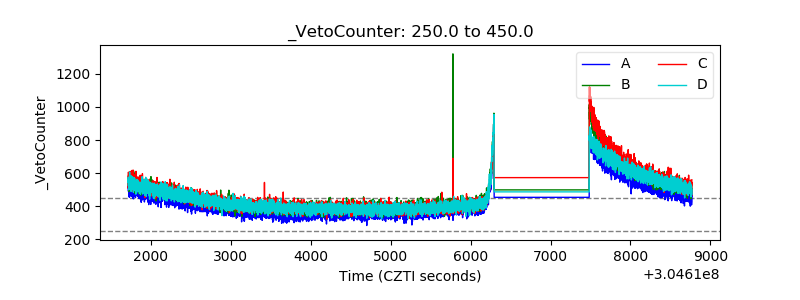 |