| Param | Original file | Final file |
|---|---|---|
| Filename | modeM0/AS1C04_001T01_9000003126_21162cztM0_level2.evt | modeM0/AS1C04_001T01_9000003126_21162cztM0_level2_quad_clean.evt |
| Size (bytes) | 480,168,000 | 130,512,960 |
| Size | 457.9 MB | 124.5 MB |
| Events in quadrant A | 2,940,686 | 891,547 |
| Events in quadrant B | 3,330,611 | 919,181 |
| Events in quadrant C | 3,129,813 | 897,296 |
| Events in quadrant D | 4,730,078 | 822,365 |
| Mode M9 | |||
|---|---|---|---|
| Quadrant | BADHDUFLAG | Total packets | Discarded packets |
| A | 0 | 20 | 0 |
| B | 0 | 21 | 0 |
| C | 0 | 21 | 0 |
| D | 0 | 21 | 0 |
| Mode M0 | |||
|---|---|---|---|
| Quadrant | BADHDUFLAG | Total packets | Discarded packets |
| A | 0 | 12660 | 2 |
| B | 0 | 13831 | 2 |
| C | 0 | 13111 | 2 |
| D | 0 | 18224 | 2 |
| Mode SS | |||
|---|---|---|---|
| Quadrant | BADHDUFLAG | Total packets | Discarded packets |
| A | 0 | 124 | 0 |
| B | 0 | 124 | 0 |
| C | 0 | 124 | 0 |
| D | 0 | 124 | 0 |
| Quadrant | Total seconds | Saturated seconds | Saturation percentage |
|---|---|---|---|
| A | 6049 | 15 | 0.247975% |
| B | 6049 | 34 | 0.562076% |
| C | 6049 | 84 | 1.388659% |
| D | 6048 | 374 | 6.183862% |
Noise dominated data is calculated using 1-second bins in cleaned event files. If a bin has >2000 counts, and if more than 50% of those come from <1% of pixels, then it is considered to be noise-dominated and hence unusable.
| Quadrant | # 1 sec bins | Bins with >0 counts | Bins with >2000 counts | High rate bins dominated by noise | Noise dominated (total time) | Noise dominated (detector-on time) | Marked lightcurve |
|---|---|---|---|---|---|---|---|
| A | 7459 | 6050 | 0 | 0 | 0.00% | 0.00% | 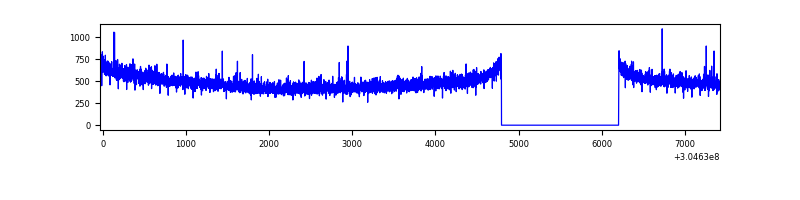 |
| B | 7459 | 6050 | 1 | 1 | 0.01% | 0.02% | 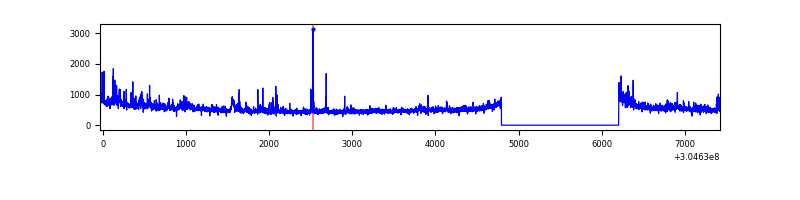 |
| C | 7459 | 6050 | 6 | 6 | 0.08% | 0.10% | 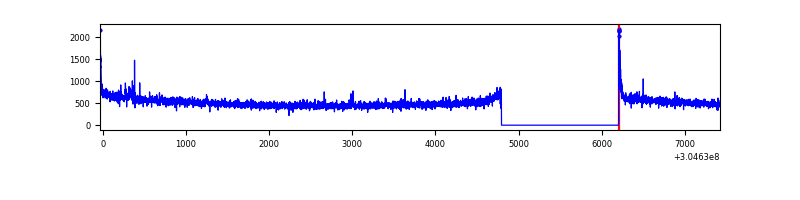 |
| D | 7458 | 6049 | 318 | 318 | 4.26% | 5.26% | 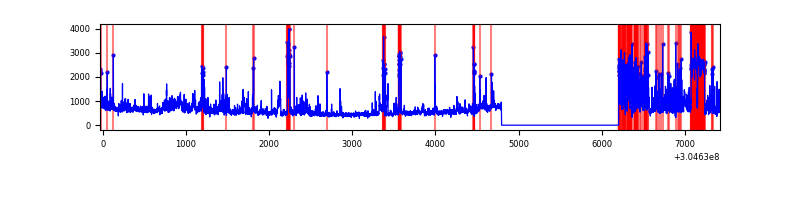 |
Top three noisy pixels from each quadrant. If the there are fewer than three noisy pixels in the level2.evt file, extra rows are filled as -1
| Pixel properties | Quadrant properties | ||||||
|---|---|---|---|---|---|---|---|
| Quadrant | DetID | PixID | Counts | Sigma | Mean | Median | Sigma |
| A | 13 | 254 | 10089 | 61.3 | 759 | 743 | 152.5 |
| A | 0 | 226 | 6597 | 38.39 | 759 | 743 | 152.5 |
| A | 8 | 6 | 6034 | 34.7 | 759 | 743 | 152.5 |
| B | 0 | 189 | 74678 | 518.05 | 774 | 756 | 142.7 |
| B | 0 | 244 | 65026 | 450.4 | 774 | 756 | 142.7 |
| B | 0 | 190 | 42920 | 295.49 | 774 | 756 | 142.7 |
| C | 14 | 238 | 119591 | 680.68 | 754 | 760 | 174.6 |
| C | 0 | 10 | 40338 | 226.71 | 754 | 760 | 174.6 |
| C | 3 | 233 | 26808 | 149.21 | 754 | 760 | 174.6 |
| D | 1 | 52 | 860186 | 4942.11 | 727 | 707 | 173.9 |
| D | 1 | 20 | 432434 | 2482.48 | 727 | 707 | 173.9 |
| D | 1 | 239 | 400107 | 2296.6 | 727 | 707 | 173.9 |
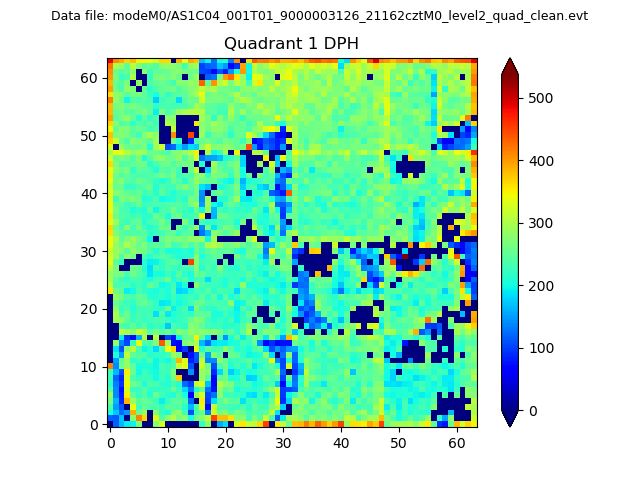
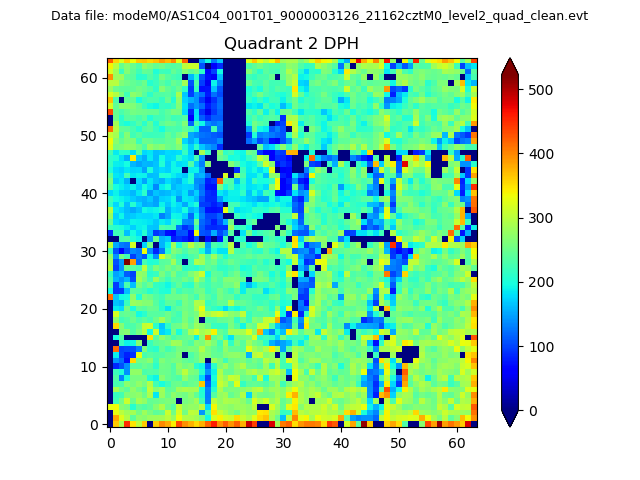
Histogram calculated using DETX and DETY for each event in the final _common_clean file
| Quadrant A |  |
 |
Quadrant B |
|---|---|---|---|
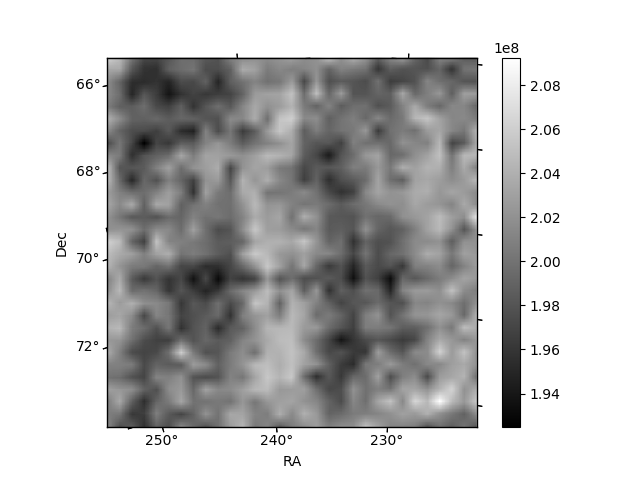
| Quadrant D | 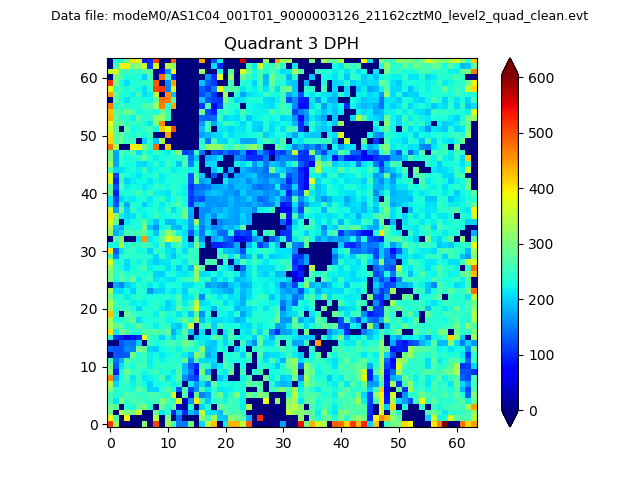 |
 |
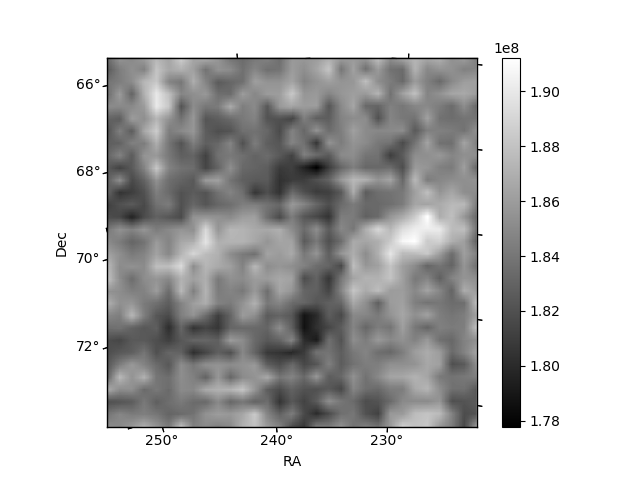
Quadrant C |
| Plot type | Count rate plots | Images |
|---|---|---|
| Comparison with Poisson distribution Blue bars denote a histogram of data divided into 1 sec bins. Red curve is a Poisson curve with rate = median count rate of data. |
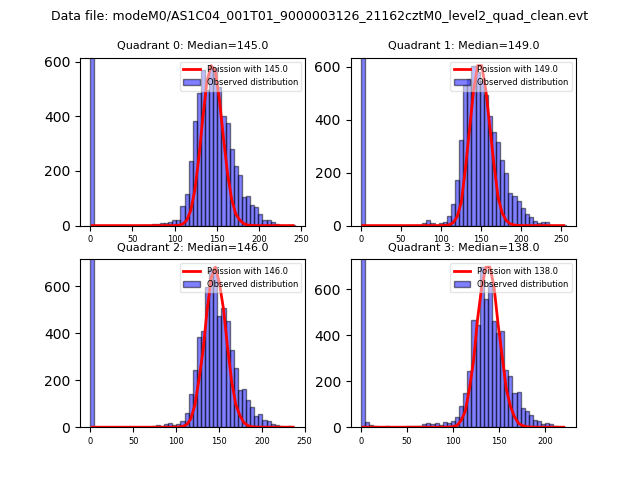 |
 |
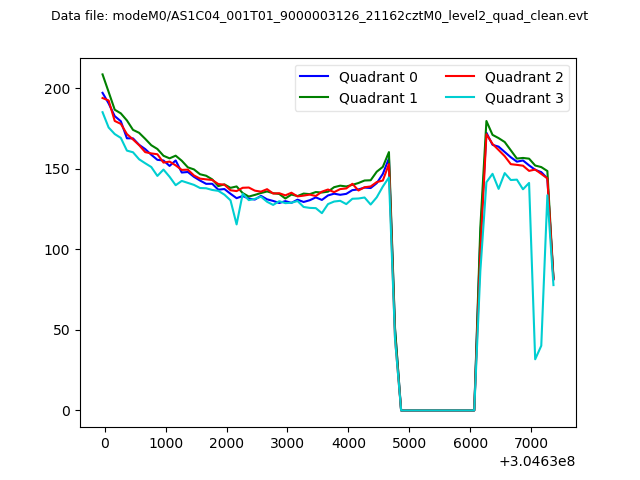
| Quadrant-wise count rates Data is divided into 100 sec bins |
 |
|
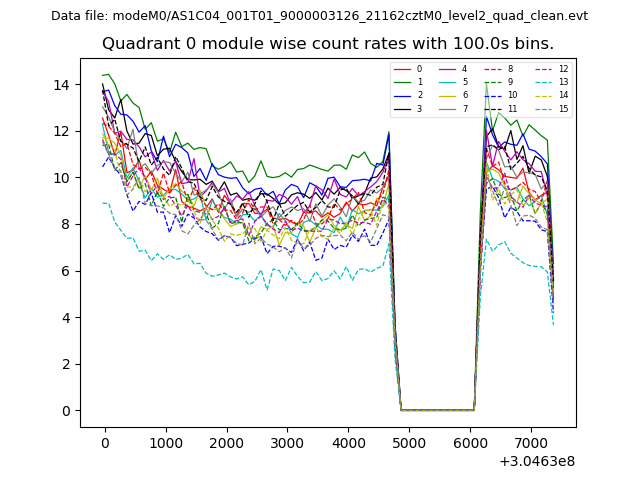
| Module-wise count rates for Quadrant A Data is divided into 100 sec bins |
 |
 |
| Module-wise count rates for Quadrant B Data is divided into 100 sec bins |
 |
 |
| Module-wise count rates for Quadrant C Data is divided into 100 sec bins |
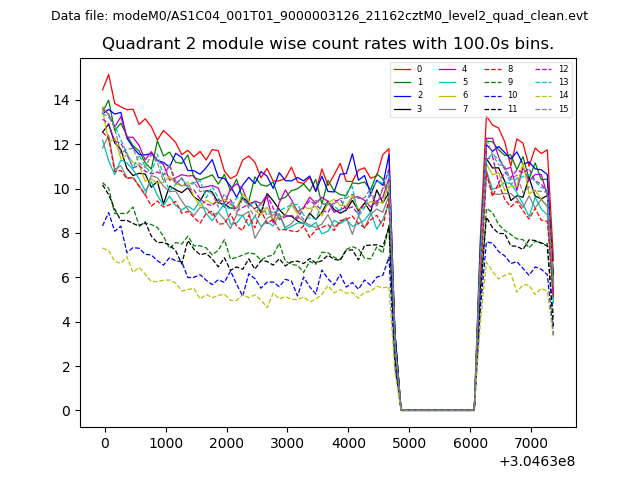 |
 |
| Module-wise count rates for Quadrant D Data is divided into 100 sec bins |
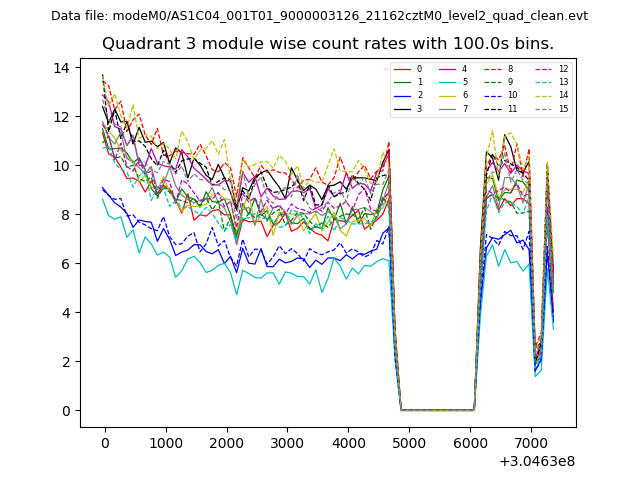 |
 |
| Parameter | Plot |
|---|---|
| CZT HV Monitor |  |
| D_VDD | 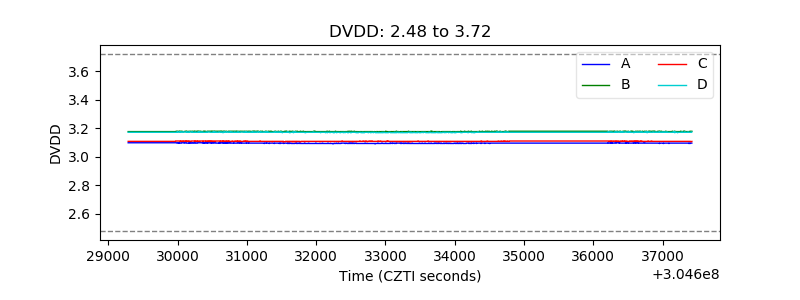 |
| Temperature 1 | 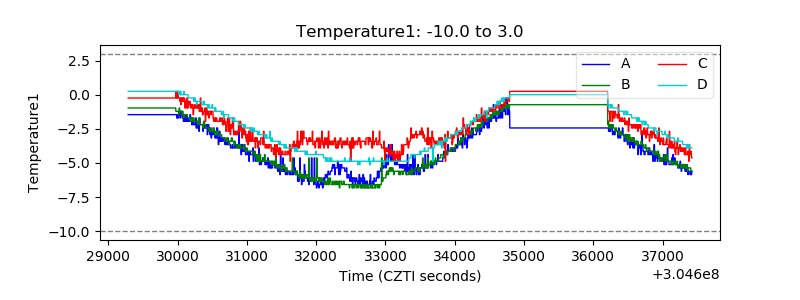 |
| Veto HV Monitor | 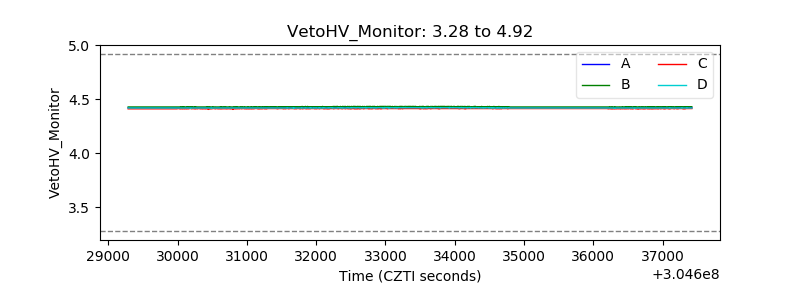 |
| Veto LLD |  |
| Alpha Counter | 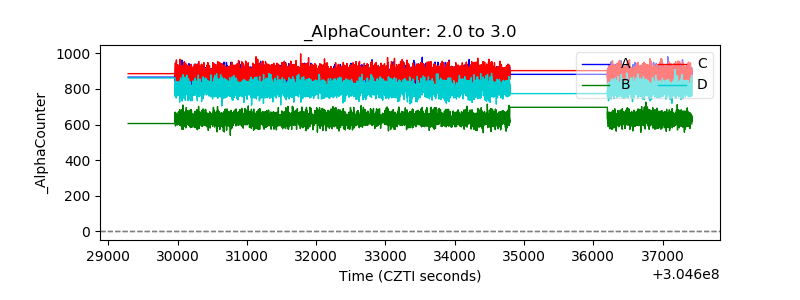 |
| _CPM_Rate | 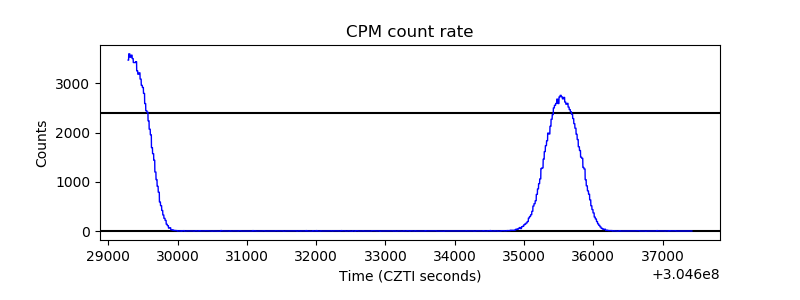 |
| CZT Counter | 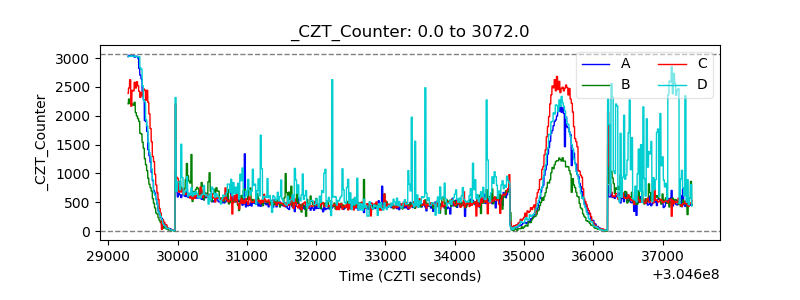 |
| +2.5 Volts monitor |  |
| +5 Volts monitor | 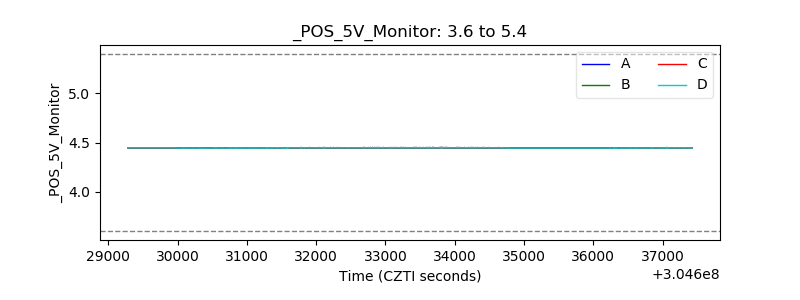 |
| _ROLL_ROT | 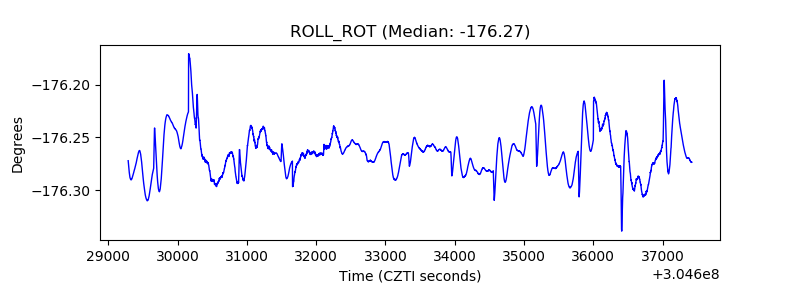 |
| _Roll_DEC | 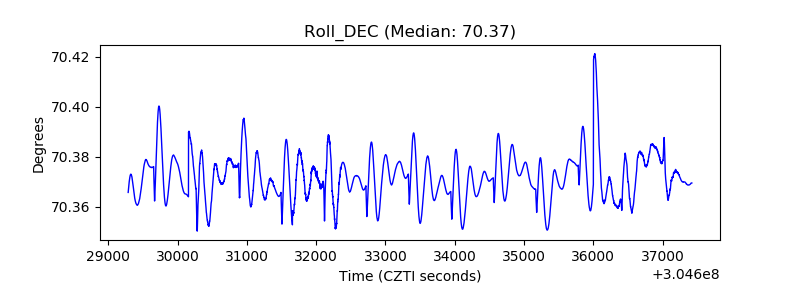 |
| _Roll_RA |  |
| Veto Counter | 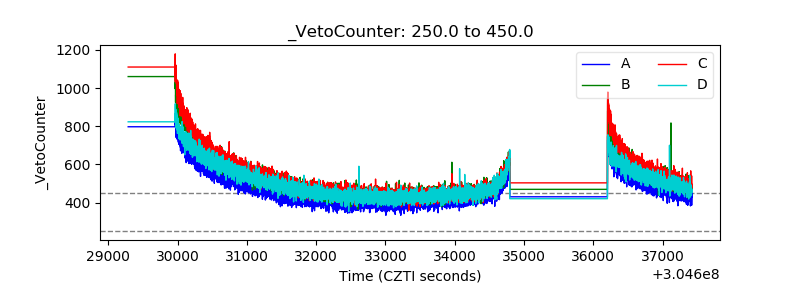 |