| Param | Original file | Final file |
|---|---|---|
| Filename | modeM0/AS1C04_001T01_9000003126_21164cztM0_level2.evt | modeM0/AS1C04_001T01_9000003126_21164cztM0_level2_quad_clean.evt |
| Size (bytes) | 544,020,480 | 133,695,360 |
| Size | 518.8 MB | 127.5 MB |
| Events in quadrant A | 4,192,350 | 889,299 |
| Events in quadrant B | 3,415,101 | 925,419 |
| Events in quadrant C | 3,341,331 | 897,694 |
| Events in quadrant D | 5,056,620 | 853,808 |
| Mode M9 | |||
|---|---|---|---|
| Quadrant | BADHDUFLAG | Total packets | Discarded packets |
| A | 0 | 23 | 0 |
| B | 0 | 23 | 0 |
| C | 0 | 23 | 0 |
| D | 0 | 23 | 0 |
| Mode M0 | |||
|---|---|---|---|
| Quadrant | BADHDUFLAG | Total packets | Discarded packets |
| A | 0 | 17266 | 2 |
| B | 0 | 14792 | 2 |
| C | 0 | 14526 | 2 |
| D | 0 | 19971 | 2 |
| Mode SS | |||
|---|---|---|---|
| Quadrant | BADHDUFLAG | Total packets | Discarded packets |
| A | 0 | 142 | 0 |
| B | 0 | 142 | 0 |
| C | 0 | 142 | 0 |
| D | 0 | 142 | 0 |
| Quadrant | Total seconds | Saturated seconds | Saturation percentage |
|---|---|---|---|
| A | 6937 | 285 | 4.108404% |
| B | 6938 | 51 | 0.735082% |
| C | 6938 | 97 | 1.398097% |
| D | 6938 | 267 | 3.848371% |
Noise dominated data is calculated using 1-second bins in cleaned event files. If a bin has >2000 counts, and if more than 50% of those come from <1% of pixels, then it is considered to be noise-dominated and hence unusable.
| Quadrant | # 1 sec bins | Bins with >0 counts | Bins with >2000 counts | High rate bins dominated by noise | Noise dominated (total time) | Noise dominated (detector-on time) | Marked lightcurve |
|---|---|---|---|---|---|---|---|
| A | 9212 | 6939 | 147 | 147 | 1.60% | 2.12% | 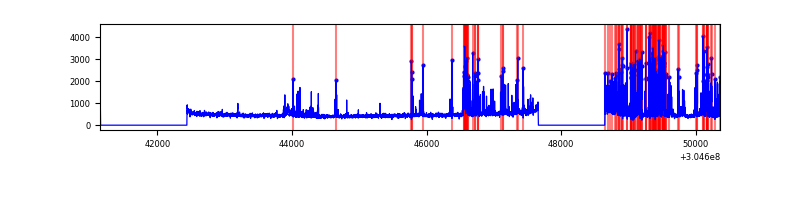 |
| B | 9213 | 6940 | 2 | 2 | 0.02% | 0.03% | 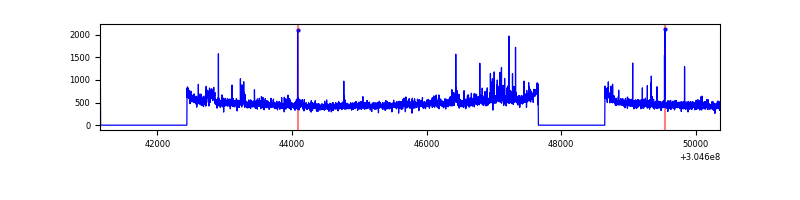 |
| C | 9213 | 6939 | 7 | 7 | 0.08% | 0.10% | 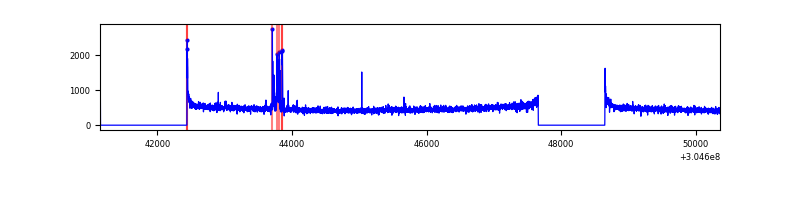 |
| D | 9213 | 6940 | 196 | 196 | 2.13% | 2.82% | 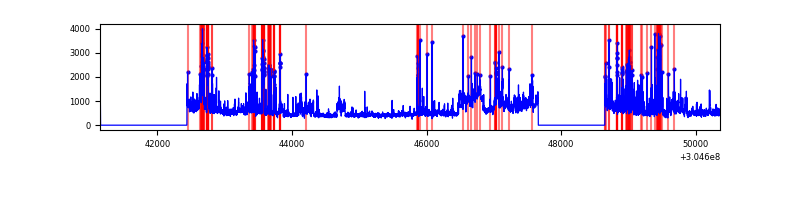 |
Top three noisy pixels from each quadrant. If the there are fewer than three noisy pixels in the level2.evt file, extra rows are filled as -1
| Pixel properties | Quadrant properties | ||||||
|---|---|---|---|---|---|---|---|
| Quadrant | DetID | PixID | Counts | Sigma | Mean | Median | Sigma |
| A | 5 | 16 | 1081185 | 6734.07 | 801 | 785 | 160.4 |
| A | 15 | 192 | 13521 | 79.38 | 801 | 785 | 160.4 |
| A | 13 | 254 | 10719 | 61.92 | 801 | 785 | 160.4 |
| B | 0 | 190 | 38627 | 247.81 | 820 | 801 | 152.6 |
| B | 0 | 189 | 34420 | 220.25 | 820 | 801 | 152.6 |
| B | 0 | 229 | 26441 | 167.97 | 820 | 801 | 152.6 |
| C | 14 | 238 | 126566 | 683.77 | 791 | 793 | 183.9 |
| C | 3 | 233 | 103192 | 556.69 | 791 | 793 | 183.9 |
| C | 0 | 10 | 27990 | 147.86 | 791 | 793 | 183.9 |
| D | 1 | 239 | 609124 | 3242.27 | 784 | 761 | 187.6 |
| D | 1 | 20 | 496663 | 2642.91 | 784 | 761 | 187.6 |
| D | 1 | 52 | 295899 | 1572.94 | 784 | 761 | 187.6 |
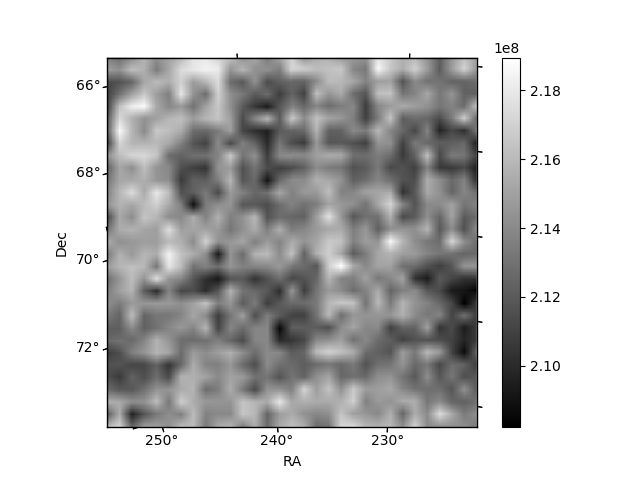
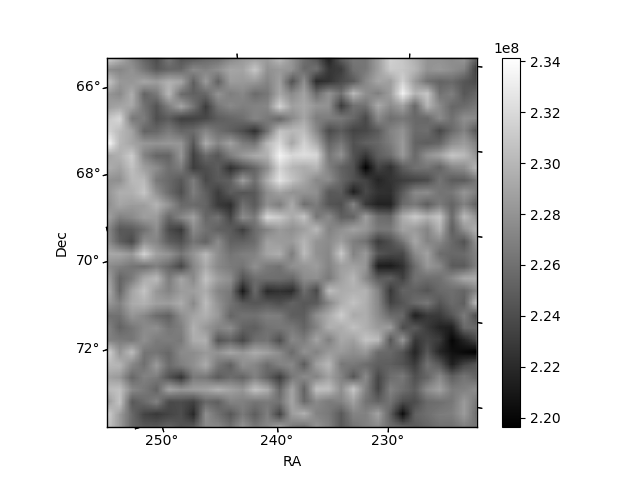
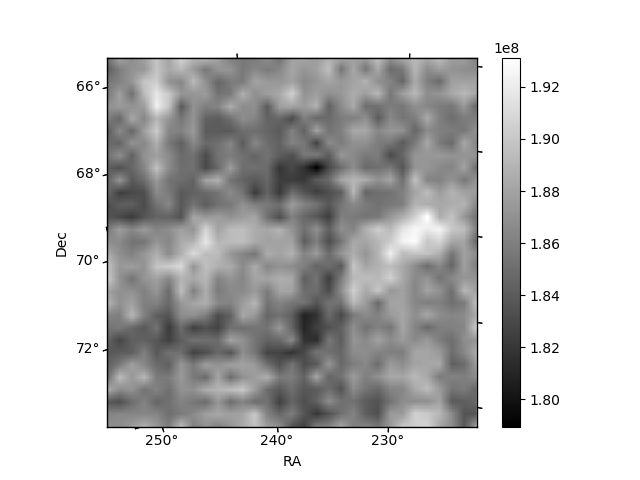
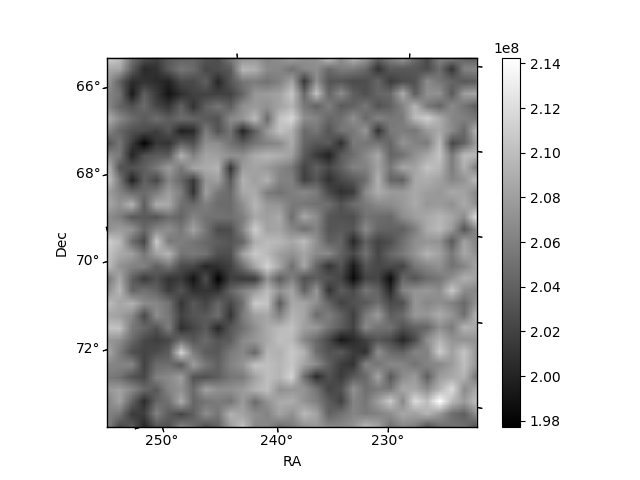
Histogram calculated using DETX and DETY for each event in the final _common_clean file
| Quadrant A | 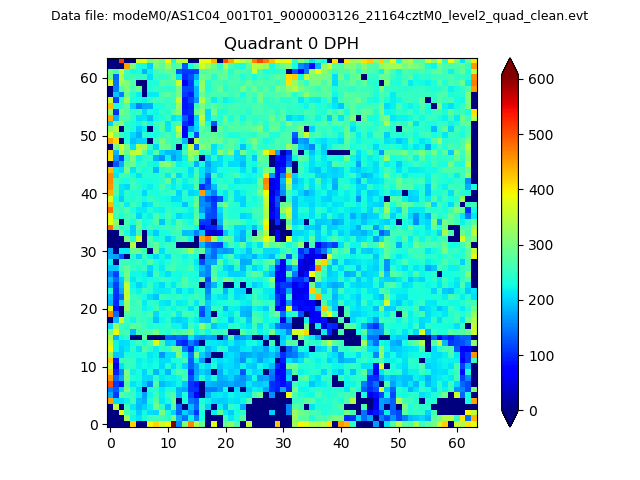 |
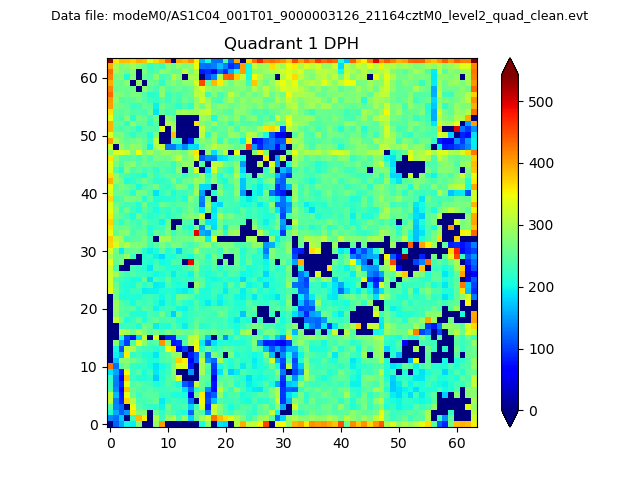 |
Quadrant B |
|---|---|---|---|
| Quadrant D | 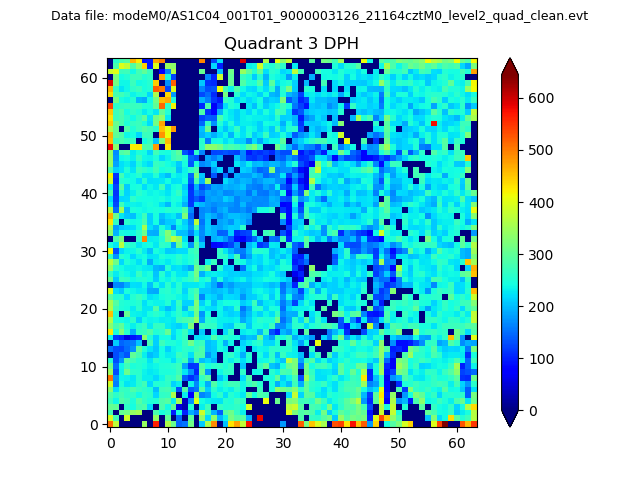 |
 |
Quadrant C |
| Plot type | Count rate plots | Images |
|---|---|---|
| Comparison with Poisson distribution Blue bars denote a histogram of data divided into 1 sec bins. Red curve is a Poisson curve with rate = median count rate of data. |
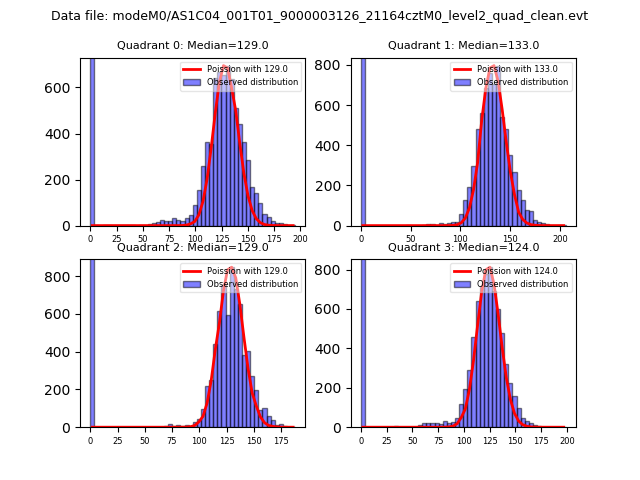 |
 |
| Quadrant-wise count rates Data is divided into 100 sec bins |
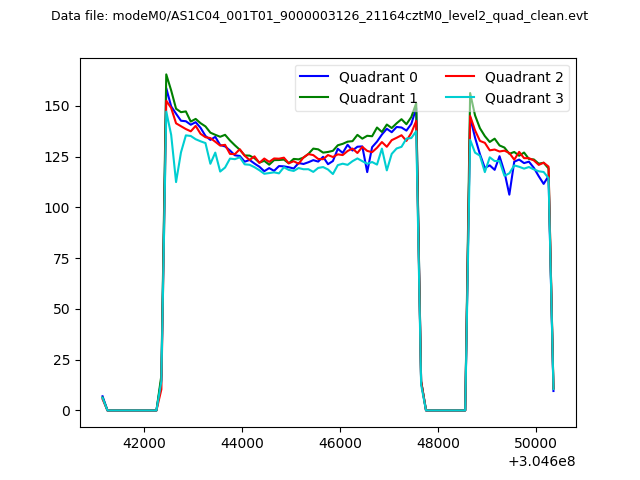 |
|
| Module-wise count rates for Quadrant A Data is divided into 100 sec bins |
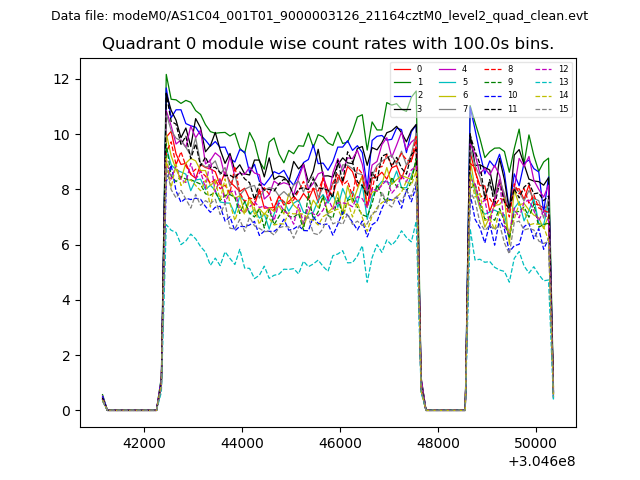 |
 |
| Module-wise count rates for Quadrant B Data is divided into 100 sec bins |
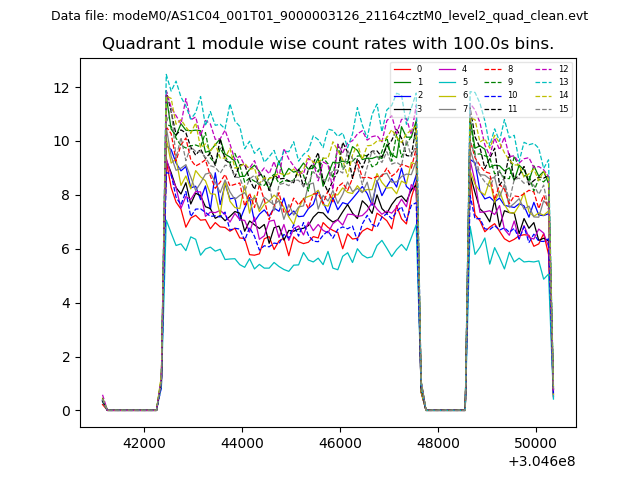 |
 |
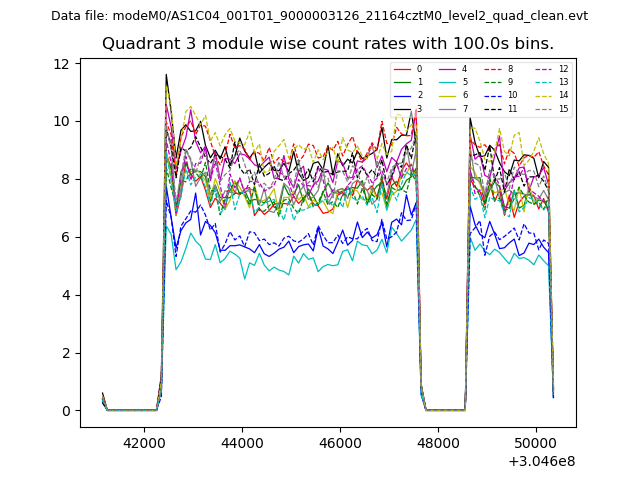
| Module-wise count rates for Quadrant C Data is divided into 100 sec bins |
 |
 |
| Module-wise count rates for Quadrant D Data is divided into 100 sec bins |
 |
 |
| Parameter | Plot |
|---|---|
| CZT HV Monitor | 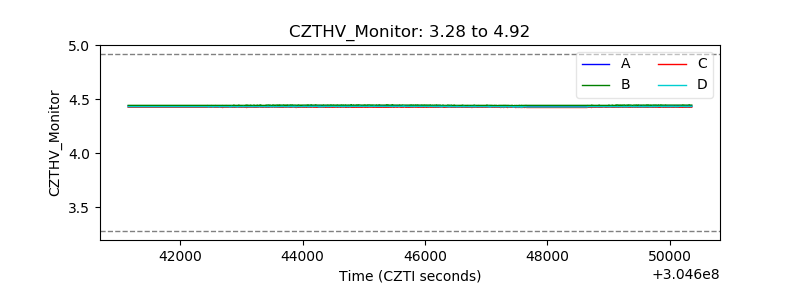 |
| D_VDD | 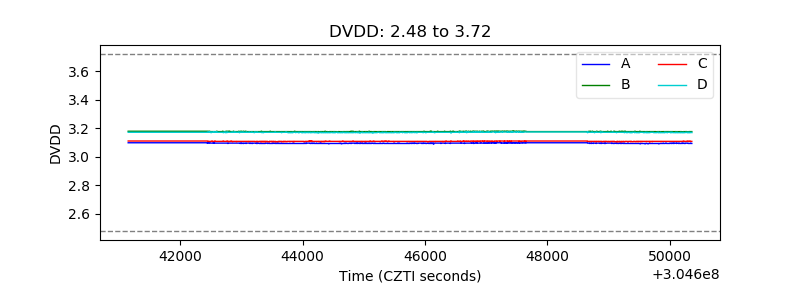 |
| Temperature 1 | 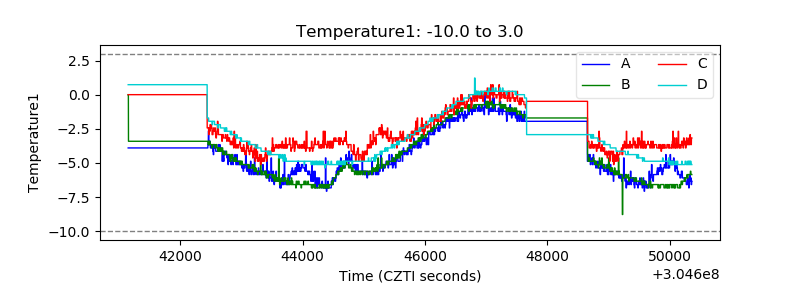 |
| Veto HV Monitor | 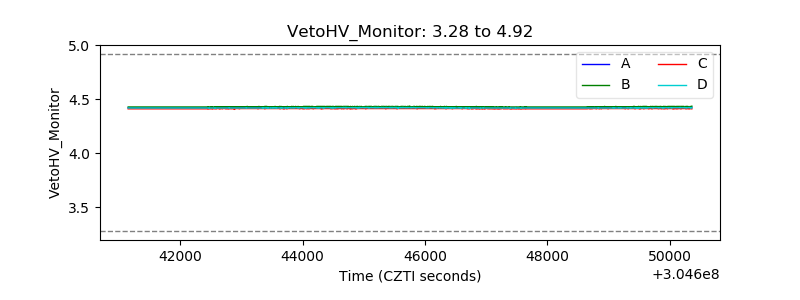 |
| Veto LLD | 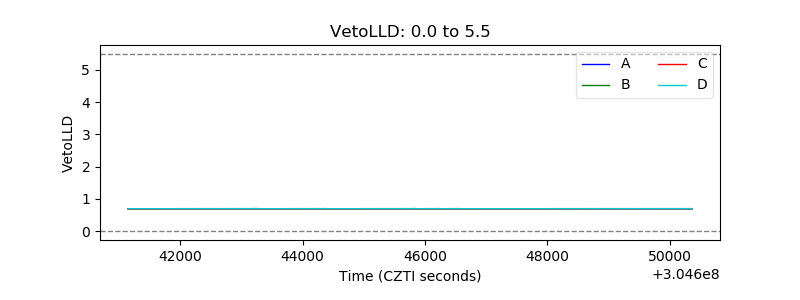 |
| Alpha Counter | 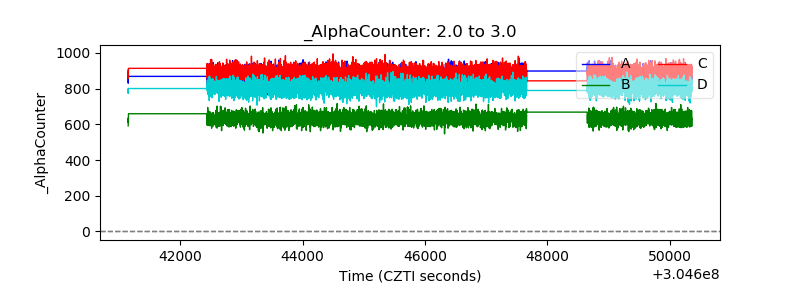 |
| _CPM_Rate | 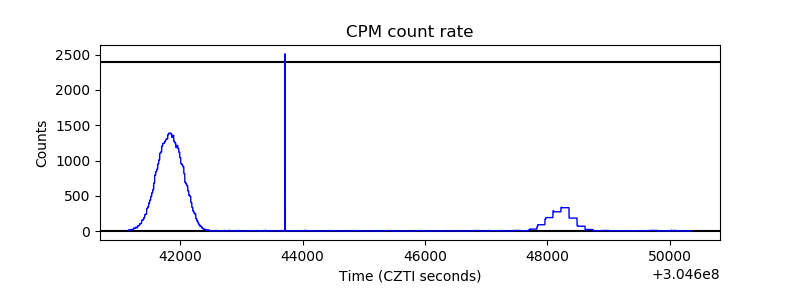 |
| CZT Counter |  |
| +2.5 Volts monitor | 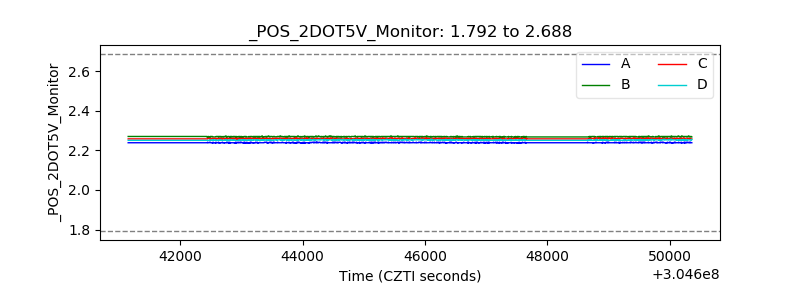 |
| +5 Volts monitor |  |
| _ROLL_ROT | 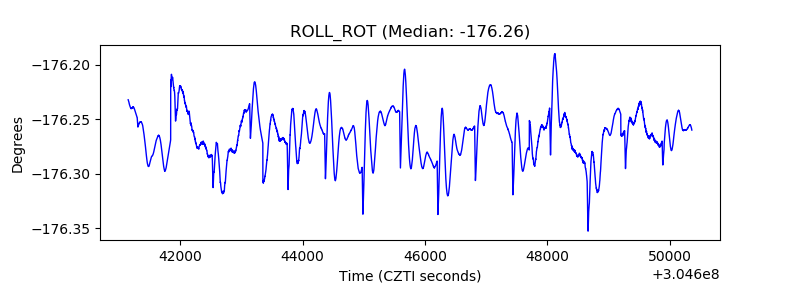 |
| _Roll_DEC | 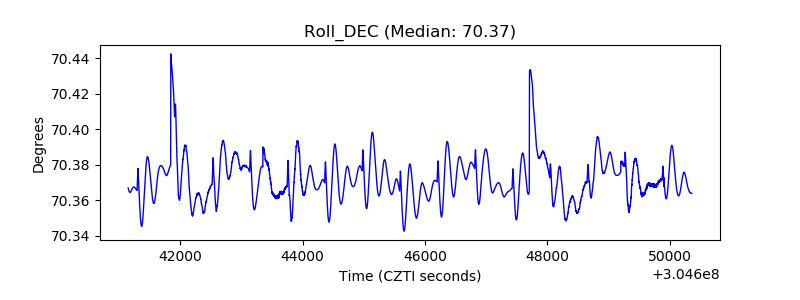 |
| _Roll_RA | 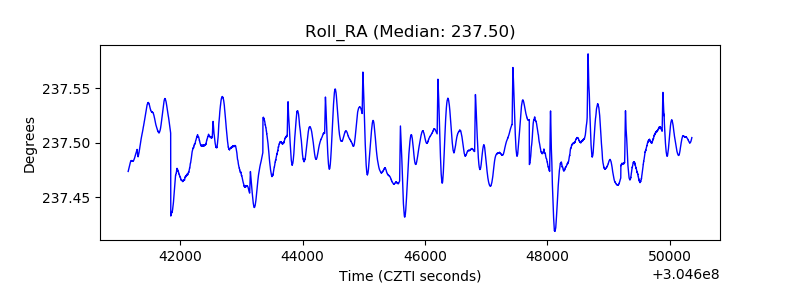 |
| Veto Counter | 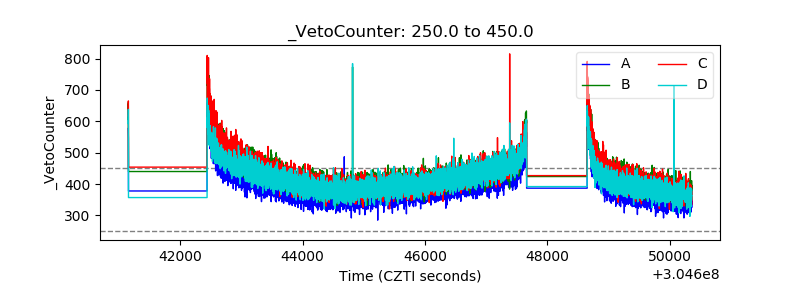 |