| Param | Original file | Final file |
|---|---|---|
| Filename | modeM0/AS1C04_001T01_9000003126_21165cztM0_level2.evt | modeM0/AS1C04_001T01_9000003126_21165cztM0_level2_quad_clean.evt |
| Size (bytes) | 550,584,000 | 137,741,760 |
| Size | 525.1 MB | 131.4 MB |
| Events in quadrant A | 4,185,417 | 912,812 |
| Events in quadrant B | 3,603,374 | 943,906 |
| Events in quadrant C | 3,415,079 | 919,473 |
| Events in quadrant D | 4,970,886 | 882,995 |
| Mode M9 | |||
|---|---|---|---|
| Quadrant | BADHDUFLAG | Total packets | Discarded packets |
| A | 0 | 7 | 0 |
| B | 0 | 8 | 0 |
| C | 0 | 8 | 0 |
| D | 0 | 8 | 0 |
| Mode M0 | |||
|---|---|---|---|
| Quadrant | BADHDUFLAG | Total packets | Discarded packets |
| A | 0 | 17548 | 2 |
| B | 0 | 15621 | 2 |
| C | 0 | 15134 | 2 |
| D | 0 | 19897 | 2 |
| Mode SS | |||
|---|---|---|---|
| Quadrant | BADHDUFLAG | Total packets | Discarded packets |
| A | 0 | 150 | 0 |
| B | 0 | 150 | 0 |
| C | 0 | 150 | 0 |
| D | 0 | 150 | 0 |
| Quadrant | Total seconds | Saturated seconds | Saturation percentage |
|---|---|---|---|
| A | 7366 | 242 | 3.285365% |
| B | 7366 | 84 | 1.140375% |
| C | 7366 | 89 | 1.208254% |
| D | 7366 | 177 | 2.402932% |
Noise dominated data is calculated using 1-second bins in cleaned event files. If a bin has >2000 counts, and if more than 50% of those come from <1% of pixels, then it is considered to be noise-dominated and hence unusable.
| Quadrant | # 1 sec bins | Bins with >0 counts | Bins with >2000 counts | High rate bins dominated by noise | Noise dominated (total time) | Noise dominated (detector-on time) | Marked lightcurve |
|---|---|---|---|---|---|---|---|
| A | 7911 | 7367 | 131 | 131 | 1.66% | 1.78% | 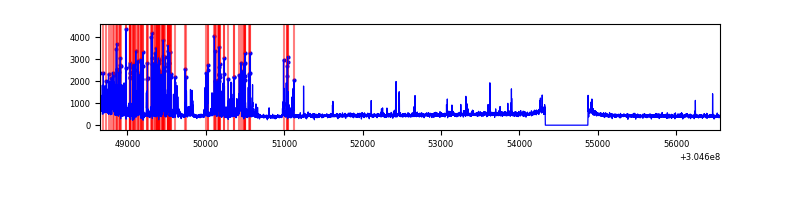 |
| B | 7911 | 7367 | 5 | 5 | 0.06% | 0.07% | 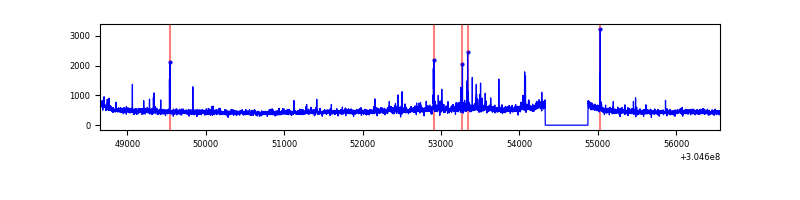 |
| C | 7911 | 7367 | 0 | 0 | 0.00% | 0.00% | 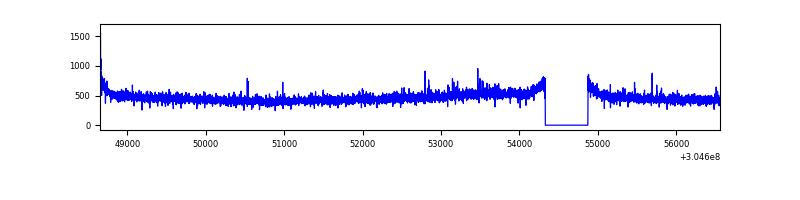 |
| D | 7911 | 7367 | 105 | 105 | 1.33% | 1.43% | 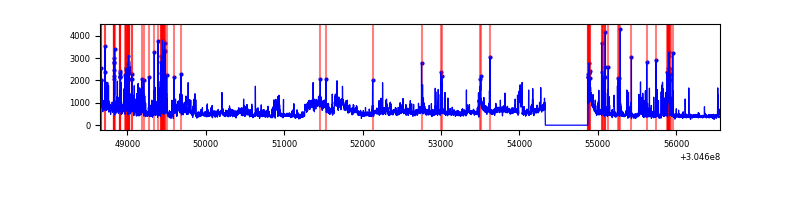 |
Top three noisy pixels from each quadrant. If the there are fewer than three noisy pixels in the level2.evt file, extra rows are filled as -1
| Pixel properties | Quadrant properties | ||||||
|---|---|---|---|---|---|---|---|
| Quadrant | DetID | PixID | Counts | Sigma | Mean | Median | Sigma |
| A | 5 | 16 | 904684 | 5334.87 | 843 | 825 | 169.4 |
| A | 15 | 192 | 14628 | 81.47 | 843 | 825 | 169.4 |
| A | 13 | 254 | 11130 | 60.82 | 843 | 825 | 169.4 |
| B | 3 | 64 | 59234 | 365.54 | 860 | 838 | 159.8 |
| B | 0 | 229 | 47389 | 291.4 | 860 | 838 | 159.8 |
| B | 0 | 244 | 23895 | 144.33 | 860 | 838 | 159.8 |
| C | 14 | 238 | 130318 | 667.89 | 829 | 833 | 193.9 |
| C | 3 | 233 | 39537 | 199.64 | 829 | 833 | 193.9 |
| C | 0 | 10 | 8540 | 39.75 | 829 | 833 | 193.9 |
| D | 1 | 20 | 554802 | 2777.29 | 826 | 802 | 199.5 |
| D | 1 | 52 | 369388 | 1847.78 | 826 | 802 | 199.5 |
| D | 13 | 174 | 304706 | 1523.52 | 826 | 802 | 199.5 |
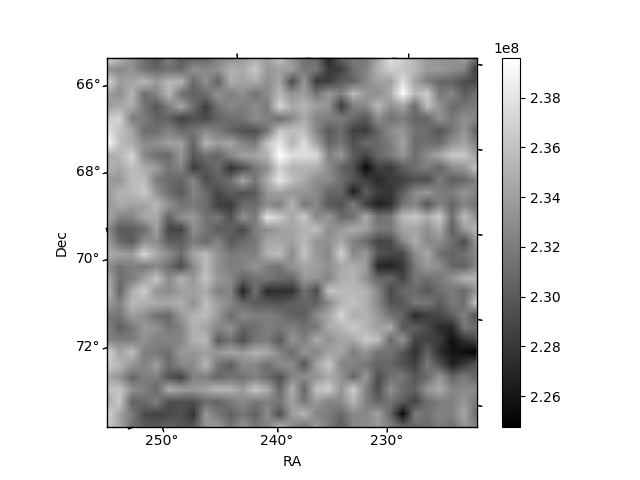
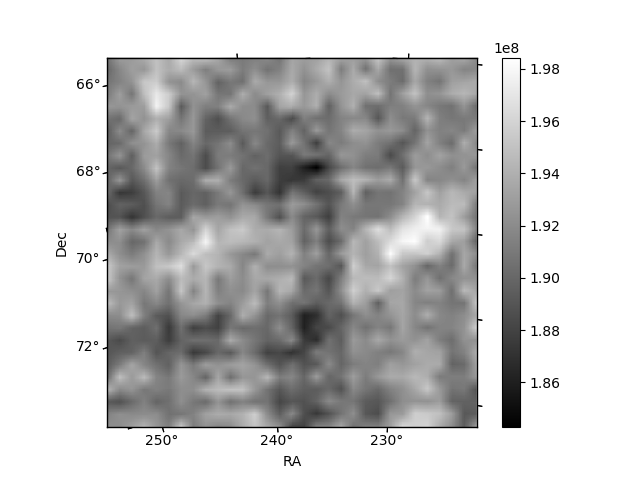
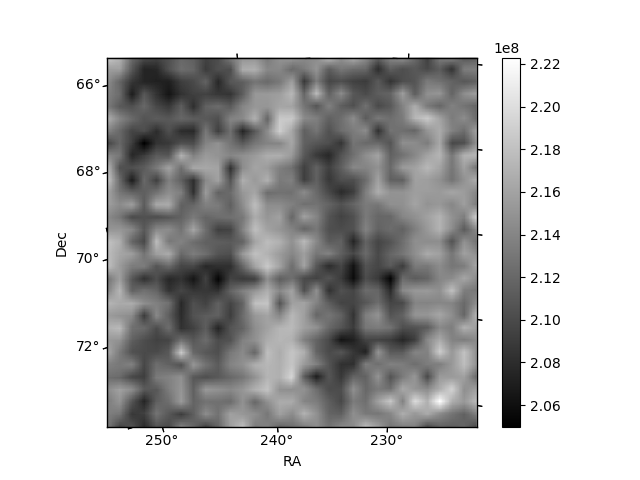
Histogram calculated using DETX and DETY for each event in the final _common_clean file
| Quadrant A | 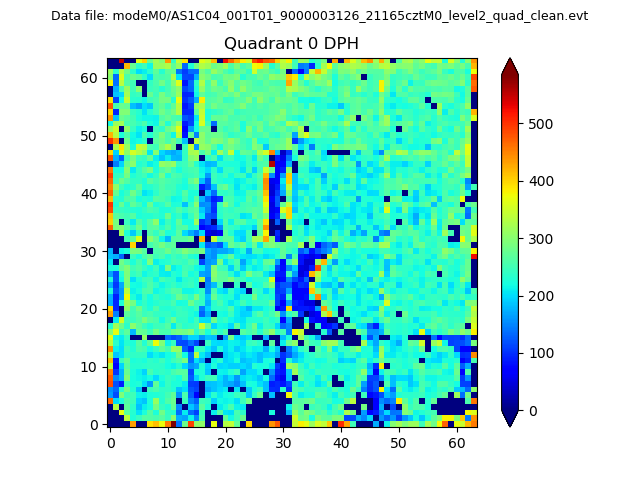 |
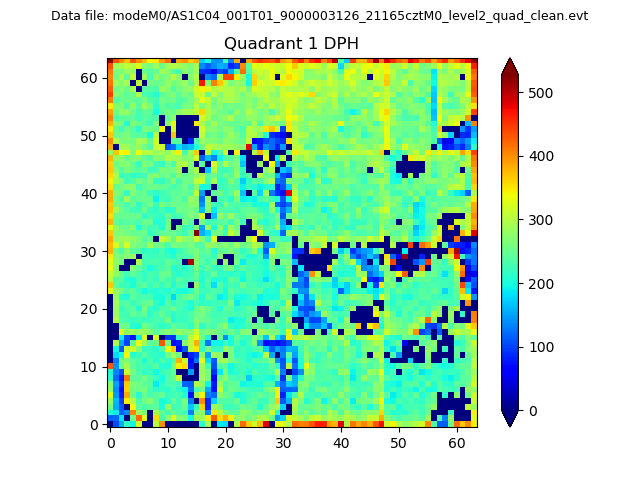 |
Quadrant B |
|---|---|---|---|
| Quadrant D | 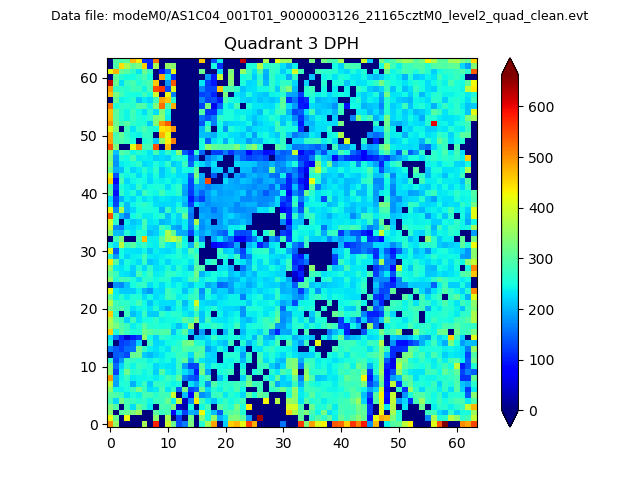 |
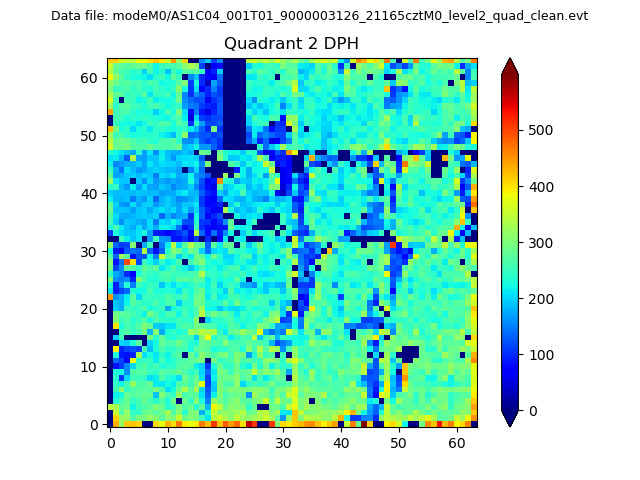 |
Quadrant C |
| Plot type | Count rate plots | Images |
|---|---|---|
| Comparison with Poisson distribution Blue bars denote a histogram of data divided into 1 sec bins. Red curve is a Poisson curve with rate = median count rate of data. |
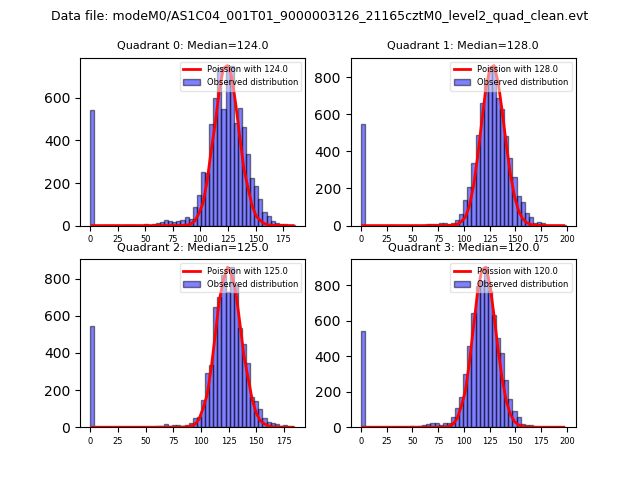 |
 |
| Quadrant-wise count rates Data is divided into 100 sec bins |
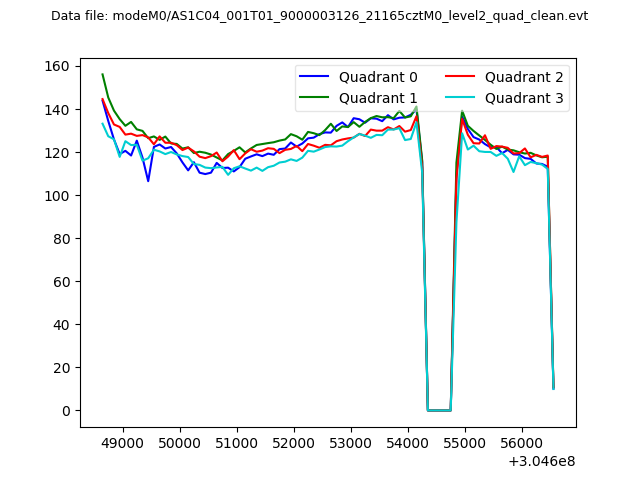 |
|
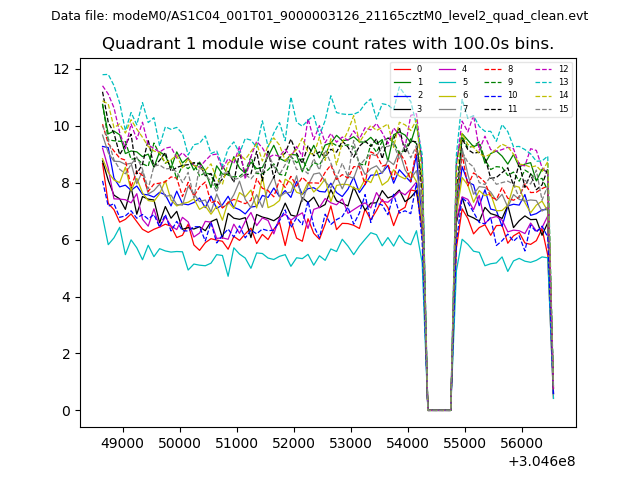
| Module-wise count rates for Quadrant A Data is divided into 100 sec bins |
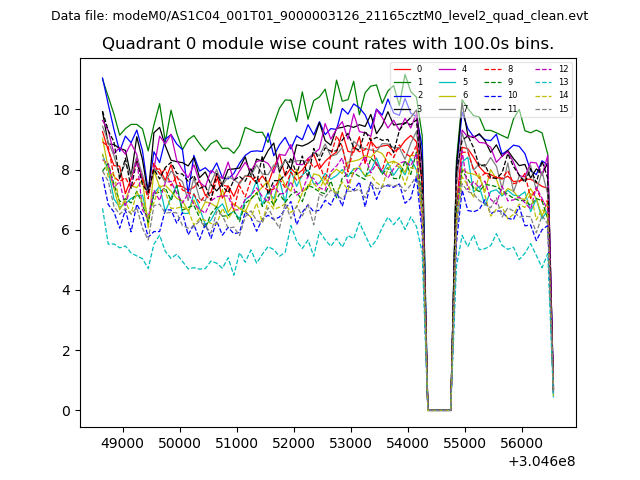 |
 |
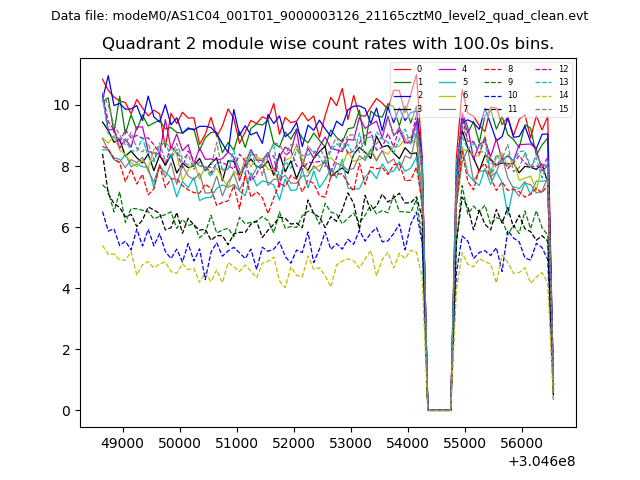
| Module-wise count rates for Quadrant B Data is divided into 100 sec bins |
 |
 |
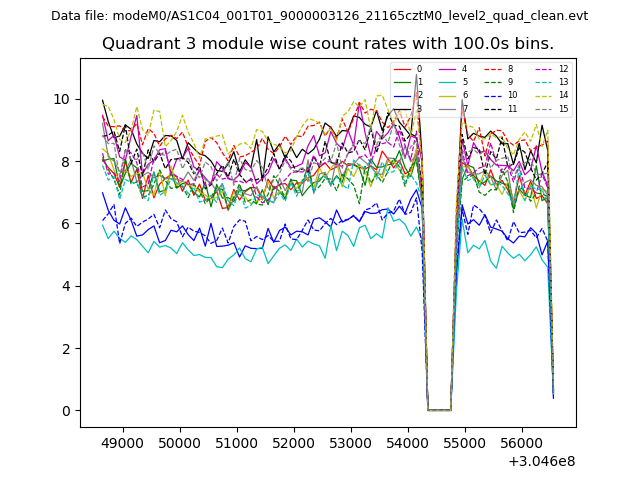
| Module-wise count rates for Quadrant C Data is divided into 100 sec bins |
 |
 |
| Module-wise count rates for Quadrant D Data is divided into 100 sec bins |
 |
 |
| Parameter | Plot |
|---|---|
| CZT HV Monitor | 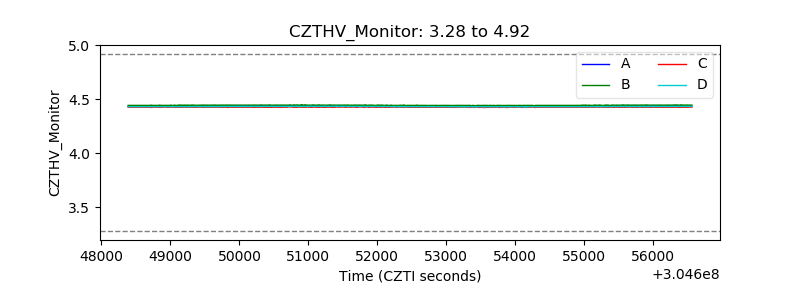 |
| D_VDD | 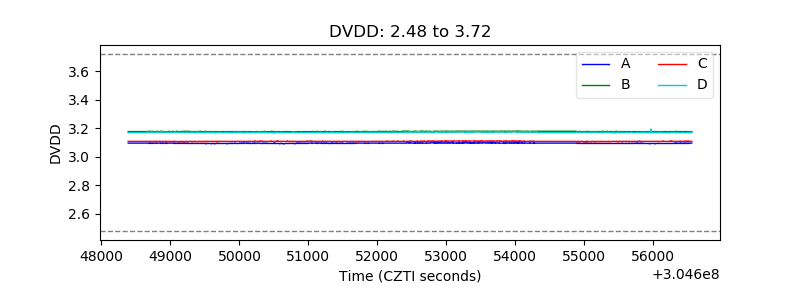 |
| Temperature 1 | 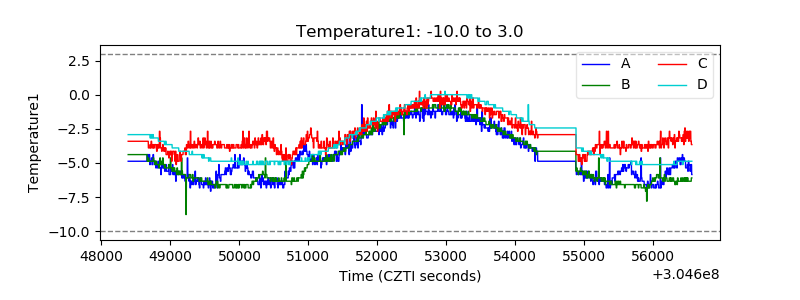 |
| Veto HV Monitor | 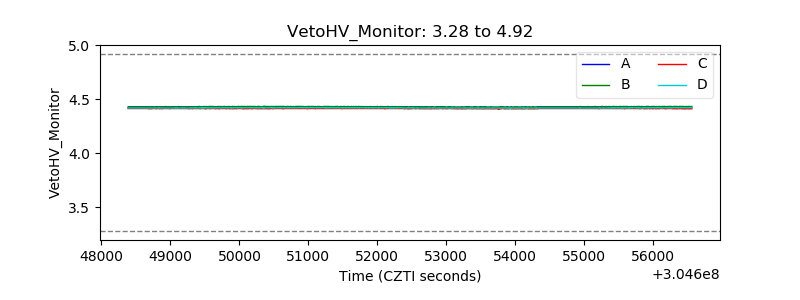 |
| Veto LLD | 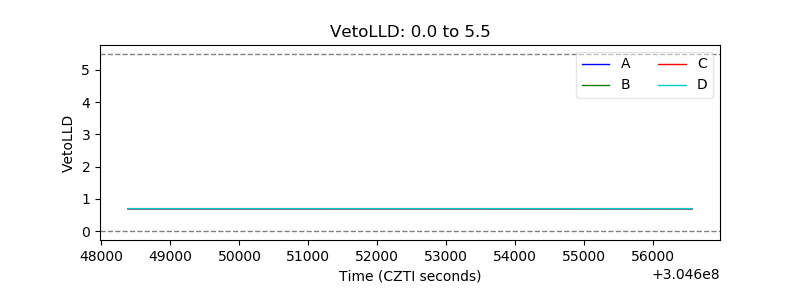 |
| Alpha Counter | 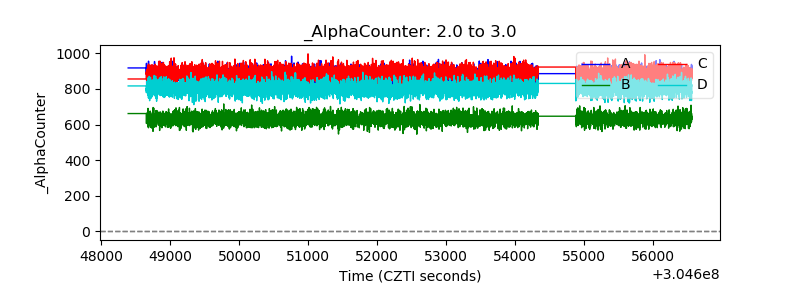 |
| _CPM_Rate | 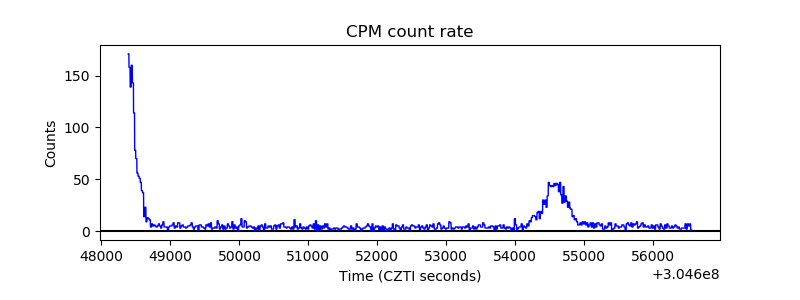 |
| CZT Counter | 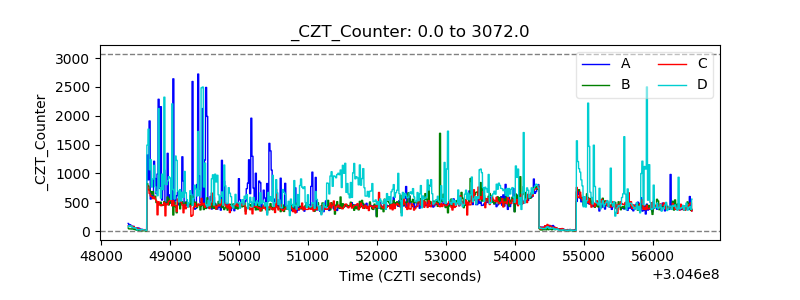 |
| +2.5 Volts monitor |  |
| +5 Volts monitor |  |
| _ROLL_ROT | 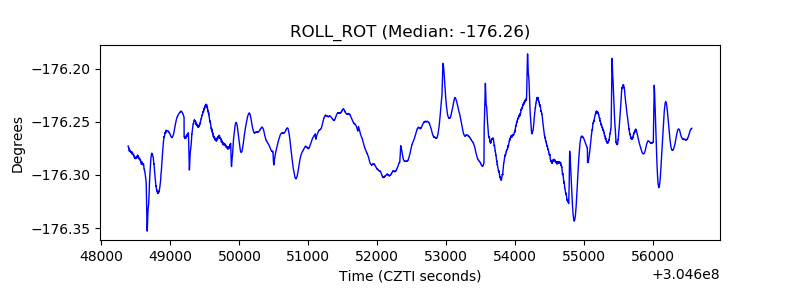 |
| _Roll_DEC | 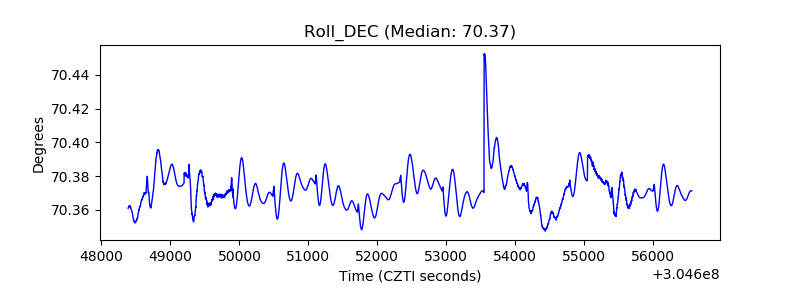 |
| _Roll_RA |  |
| Veto Counter | 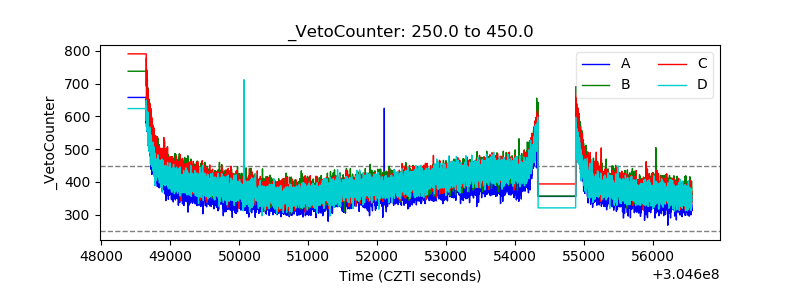 |