| Param | Original file | Final file |
|---|---|---|
| Filename | modeM0/AS1C04_001T01_9000003126_21166cztM0_level2.evt | modeM0/AS1C04_001T01_9000003126_21166cztM0_level2_quad_clean.evt |
| Size (bytes) | 570,525,120 | 148,950,720 |
| Size | 544.1 MB | 142.1 MB |
| Events in quadrant A | 4,034,088 | 993,302 |
| Events in quadrant B | 3,984,880 | 1,017,799 |
| Events in quadrant C | 3,778,842 | 987,643 |
| Events in quadrant D | 4,933,559 | 952,550 |
| Mode M9 | |||
|---|---|---|---|
| Quadrant | BADHDUFLAG | Total packets | Discarded packets |
| A | 0 | 6 | 0 |
| B | 0 | 6 | 0 |
| C | 0 | 6 | 0 |
| D | 0 | 6 | 0 |
| Mode M0 | |||
|---|---|---|---|
| Quadrant | BADHDUFLAG | Total packets | Discarded packets |
| A | 0 | 17618 | 2 |
| B | 0 | 17229 | 2 |
| C | 0 | 16694 | 2 |
| D | 0 | 20429 | 2 |
| Mode SS | |||
|---|---|---|---|
| Quadrant | BADHDUFLAG | Total packets | Discarded packets |
| A | 0 | 166 | 0 |
| B | 0 | 166 | 0 |
| C | 0 | 166 | 0 |
| D | 0 | 166 | 0 |
| Quadrant | Total seconds | Saturated seconds | Saturation percentage |
|---|---|---|---|
| A | 8054 | 258 | 3.203377% |
| B | 8055 | 233 | 2.892613% |
| C | 8055 | 173 | 2.147734% |
| D | 8055 | 275 | 3.414029% |
Noise dominated data is calculated using 1-second bins in cleaned event files. If a bin has >2000 counts, and if more than 50% of those come from <1% of pixels, then it is considered to be noise-dominated and hence unusable.
| Quadrant | # 1 sec bins | Bins with >0 counts | Bins with >2000 counts | High rate bins dominated by noise | Noise dominated (total time) | Noise dominated (detector-on time) | Marked lightcurve |
|---|---|---|---|---|---|---|---|
| A | 8684 | 8057 | 81 | 81 | 0.93% | 1.01% | 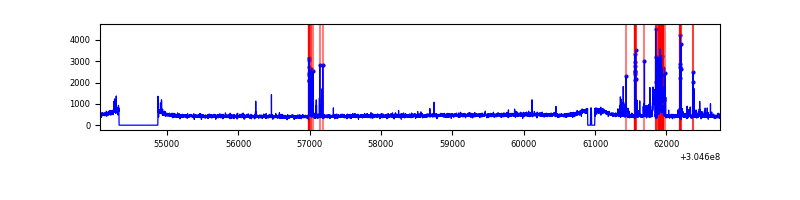 |
| B | 8685 | 8058 | 7 | 7 | 0.08% | 0.09% | 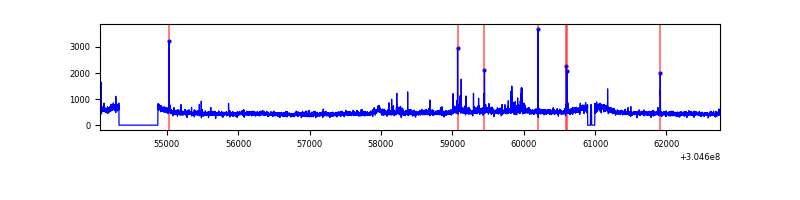 |
| C | 8685 | 8058 | 0 | 0 | 0.00% | 0.00% | 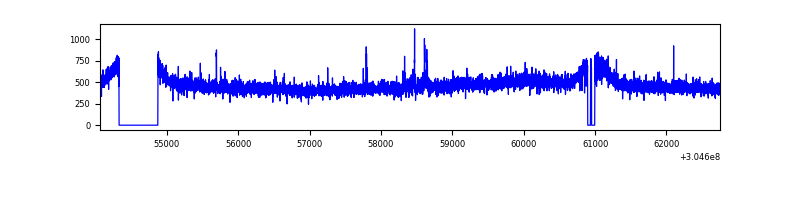 |
| D | 8685 | 8058 | 135 | 135 | 1.55% | 1.68% | 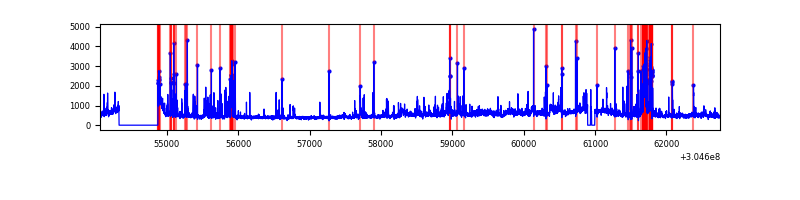 |
Top three noisy pixels from each quadrant. If the there are fewer than three noisy pixels in the level2.evt file, extra rows are filled as -1
| Pixel properties | Quadrant properties | ||||||
|---|---|---|---|---|---|---|---|
| Quadrant | DetID | PixID | Counts | Sigma | Mean | Median | Sigma |
| A | 5 | 16 | 405311 | 2113.7 | 939 | 917 | 191.3 |
| A | 13 | 254 | 12332 | 59.66 | 939 | 917 | 191.3 |
| A | 0 | 226 | 7993 | 36.99 | 939 | 917 | 191.3 |
| B | 0 | 189 | 49194 | 268.43 | 952 | 927 | 179.8 |
| B | 0 | 229 | 41963 | 228.22 | 952 | 927 | 179.8 |
| B | 0 | 228 | 39148 | 212.56 | 952 | 927 | 179.8 |
| C | 14 | 238 | 143645 | 659.98 | 919 | 924 | 216.3 |
| C | 3 | 233 | 39741 | 179.5 | 919 | 924 | 216.3 |
| C | 13 | 61 | 6392 | 25.29 | 919 | 924 | 216.3 |
| D | 1 | 52 | 502868 | 2257.63 | 914 | 884 | 222.4 |
| D | 1 | 20 | 496432 | 2228.68 | 914 | 884 | 222.4 |
| D | 7 | 238 | 147633 | 659.99 | 914 | 884 | 222.4 |
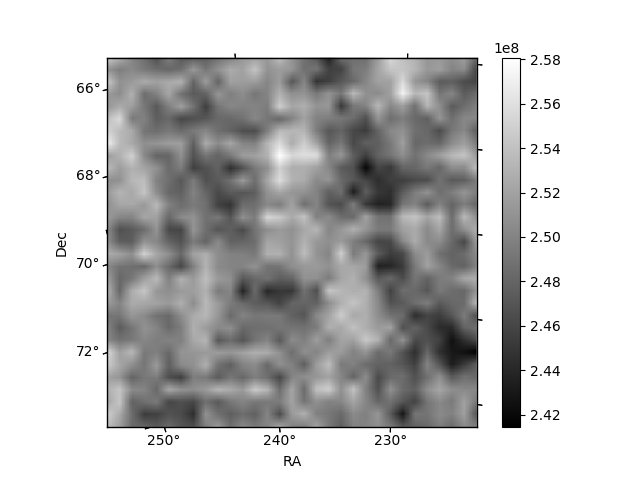
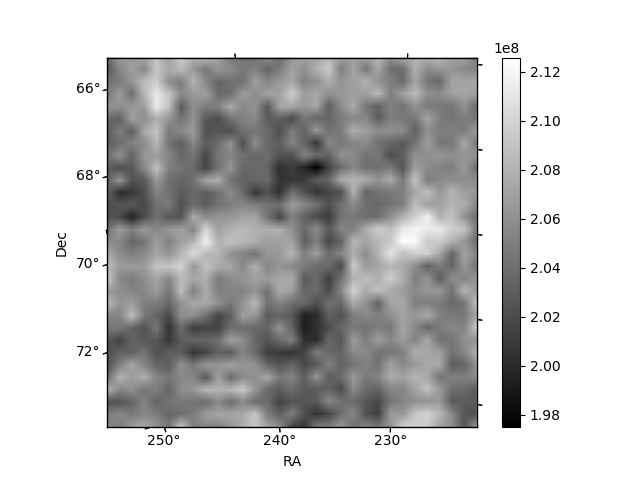
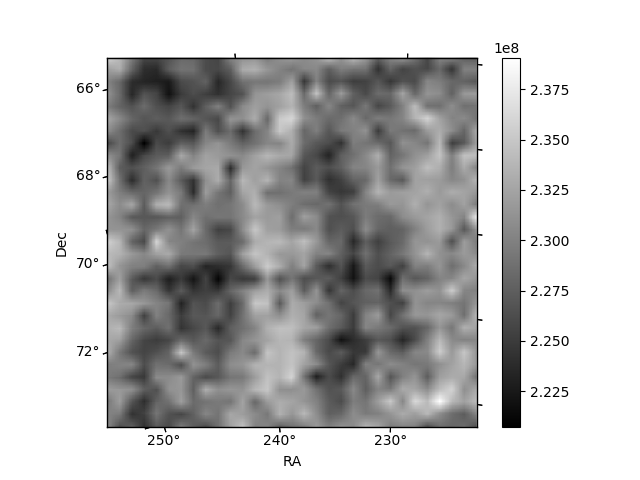
Histogram calculated using DETX and DETY for each event in the final _common_clean file
| Quadrant A | 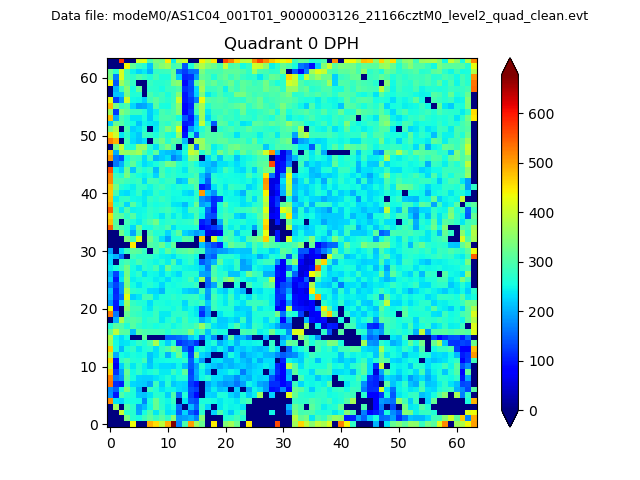 |
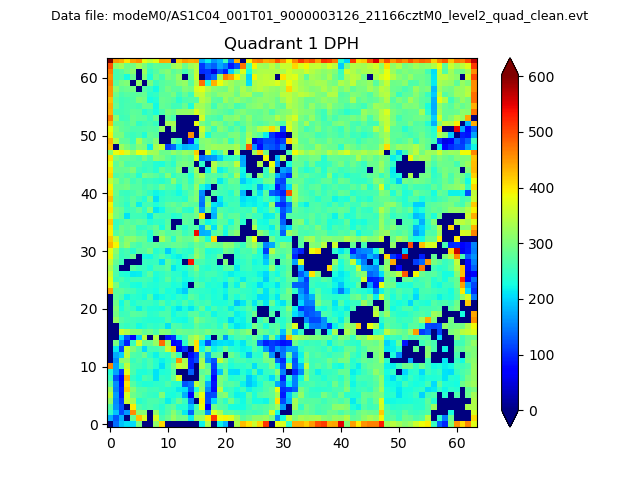 |
Quadrant B |
|---|---|---|---|
| Quadrant D | 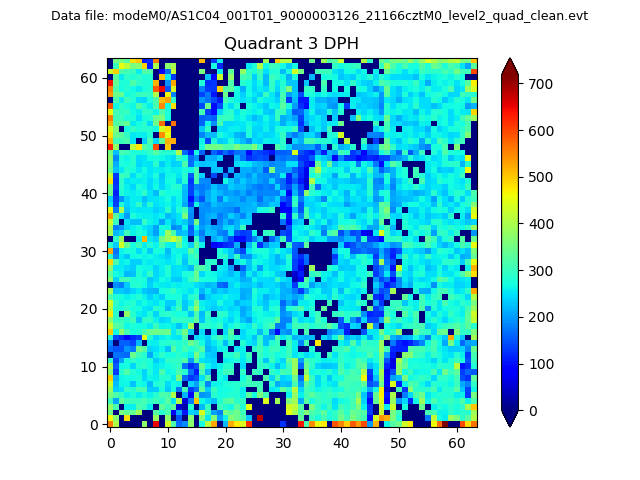 |
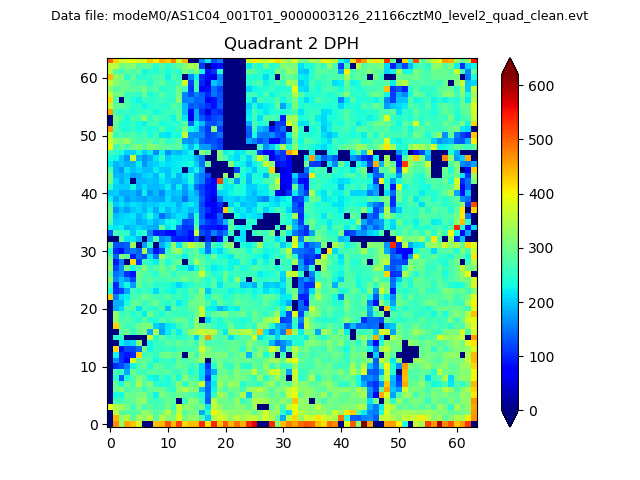 |
Quadrant C |
| Plot type | Count rate plots | Images |
|---|---|---|
| Comparison with Poisson distribution Blue bars denote a histogram of data divided into 1 sec bins. Red curve is a Poisson curve with rate = median count rate of data. |
 |
 |
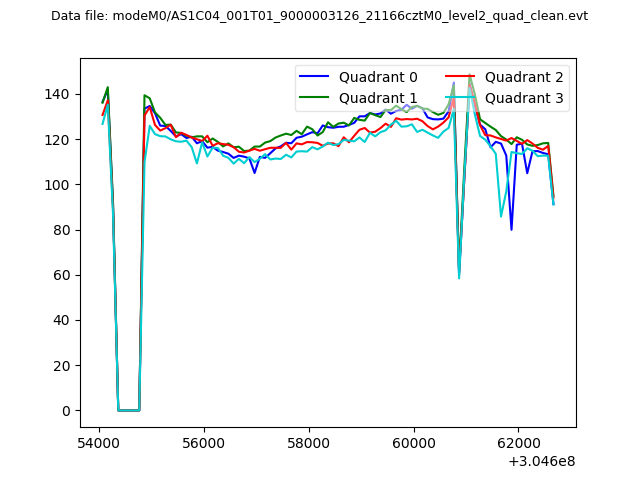
| Quadrant-wise count rates Data is divided into 100 sec bins |
 |
|
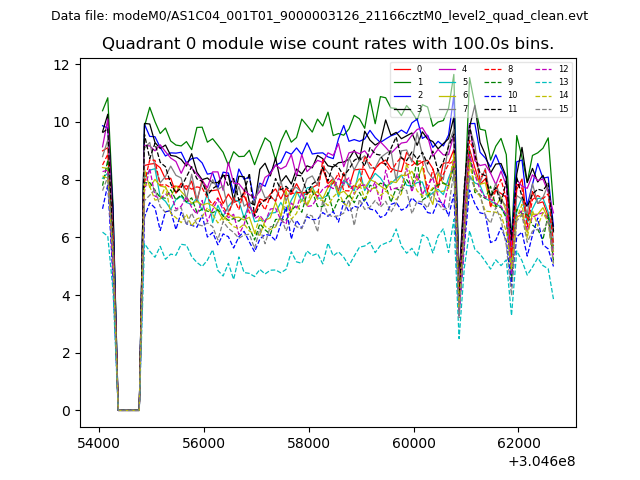
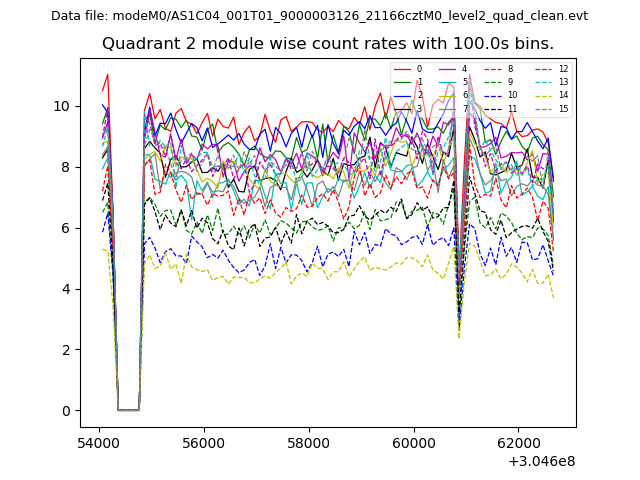
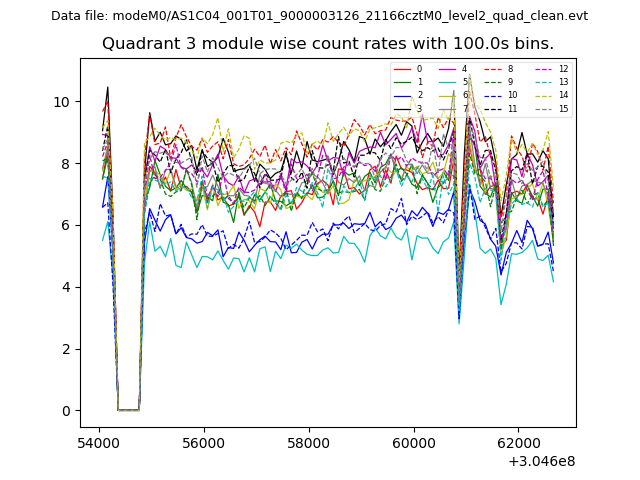
| Module-wise count rates for Quadrant A Data is divided into 100 sec bins |
 |
 |
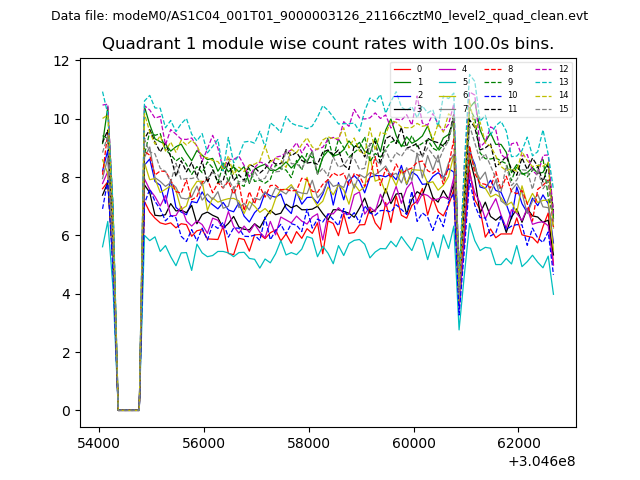
| Module-wise count rates for Quadrant B Data is divided into 100 sec bins |
 |
 |
| Module-wise count rates for Quadrant C Data is divided into 100 sec bins |
 |
 |
| Module-wise count rates for Quadrant D Data is divided into 100 sec bins |
 |
 |
| Parameter | Plot |
|---|---|
| CZT HV Monitor | 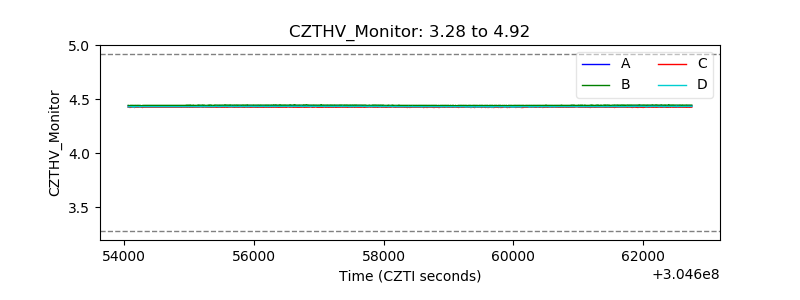 |
| D_VDD | 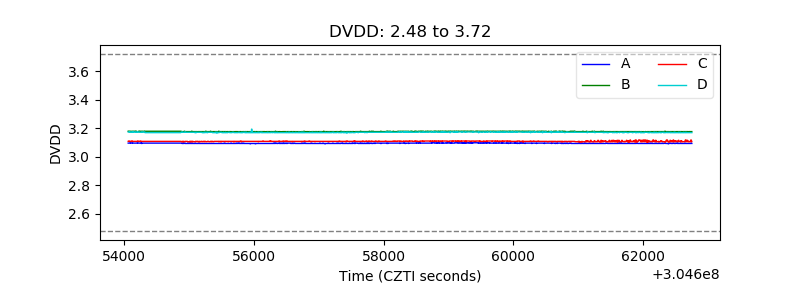 |
| Temperature 1 | 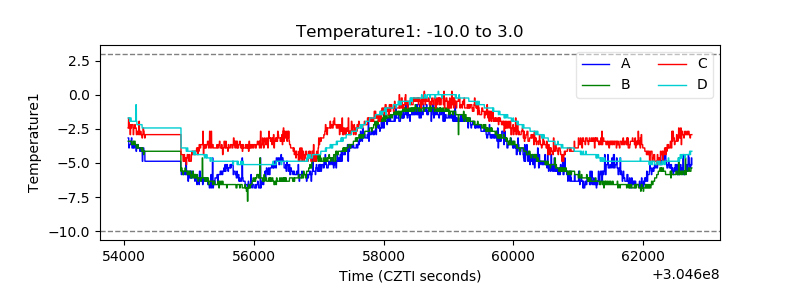 |
| Veto HV Monitor | 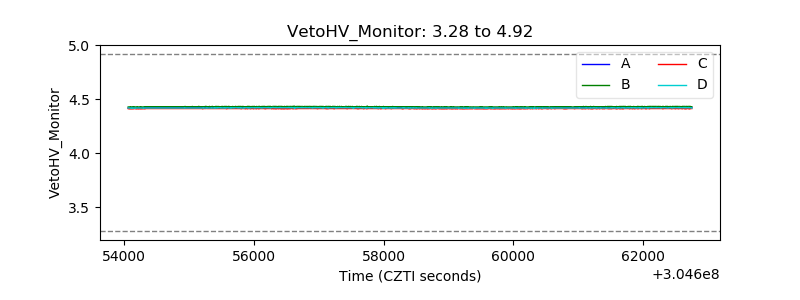 |
| Veto LLD | 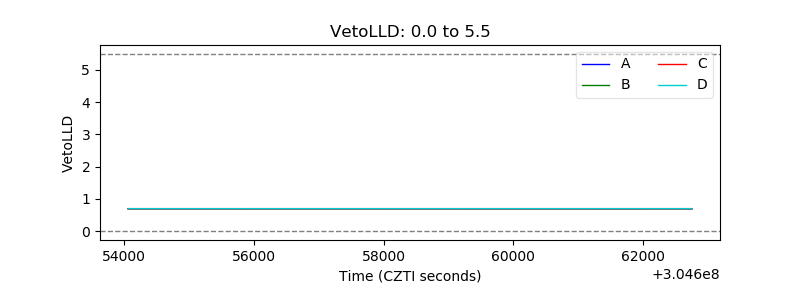 |
| Alpha Counter |  |
| _CPM_Rate | 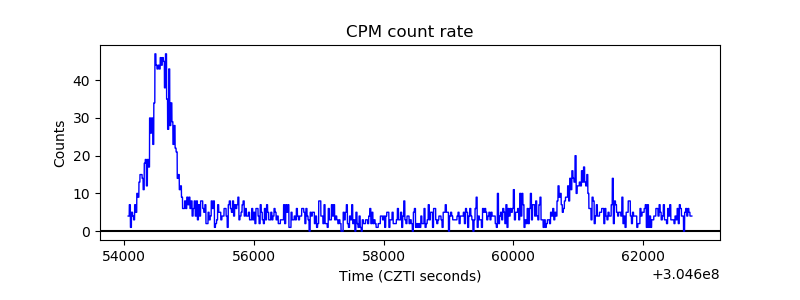 |
| CZT Counter |  |
| +2.5 Volts monitor |  |
| +5 Volts monitor |  |
| _ROLL_ROT | 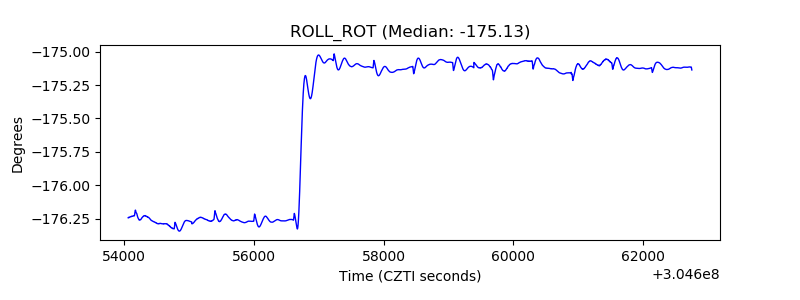 |
| _Roll_DEC | 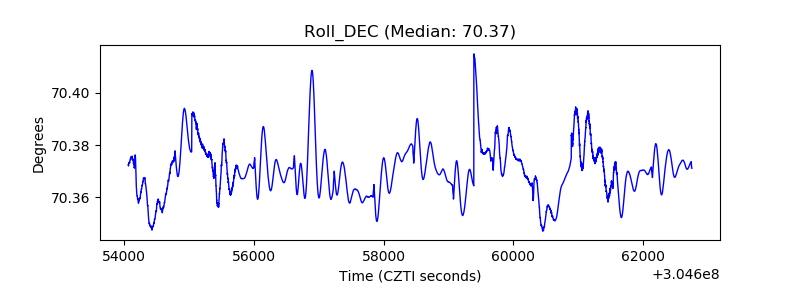 |
| _Roll_RA |  |
| Veto Counter | 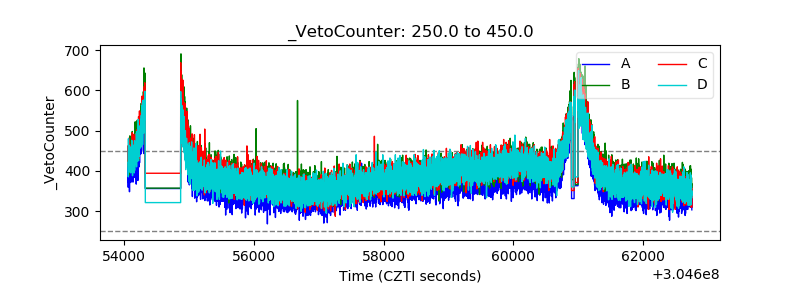 |