| Param | Original file | Final file |
|---|---|---|
| Filename | modeM0/AS1C04_001T01_9000003126_21167cztM0_level2.evt | modeM0/AS1C04_001T01_9000003126_21167cztM0_level2_quad_clean.evt |
| Size (bytes) | 652,711,680 | 125,242,560 |
| Size | 622.5 MB | 119.4 MB |
| Events in quadrant A | 3,428,751 | 855,173 |
| Events in quadrant B | 3,375,541 | 874,771 |
| Events in quadrant C | 3,205,015 | 847,347 |
| Events in quadrant D | 9,279,344 | 723,029 |
| Mode M9 | |||
|---|---|---|---|
| Quadrant | BADHDUFLAG | Total packets | Discarded packets |
| A | 0 | 3 | 0 |
| B | 0 | 3 | 0 |
| C | 0 | 3 | 0 |
| D | 0 | 3 | 0 |
| Mode M0 | |||
|---|---|---|---|
| Quadrant | BADHDUFLAG | Total packets | Discarded packets |
| A | 0 | 15088 | 1 |
| B | 0 | 14614 | 1 |
| C | 0 | 14301 | 1 |
| D | 0 | 32472 | 1 |
| Mode SS | |||
|---|---|---|---|
| Quadrant | BADHDUFLAG | Total packets | Discarded packets |
| A | 0 | 142 | 0 |
| B | 0 | 142 | 0 |
| C | 0 | 142 | 0 |
| D | 0 | 142 | 0 |
| Quadrant | Total seconds | Saturated seconds | Saturation percentage |
|---|---|---|---|
| A | 7070 | 130 | 1.838755% |
| B | 7071 | 57 | 0.806109% |
| C | 7071 | 54 | 0.763683% |
| D | 7071 | 1855 | 26.233913% |
Noise dominated data is calculated using 1-second bins in cleaned event files. If a bin has >2000 counts, and if more than 50% of those come from <1% of pixels, then it is considered to be noise-dominated and hence unusable.
| Quadrant | # 1 sec bins | Bins with >0 counts | Bins with >2000 counts | High rate bins dominated by noise | Noise dominated (total time) | Noise dominated (detector-on time) | Marked lightcurve |
|---|---|---|---|---|---|---|---|
| A | 7350 | 7071 | 59 | 59 | 0.80% | 0.83% | 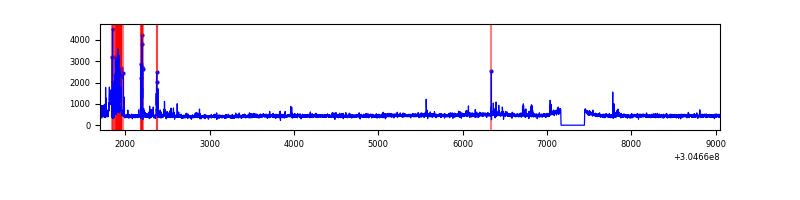 |
| B | 7351 | 7072 | 6 | 6 | 0.08% | 0.08% | 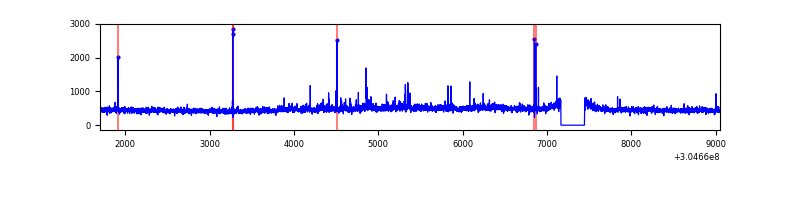 |
| C | 7351 | 7072 | 0 | 0 | 0.00% | 0.00% | 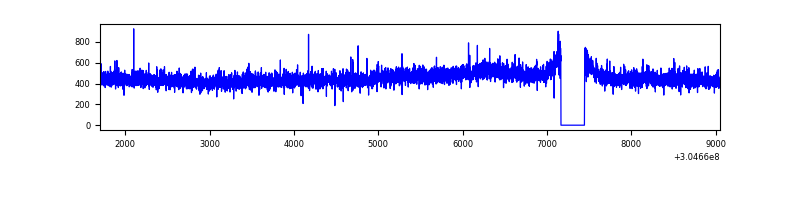 |
| D | 7351 | 7072 | 1609 | 1609 | 21.89% | 22.75% | 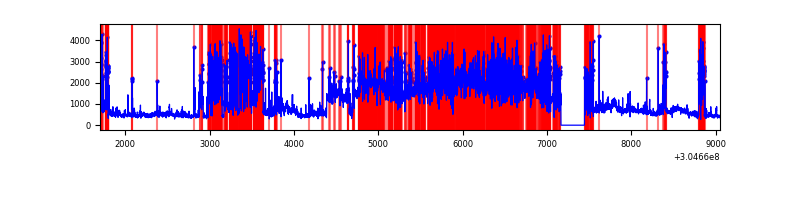 |
Top three noisy pixels from each quadrant. If the there are fewer than three noisy pixels in the level2.evt file, extra rows are filled as -1
| Pixel properties | Quadrant properties | ||||||
|---|---|---|---|---|---|---|---|
| Quadrant | DetID | PixID | Counts | Sigma | Mean | Median | Sigma |
| A | 5 | 16 | 297301 | 1800.32 | 807 | 789 | 164.7 |
| A | 2 | 79 | 19211 | 111.85 | 807 | 789 | 164.7 |
| A | 13 | 254 | 10615 | 59.66 | 807 | 789 | 164.7 |
| B | 0 | 189 | 28161 | 176.47 | 813 | 792 | 155.1 |
| B | 10 | 224 | 25492 | 159.26 | 813 | 792 | 155.1 |
| B | 0 | 182 | 22448 | 139.63 | 813 | 792 | 155.1 |
| C | 14 | 238 | 122710 | 664.24 | 783 | 787 | 183.6 |
| C | 3 | 233 | 13527 | 69.4 | 783 | 787 | 183.6 |
| C | 8 | 128 | 8761 | 43.44 | 783 | 787 | 183.6 |
| D | 1 | 20 | 3089865 | 17937.99 | 713 | 691 | 172.2 |
| D | 5 | 222 | 1302062 | 7556.71 | 713 | 691 | 172.2 |
| D | 1 | 239 | 1295248 | 7517.14 | 713 | 691 | 172.2 |
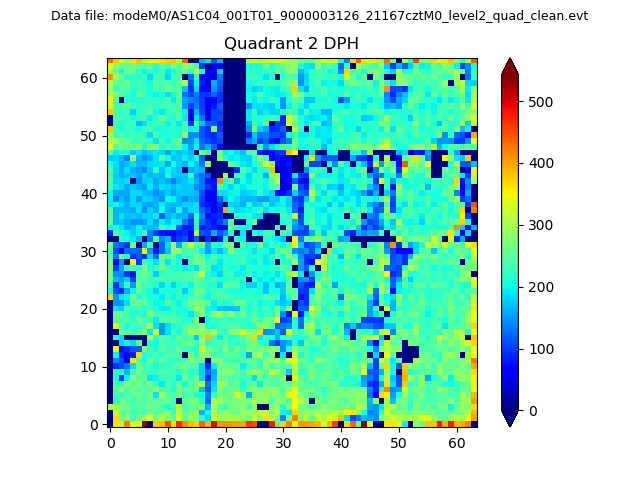
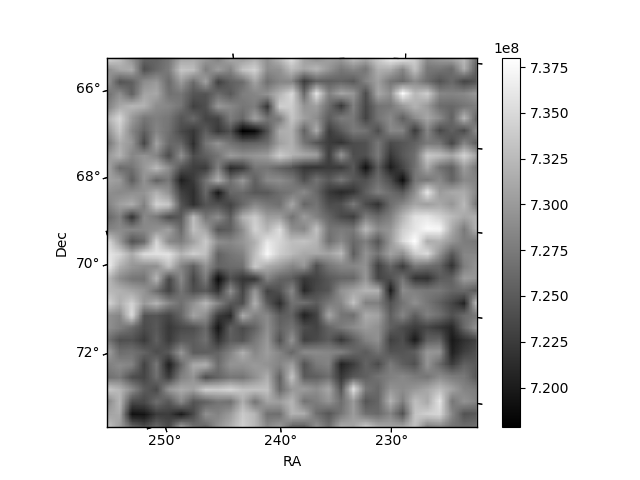
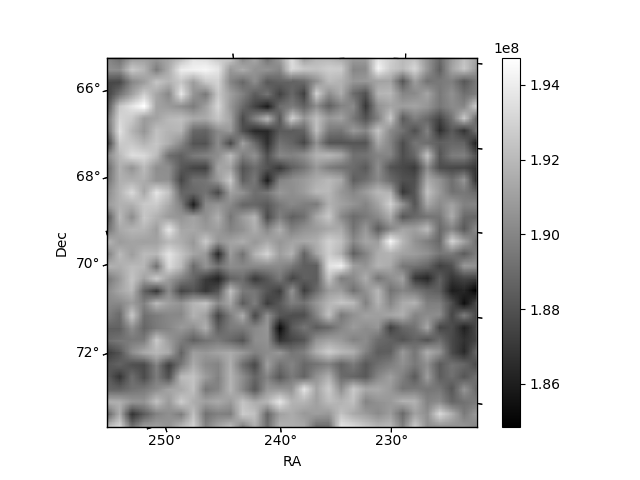
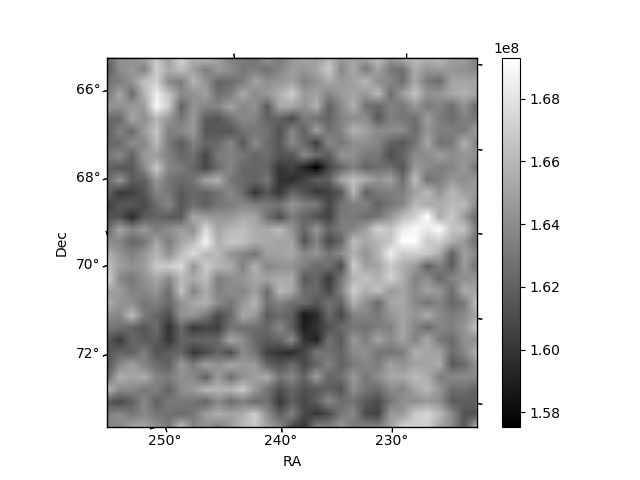
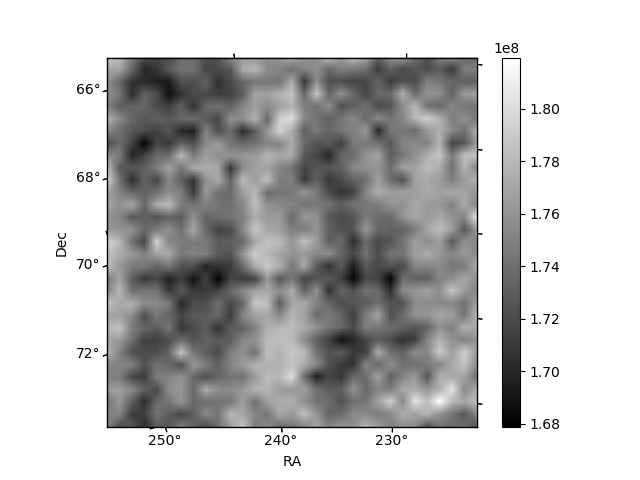
Histogram calculated using DETX and DETY for each event in the final _common_clean file
| Quadrant A | 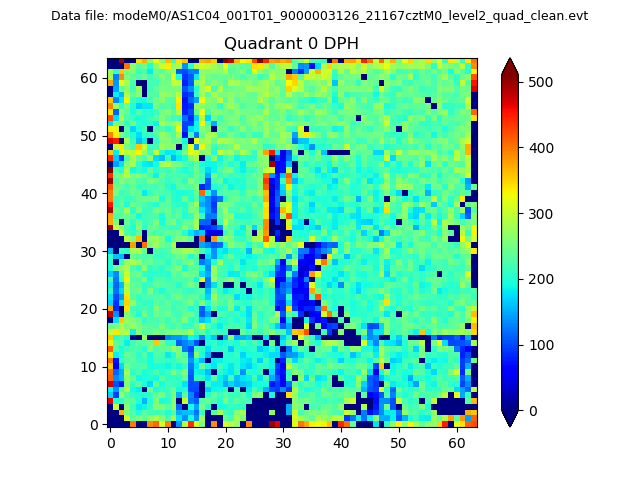 |
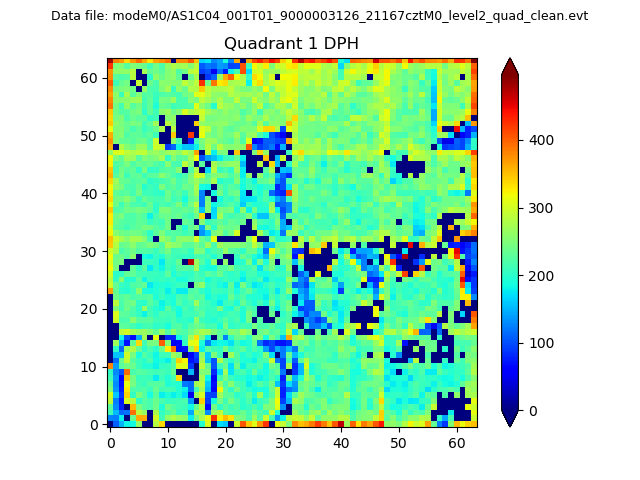 |
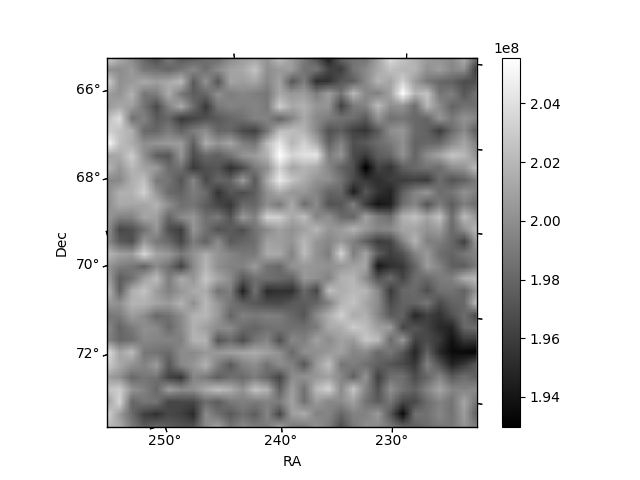
Quadrant B |
|---|---|---|---|
| Quadrant D | 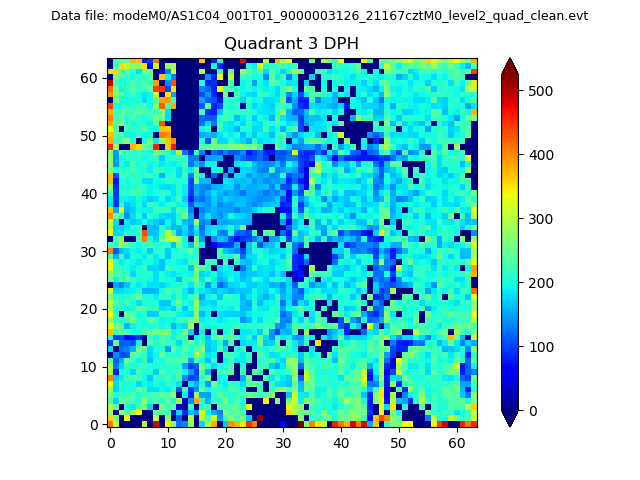 |
 |
Quadrant C |
| Plot type | Count rate plots | Images |
|---|---|---|
| Comparison with Poisson distribution Blue bars denote a histogram of data divided into 1 sec bins. Red curve is a Poisson curve with rate = median count rate of data. |
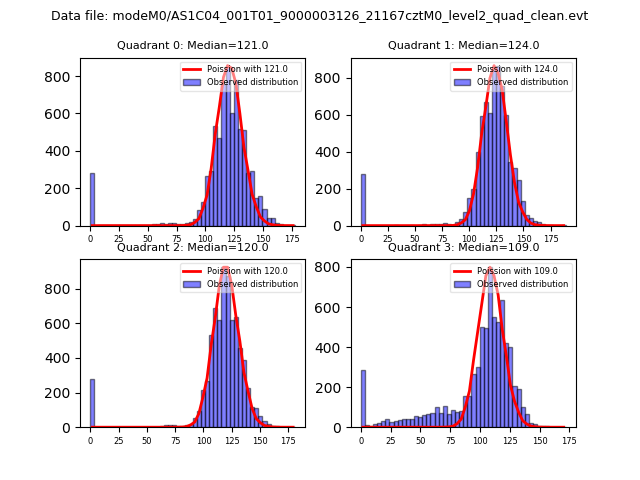 |
 |
| Quadrant-wise count rates Data is divided into 100 sec bins |
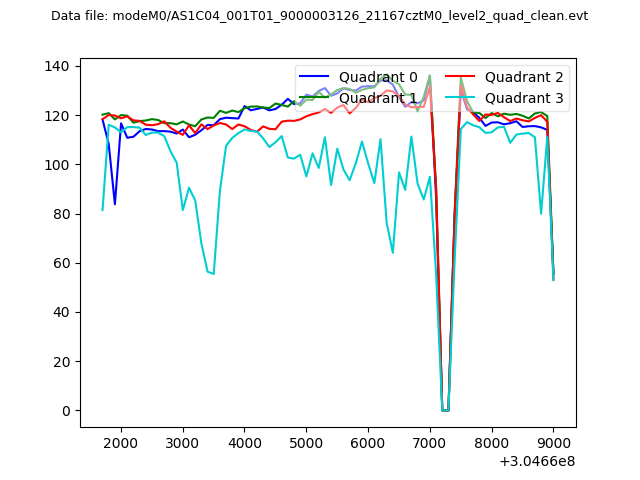 |
|
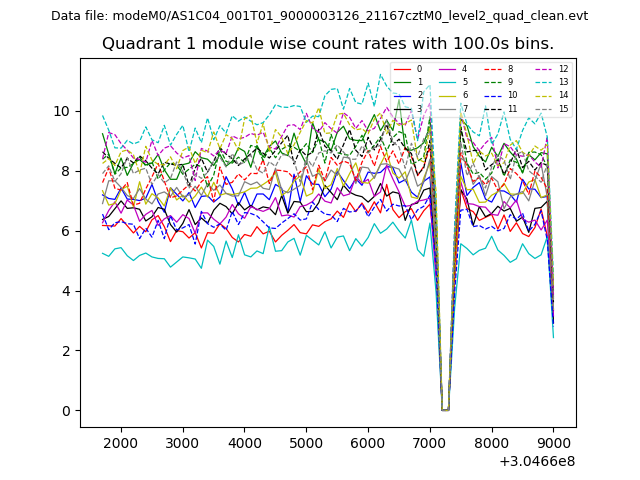
| Module-wise count rates for Quadrant A Data is divided into 100 sec bins |
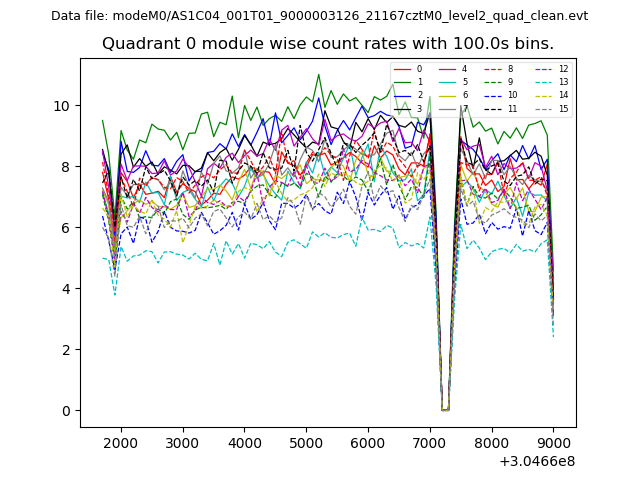 |
 |
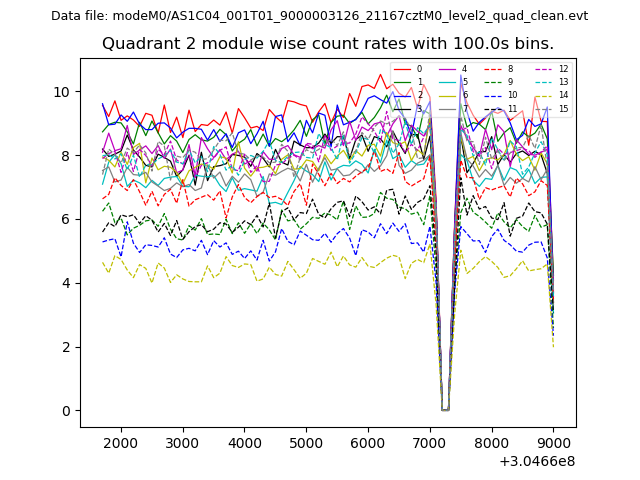
| Module-wise count rates for Quadrant B Data is divided into 100 sec bins |
 |
 |
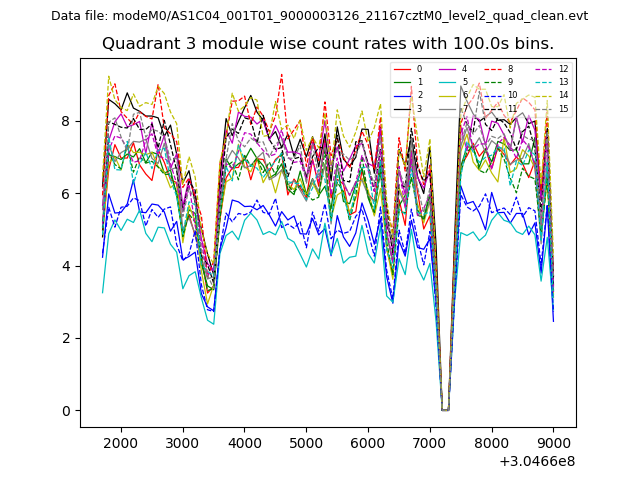
| Module-wise count rates for Quadrant C Data is divided into 100 sec bins |
 |
 |
| Module-wise count rates for Quadrant D Data is divided into 100 sec bins |
 |
 |
| Parameter | Plot |
|---|---|
| CZT HV Monitor | 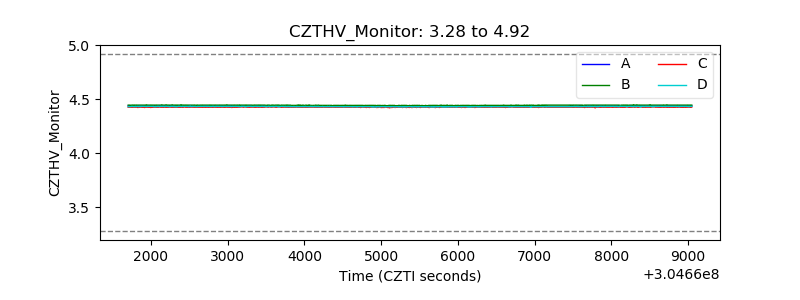 |
| D_VDD | 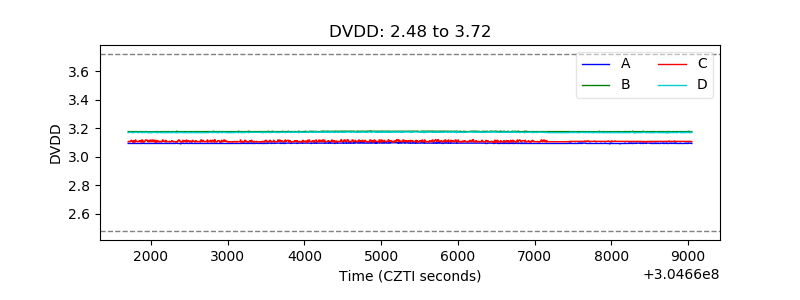 |
| Temperature 1 | 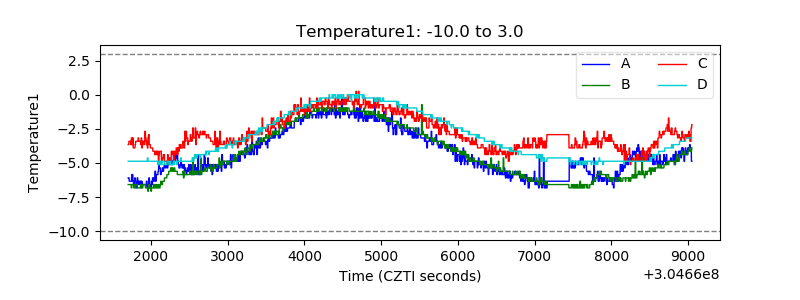 |
| Veto HV Monitor | 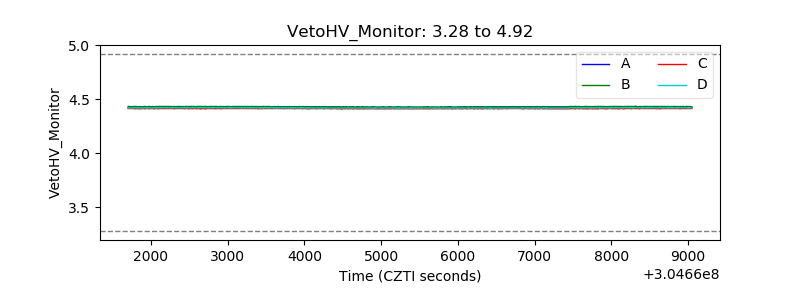 |
| Veto LLD | 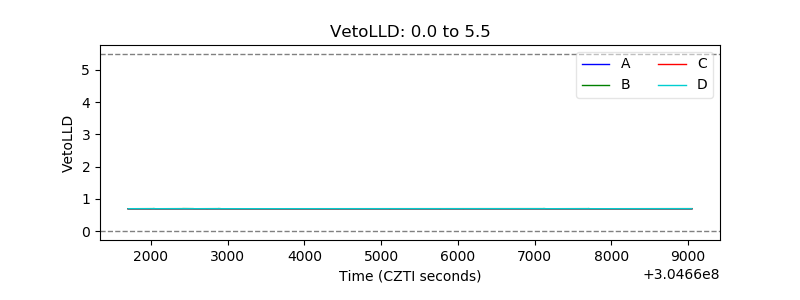 |
| Alpha Counter | 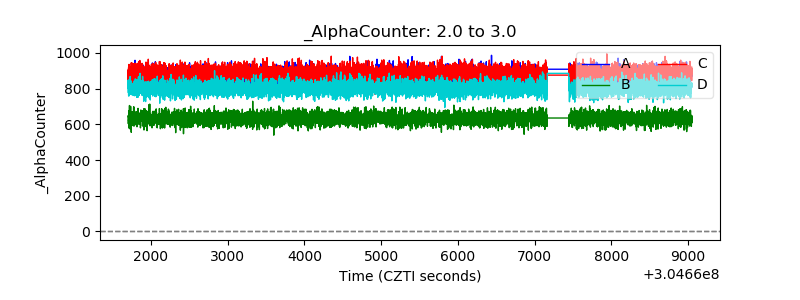 |
| _CPM_Rate | 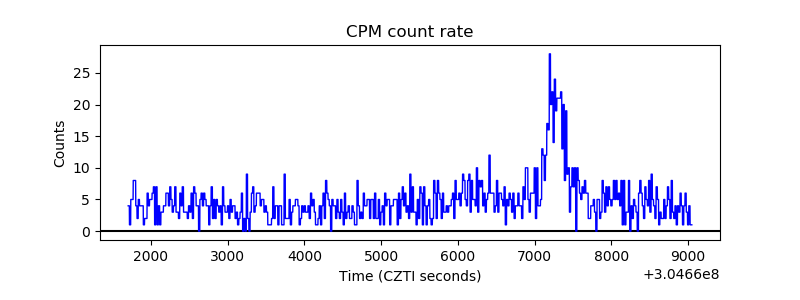 |
| CZT Counter | 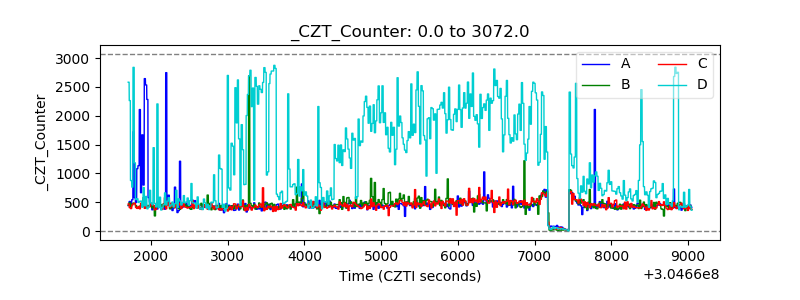 |
| +2.5 Volts monitor |  |
| +5 Volts monitor |  |
| _ROLL_ROT |  |
| _Roll_DEC | 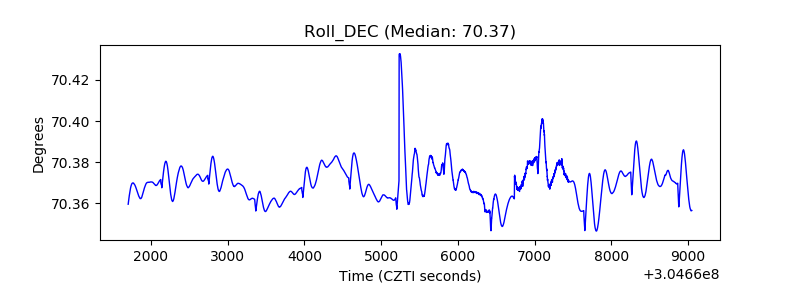 |
| _Roll_RA | 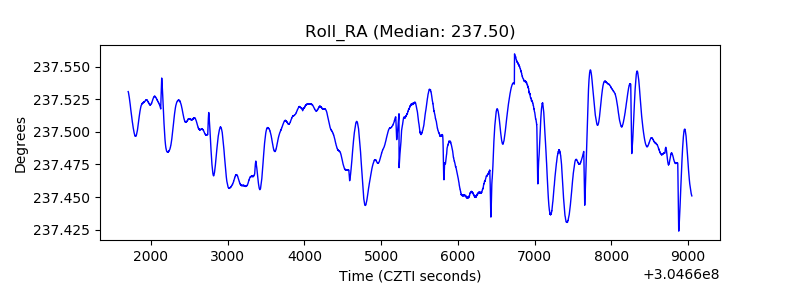 |
| Veto Counter | 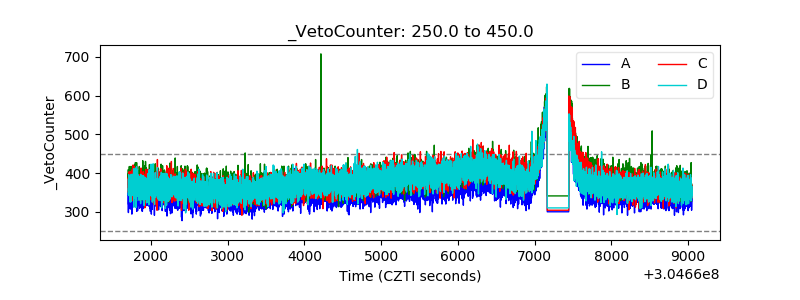 |