| Param | Original file | Final file |
|---|---|---|
| Filename | modeM0/AS1C04_001T01_9000003126_21170cztM0_level2.evt | modeM0/AS1C04_001T01_9000003126_21170cztM0_level2_quad_clean.evt |
| Size (bytes) | 857,678,400 | 165,795,840 |
| Size | 817.9 MB | 158.1 MB |
| Events in quadrant A | 4,318,757 | 1,129,285 |
| Events in quadrant B | 4,684,706 | 1,147,181 |
| Events in quadrant C | 4,183,082 | 1,102,820 |
| Events in quadrant D | 12,158,255 | 994,736 |
| Mode M9 | |||
|---|---|---|---|
| Quadrant | BADHDUFLAG | Total packets | Discarded packets |
| A | 0 | 4 | 0 |
| B | 0 | 4 | 0 |
| C | 0 | 4 | 0 |
| D | 0 | 4 | 0 |
| Mode M0 | |||
|---|---|---|---|
| Quadrant | BADHDUFLAG | Total packets | Discarded packets |
| A | 0 | 19350 | 1 |
| B | 0 | 19902 | 1 |
| C | 0 | 18831 | 1 |
| D | 0 | 42724 | 1 |
| Mode SS | |||
|---|---|---|---|
| Quadrant | BADHDUFLAG | Total packets | Discarded packets |
| A | 0 | 188 | 0 |
| B | 0 | 188 | 0 |
| C | 0 | 188 | 0 |
| D | 0 | 188 | 0 |
| Quadrant | Total seconds | Saturated seconds | Saturation percentage |
|---|---|---|---|
| A | 9333 | 84 | 0.900032% |
| B | 9334 | 75 | 0.803514% |
| C | 9334 | 78 | 0.835655% |
| D | 9334 | 1592 | 17.055925% |
Noise dominated data is calculated using 1-second bins in cleaned event files. If a bin has >2000 counts, and if more than 50% of those come from <1% of pixels, then it is considered to be noise-dominated and hence unusable.
| Quadrant | # 1 sec bins | Bins with >0 counts | Bins with >2000 counts | High rate bins dominated by noise | Noise dominated (total time) | Noise dominated (detector-on time) | Marked lightcurve |
|---|---|---|---|---|---|---|---|
| A | 9763 | 9334 | 17 | 17 | 0.17% | 0.18% | 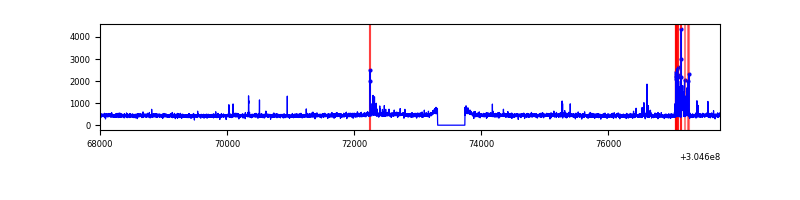 |
| B | 9764 | 9335 | 7 | 7 | 0.07% | 0.07% | 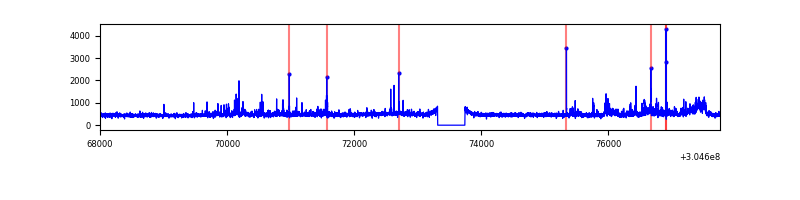 |
| C | 9764 | 9335 | 0 | 0 | 0.00% | 0.00% | 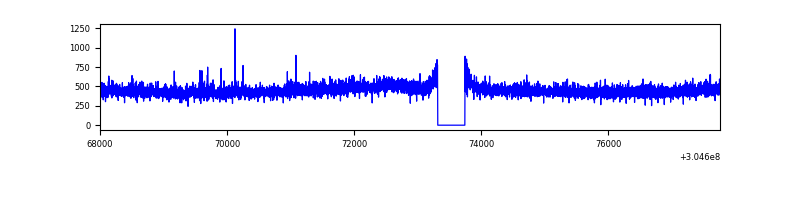 |
| D | 9764 | 9335 | 1414 | 1414 | 14.48% | 15.15% | 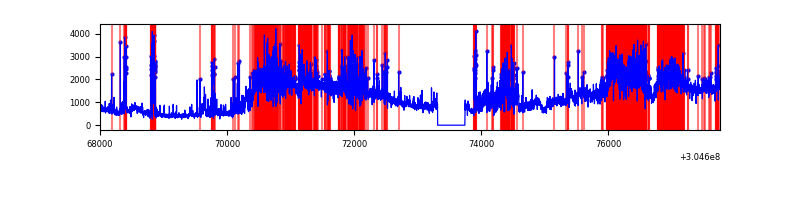 |
Top three noisy pixels from each quadrant. If the there are fewer than three noisy pixels in the level2.evt file, extra rows are filled as -1
| Pixel properties | Quadrant properties | ||||||
|---|---|---|---|---|---|---|---|
| Quadrant | DetID | PixID | Counts | Sigma | Mean | Median | Sigma |
| A | 5 | 16 | 196373 | 901.95 | 1067 | 1044 | 216.6 |
| A | 13 | 254 | 13123 | 55.78 | 1067 | 1044 | 216.6 |
| A | 0 | 226 | 9188 | 37.61 | 1067 | 1044 | 216.6 |
| B | 0 | 189 | 192273 | 951.31 | 1064 | 1036 | 201.0 |
| B | 0 | 230 | 56359 | 275.2 | 1064 | 1036 | 201.0 |
| B | 0 | 190 | 53745 | 262.2 | 1064 | 1036 | 201.0 |
| C | 14 | 238 | 160205 | 668.3 | 1022 | 1028 | 238.2 |
| C | 3 | 233 | 18942 | 75.21 | 1022 | 1028 | 238.2 |
| C | 10 | 91 | 8477 | 31.27 | 1022 | 1028 | 238.2 |
| D | 1 | 20 | 4912751 | 20527.43 | 990 | 959 | 239.3 |
| D | 7 | 238 | 2695346 | 11260.42 | 990 | 959 | 239.3 |
| D | 1 | 52 | 353798 | 1474.59 | 990 | 959 | 239.3 |
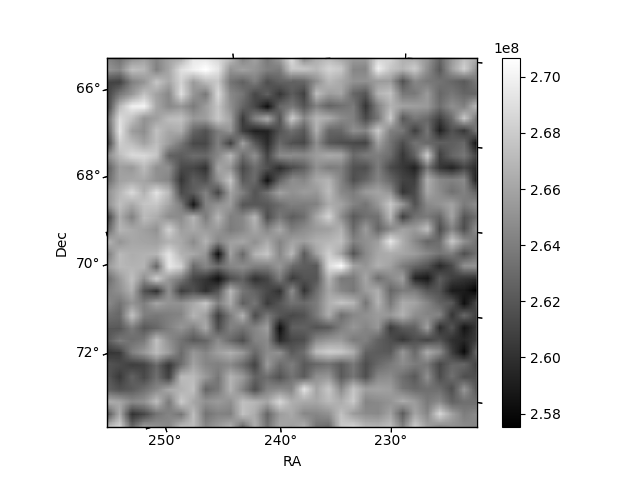
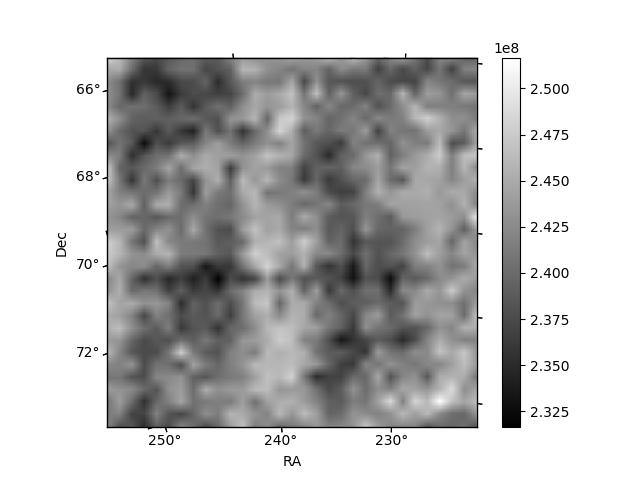
Histogram calculated using DETX and DETY for each event in the final _common_clean file
| Quadrant A | 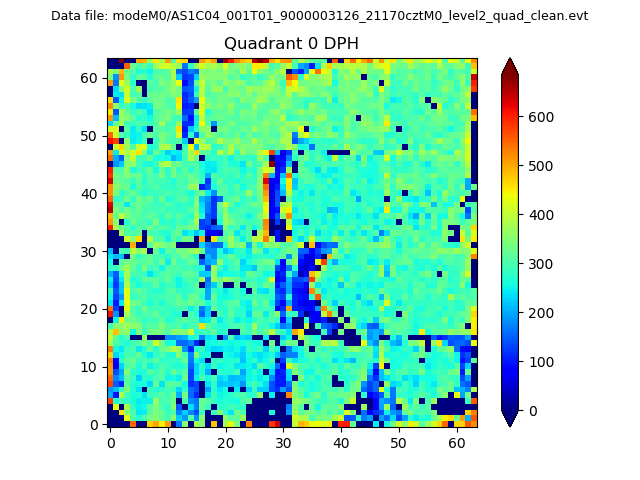 |
 |
Quadrant B |
|---|---|---|---|
| Quadrant D | 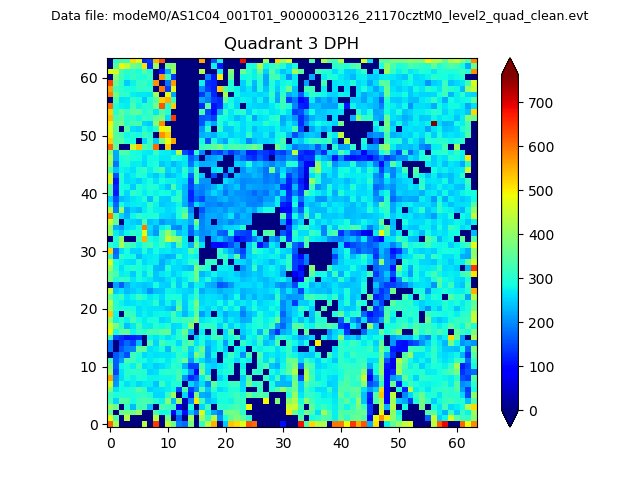 |
 |
Quadrant C |
| Plot type | Count rate plots | Images |
|---|---|---|
| Comparison with Poisson distribution Blue bars denote a histogram of data divided into 1 sec bins. Red curve is a Poisson curve with rate = median count rate of data. |
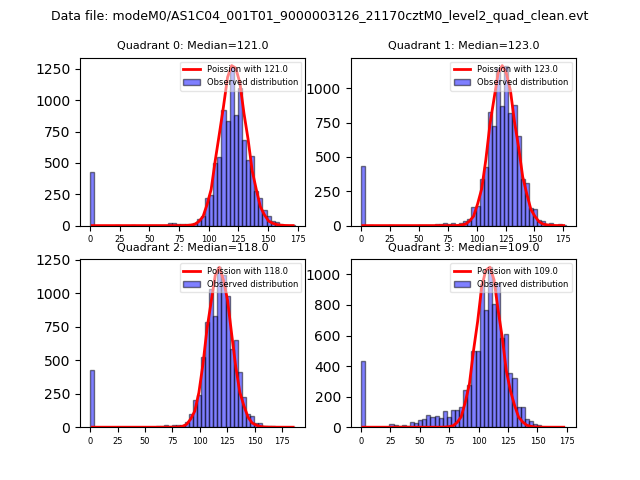 |
 |
| Quadrant-wise count rates Data is divided into 100 sec bins |
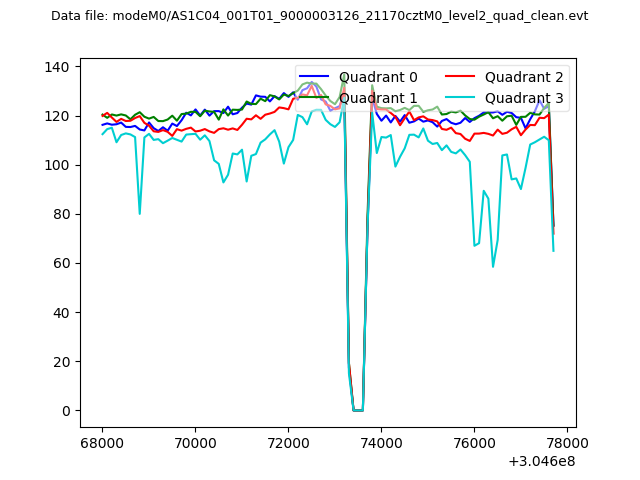 |
|
| Module-wise count rates for Quadrant A Data is divided into 100 sec bins |
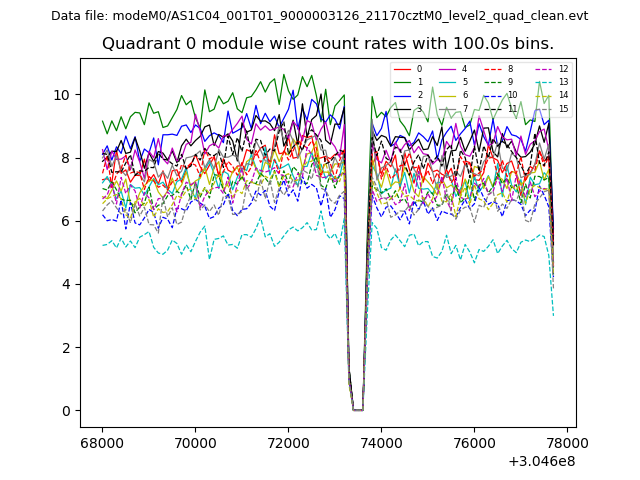 |
 |
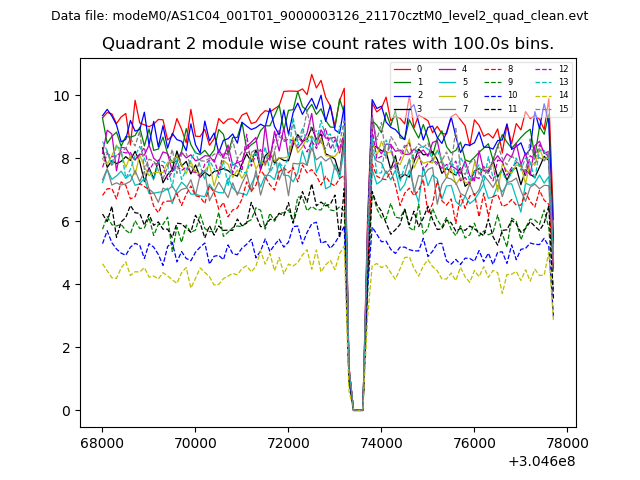
| Module-wise count rates for Quadrant B Data is divided into 100 sec bins |
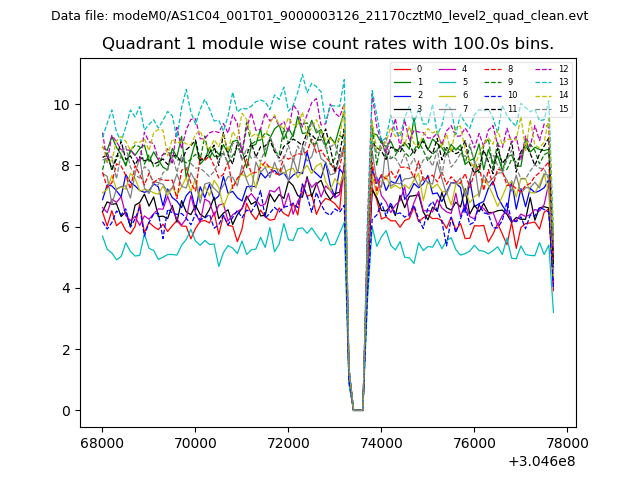 |
 |
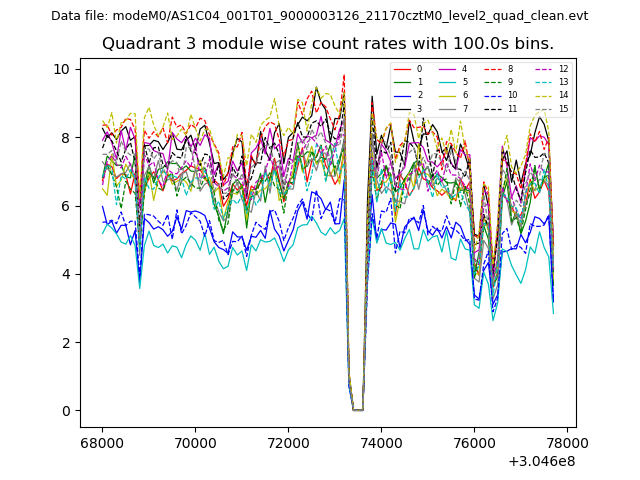
| Module-wise count rates for Quadrant C Data is divided into 100 sec bins |
 |
 |
| Module-wise count rates for Quadrant D Data is divided into 100 sec bins |
 |
 |
| Parameter | Plot |
|---|---|
| CZT HV Monitor |  |
| D_VDD | 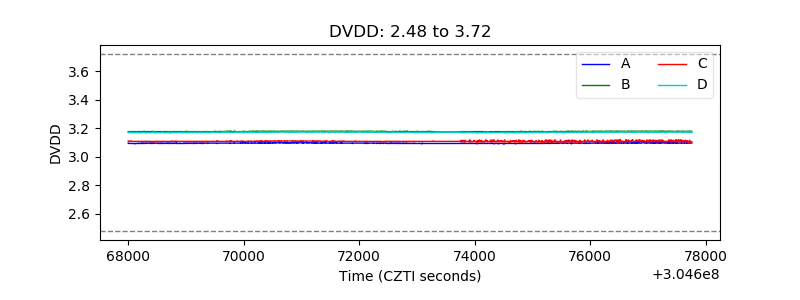 |
| Temperature 1 | 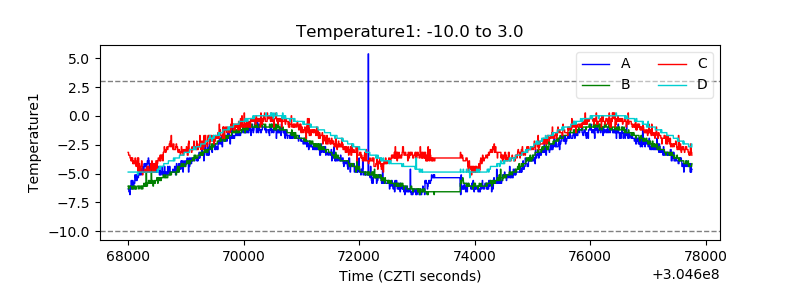 |
| Veto HV Monitor | 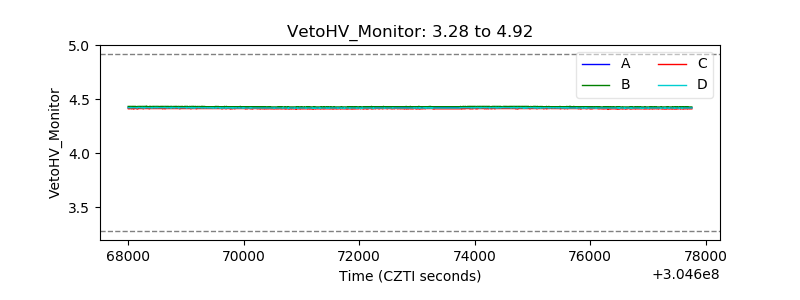 |
| Veto LLD | 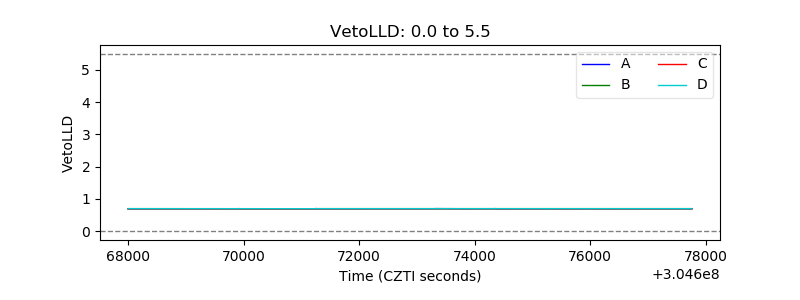 |
| Alpha Counter | 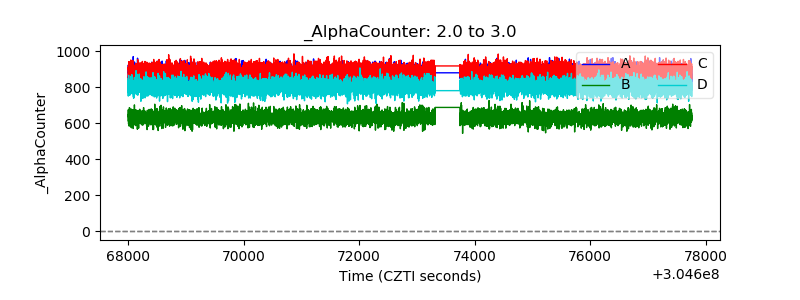 |
| _CPM_Rate | 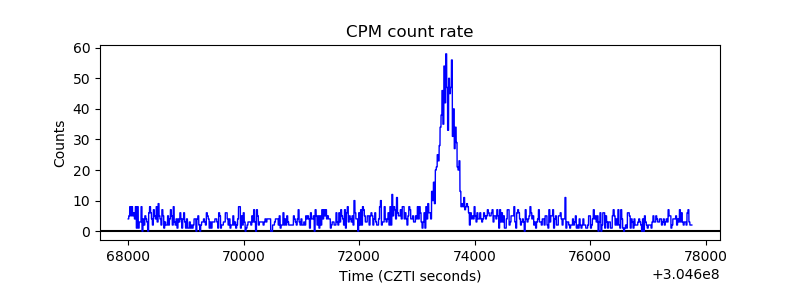 |
| CZT Counter |  |
| +2.5 Volts monitor |  |
| +5 Volts monitor | 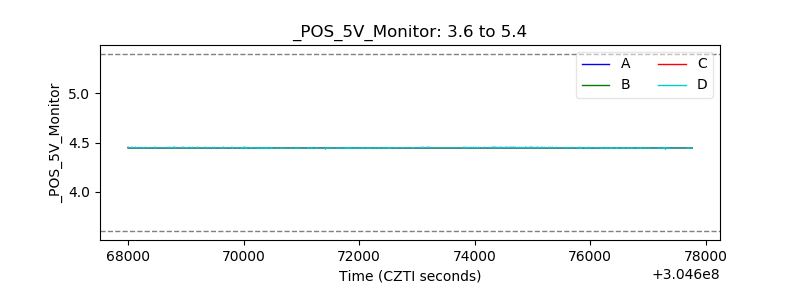 |
| _ROLL_ROT | 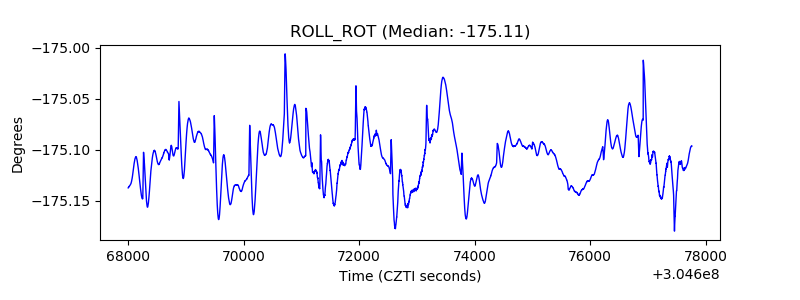 |
| _Roll_DEC | 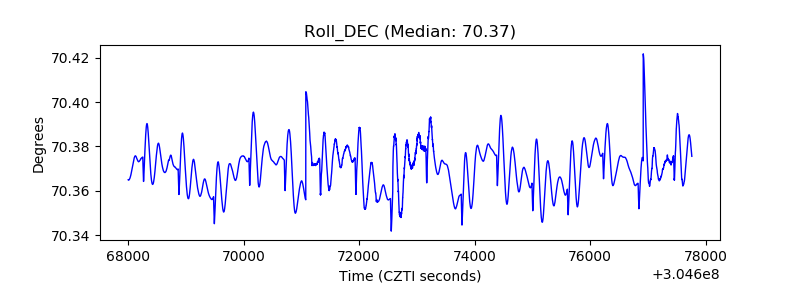 |
| _Roll_RA | 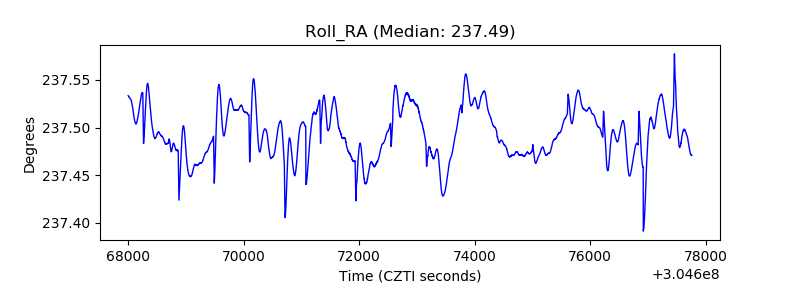 |
| Veto Counter | 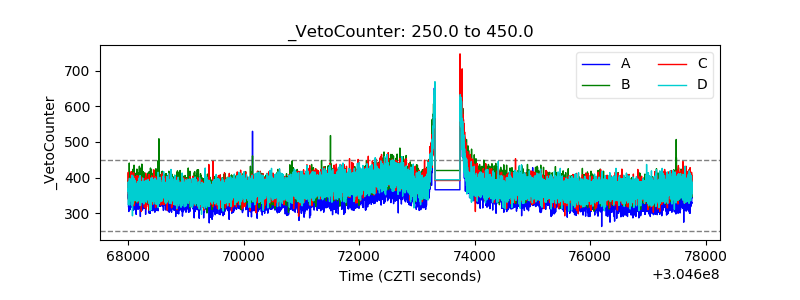 |