| Param | Original file | Final file |
|---|---|---|
| Filename | modeM0/AS1A05_062T01_9000003132cztM0_level2.fits | modeM0/AS1A05_062T01_9000003132cztM0_level2_quad_clean.evt |
| Size (bytes) | 444,519,360 | 318,274,560 |
| Size | 423.9 MB | 303.5 MB |
| Events in quadrant A | 2,764,160 | 1,728,713 |
| Events in quadrant B | 2,664,084 | 1,744,123 |
| Events in quadrant C | 2,695,264 | 1,678,554 |
| Events in quadrant D | 2,235,066 | 1,382,874 |
| Mode SS | |||
|---|---|---|---|
| Quadrant | BADHDUFLAG | Total packets | Discarded packets |
| A | 0 | 918 | 0 |
| B | 0 | 918 | 0 |
| C | 0 | 918 | 0 |
| D | 0 | 918 | 0 |
| Mode M9 | |||
|---|---|---|---|
| Quadrant | BADHDUFLAG | Total packets | Discarded packets |
| A | 0 | 78 | 0 |
| B | 0 | 78 | 0 |
| C | 0 | 78 | 0 |
| D | 0 | 78 | 0 |
| Mode M0 | |||
|---|---|---|---|
| Quadrant | BADHDUFLAG | Total packets | Discarded packets |
| A | 0 | 97899 | 0 |
| B | 0 | 98857 | 0 |
| C | 0 | 94678 | 0 |
| D | 0 | 158257 | 0 |
| Quadrant | Total seconds | Saturated seconds | Saturation percentage |
|---|---|---|---|
| A | 45207 | 611 | 1.351561% |
| B | 45207 | 707 | 1.563917% |
| C | 45207 | 766 | 1.694428% |
| D | 45207 | 3603 | 7.970005% |
Noise dominated data is calculated using 1-second bins in cleaned event files. If a bin has >2000 counts, and if more than 50% of those come from <1% of pixels, then it is considered to be noise-dominated and hence unusable.
| Quadrant | # 1 sec bins | Bins with >0 counts | Bins with >2000 counts | High rate bins dominated by noise | Noise dominated (total time) | Noise dominated (detector-on time) | Marked lightcurve |
|---|---|---|---|---|---|---|---|
| A | 52917 | 45206 | 0 | 0 | 0.00% | 0.00% |  |
| B | 52917 | 45207 | 0 | 0 | 0.00% | 0.00% |  |
| C | 52917 | 45205 | 0 | 0 | 0.00% | 0.00% |  |
| D | 52917 | 45160 | 0 | 0 | 0.00% | 0.00% |  |
Top three noisy pixels from each quadrant. If the there are fewer than three noisy pixels in the level2.evt file, extra rows are filled as -1
| Pixel properties | Quadrant properties | ||||||
|---|---|---|---|---|---|---|---|
| Quadrant | DetID | PixID | Counts | Sigma | Mean | Median | Sigma |
| A | 0 | 29 | 2750 | 11.66 | 720 | 676 | 177.9 |
| A | 7 | 110 | 2285 | 9.05 | 720 | 676 | 177.9 |
| A | 0 | 30 | 2184 | 8.48 | 720 | 676 | 177.9 |
| B | 2 | 9 | 2090 | 10.22 | 705 | 674 | 138.5 |
| B | 2 | 8 | 1769 | 7.9 | 705 | 674 | 138.5 |
| B | 14 | 254 | 1764 | 7.87 | 705 | 674 | 138.5 |
| C | 1 | 81 | 2109 | 7.91 | 710 | 665 | 182.6 |
| C | 1 | 80 | 2037 | 7.51 | 710 | 665 | 182.6 |
| C | 12 | 241 | 1967 | 7.13 | 710 | 665 | 182.6 |
| D | 3 | 14 | 1661 | 6.29 | 640 | 585 | 171.1 |
| D | 10 | 189 | 1590 | 5.87 | 640 | 585 | 171.1 |
| D | 6 | 231 | 1586 | 5.85 | 640 | 585 | 171.1 |
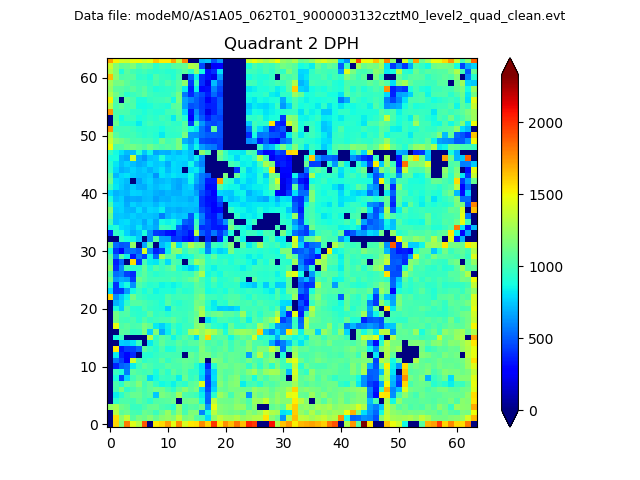
Histogram calculated using DETX and DETY for each event in the final _common_clean file
| Quadrant A | 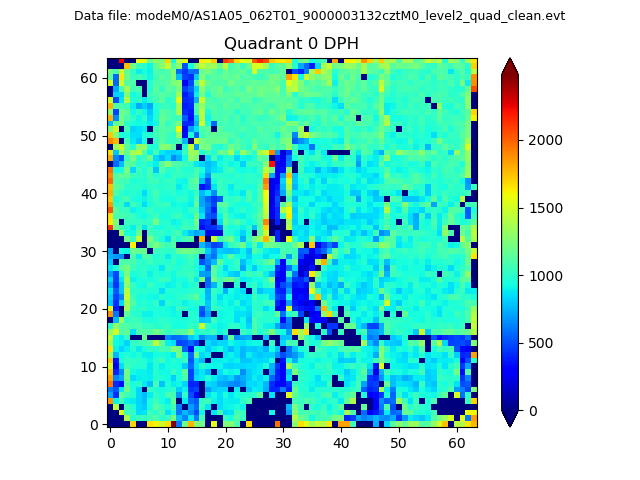 |
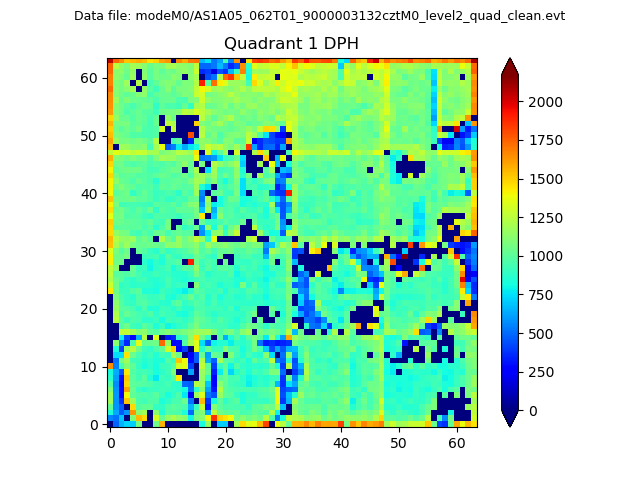 |
Quadrant B |
|---|---|---|---|
| Quadrant D | 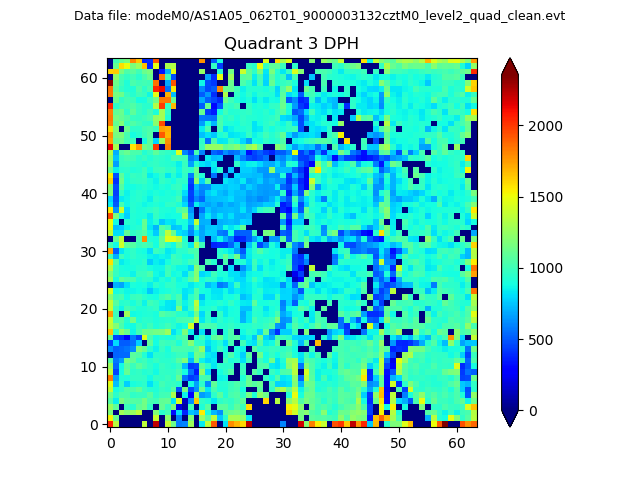 |
 |
Quadrant C |
| Plot type | Count rate plots | Images |
|---|---|---|
| Comparison with Poisson distribution Blue bars denote a histogram of data divided into 1 sec bins. Red curve is a Poisson curve with rate = median count rate of data. |
 |
 |
| Quadrant-wise count rates Data is divided into 100 sec bins |
 |
|
| Module-wise count rates for Quadrant A Data is divided into 100 sec bins |
 |
 |
| Module-wise count rates for Quadrant B Data is divided into 100 sec bins |
 |
 |
| Module-wise count rates for Quadrant C Data is divided into 100 sec bins |
 |
 |
| Module-wise count rates for Quadrant D Data is divided into 100 sec bins |
 |
 |
| Parameter | Plot |
|---|---|
| CZT HV Monitor |  |
| D_VDD |  |
| Temperature 1 |  |
| Veto HV Monitor |  |
| Veto LLD |  |
| Alpha Counter |  |
| _CPM_Rate |  |
| CZT Counter |  |
| +2.5 Volts monitor |  |
| +5 Volts monitor |  |
| _ROLL_ROT |  |
| _Roll_DEC |  |
| _Roll_RA |  |
| Veto Counter |  |